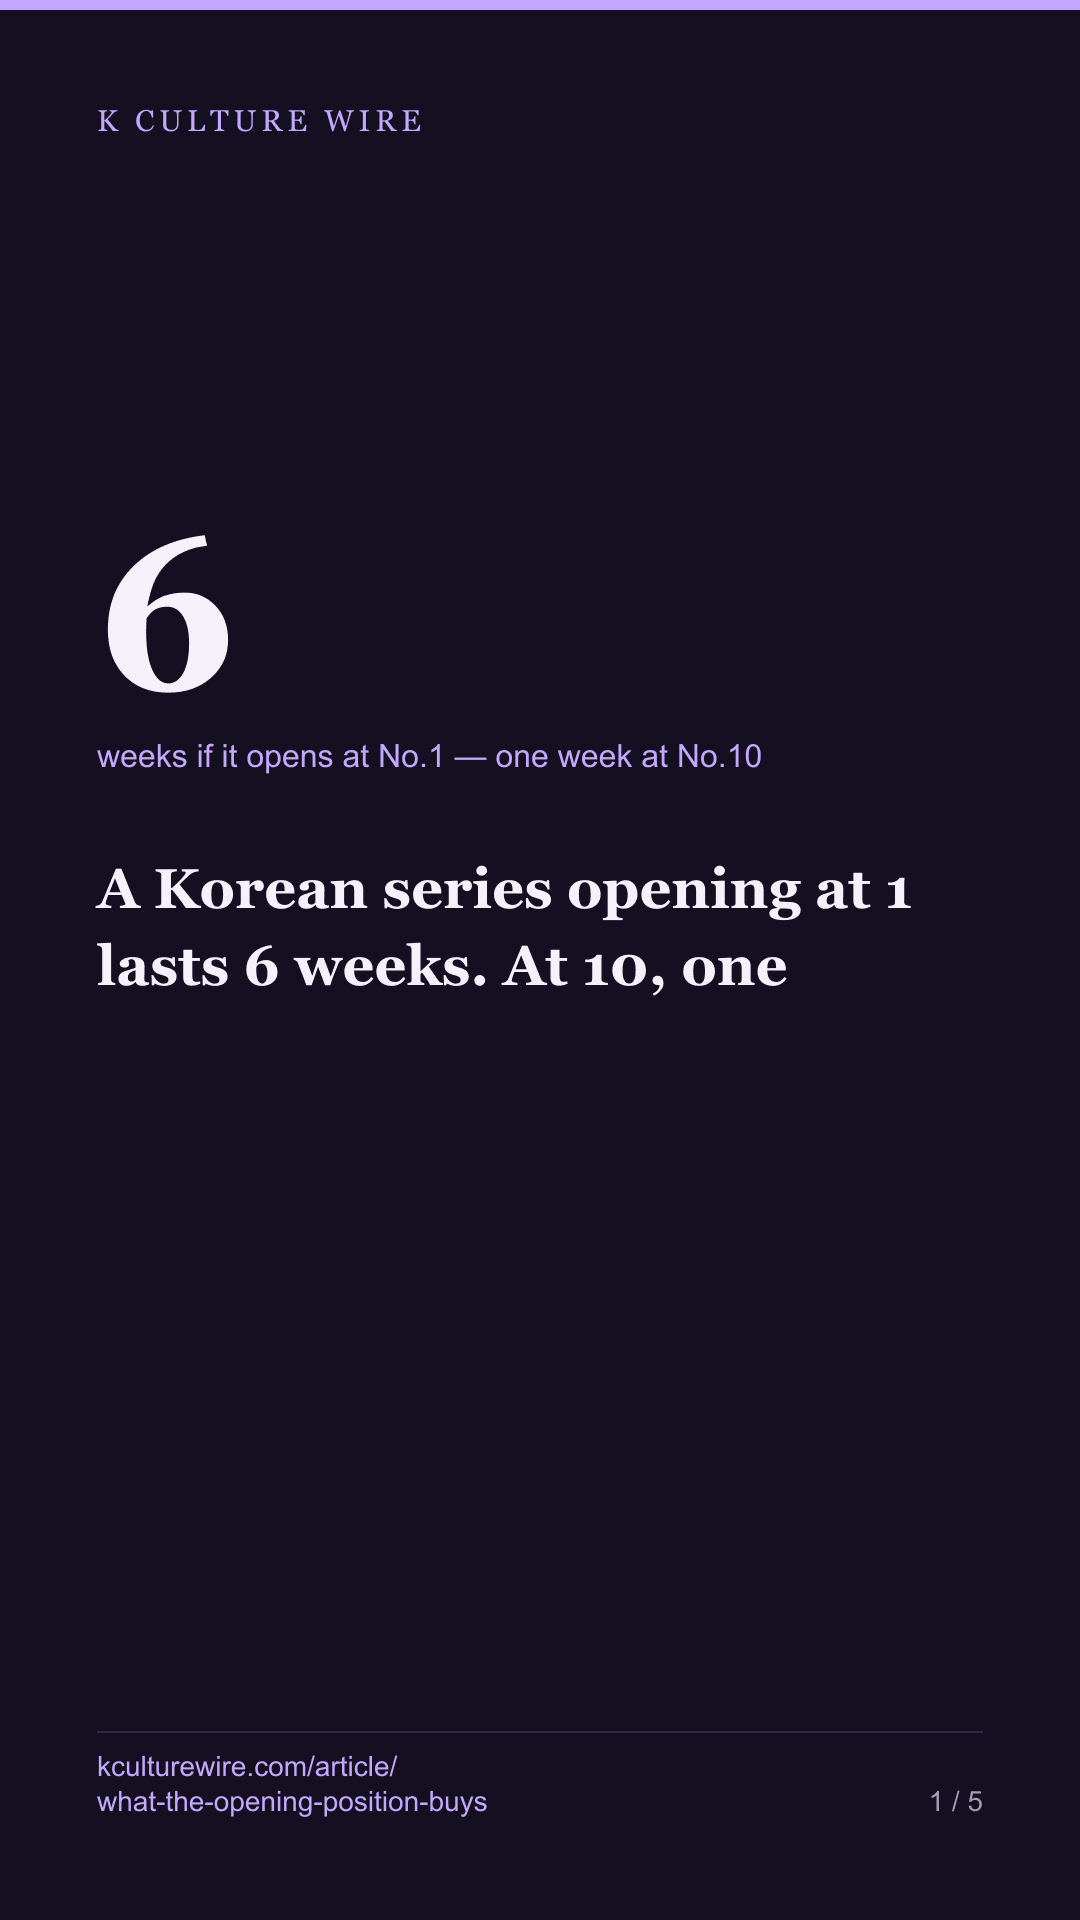
A Korean series opening at 1 lasts 6 weeks. At 10, one
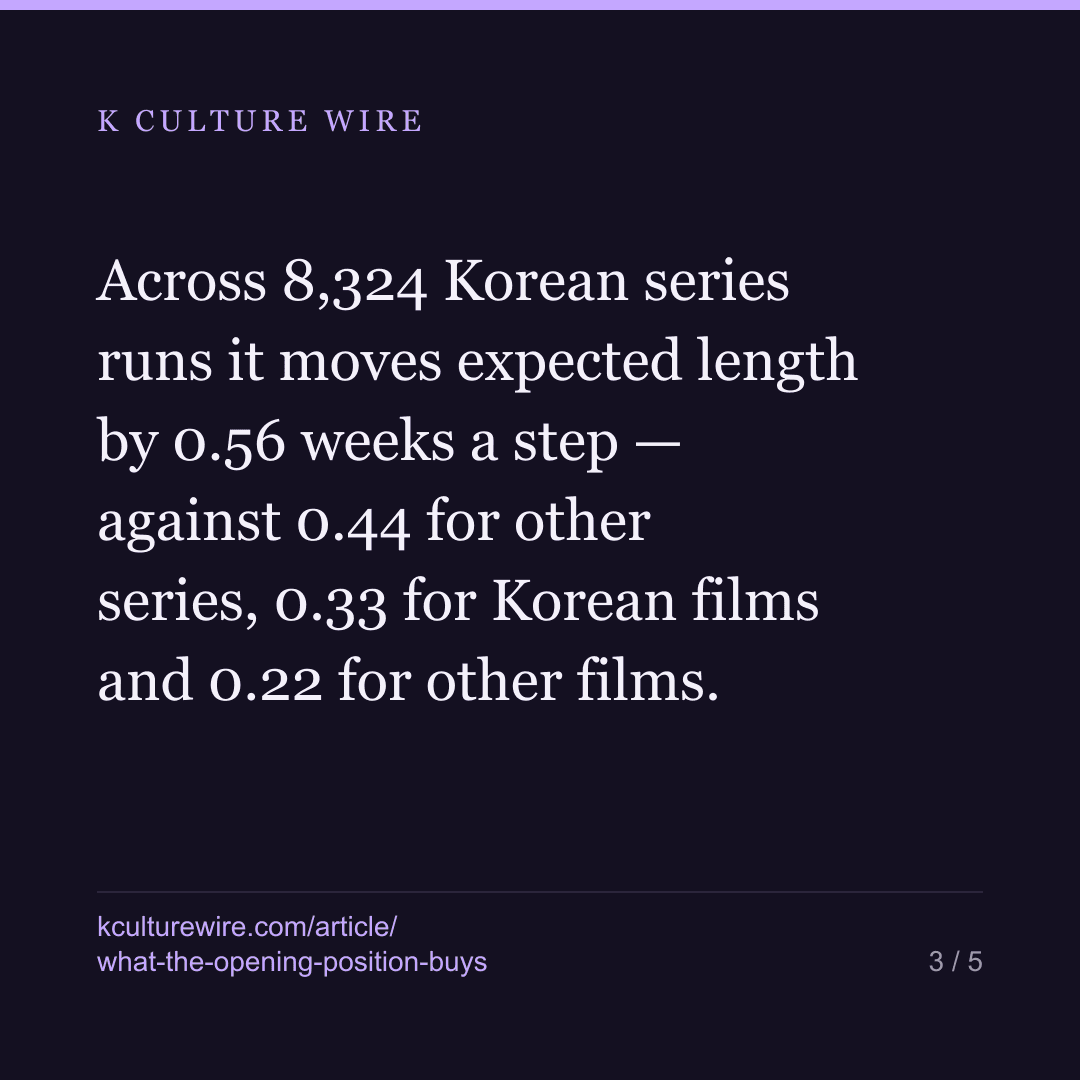
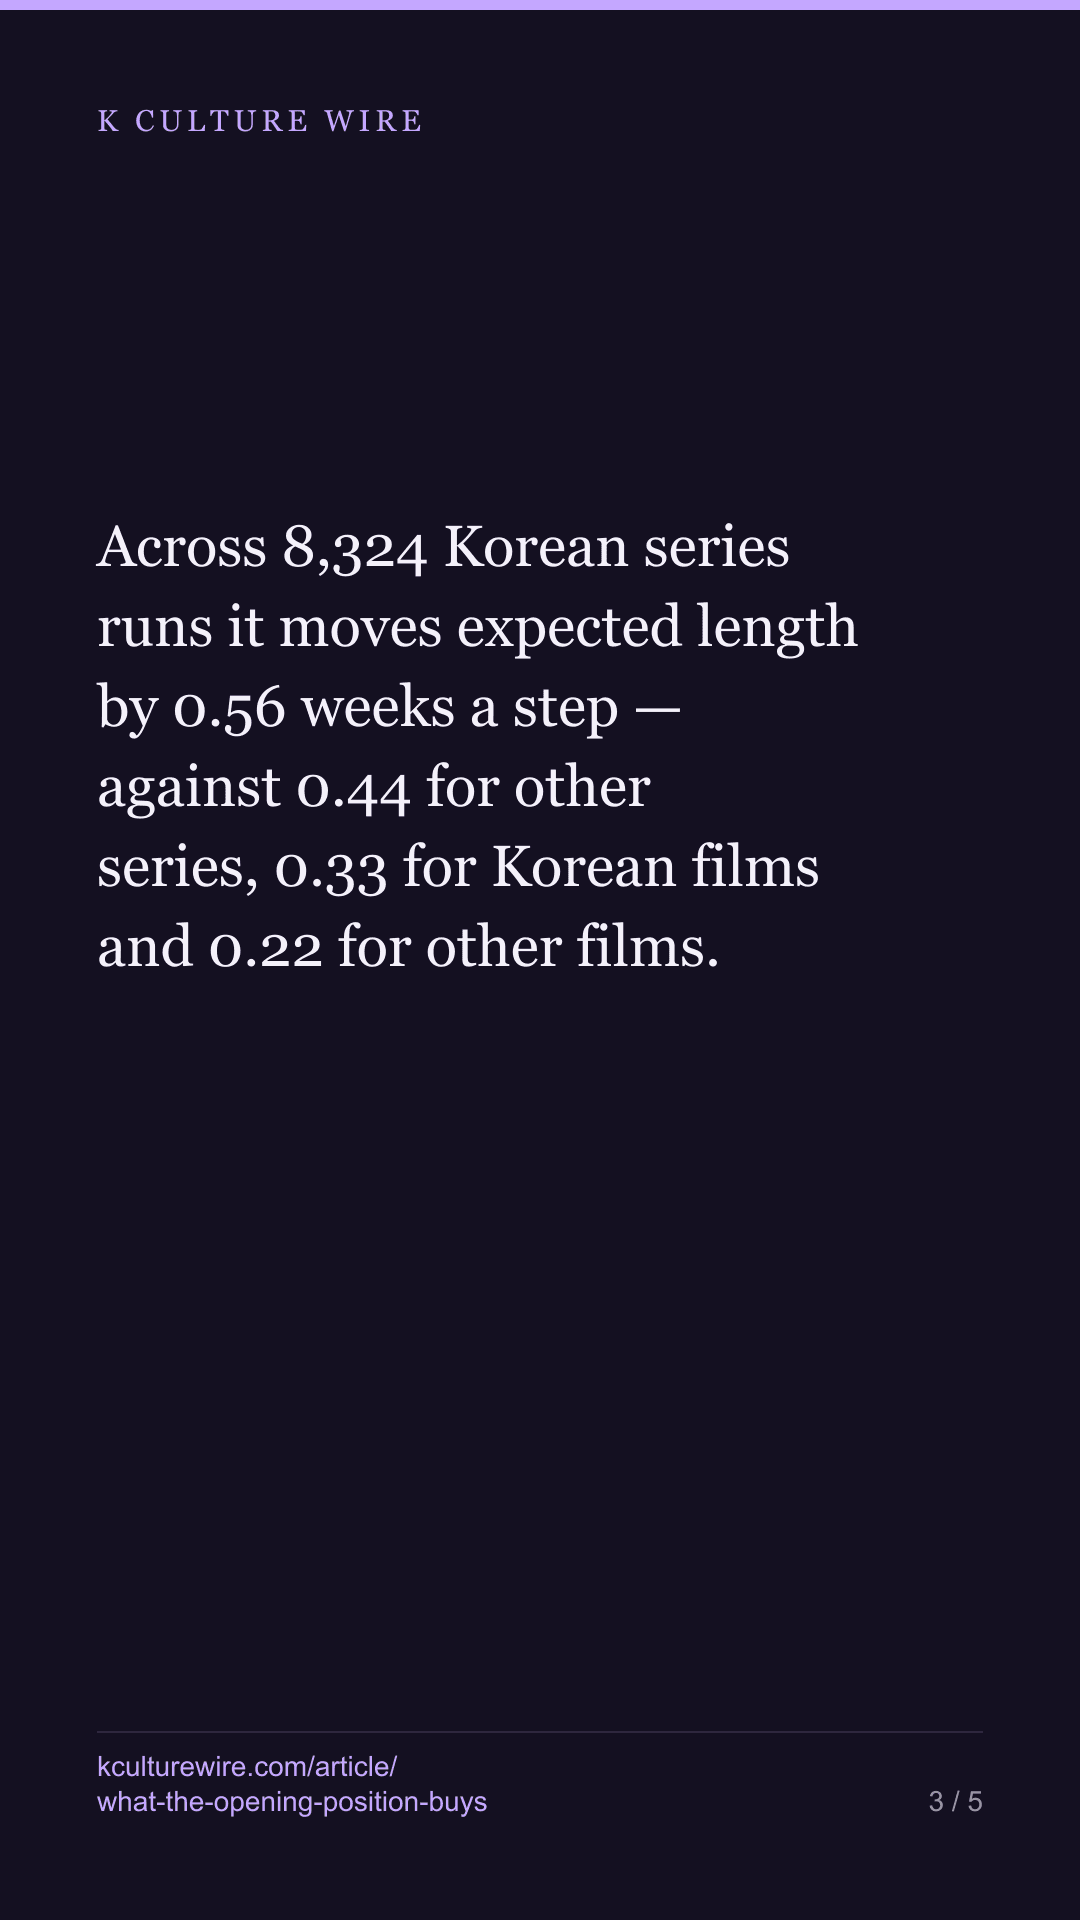
Opening position is the only fact anyone has on the first Monday. Across 8,324 Korean series runs it moves expected length by 0.56 weeks a step — against 0.44 for other series, 0.33 for Korean films and 0.22 for other films.
The table this is written from: /opening
On the first Monday there is exactly one fact: the title is on a country’s chart, at some position. Everything else — how it will do, how long it will hold — is not known yet.
We have measured how a title leaves and how long it stays. We had never connected the two ends. So: does the opening position say anything about the length?
For a Korean series, a great deal
| Opened at | Runs | Median weeks | Lasting 4+ weeks | Gone after one week |
|---|---|---|---|---|
| 1 | 505 | 6 | 89.9% | 0.4% |
| 2 | 484 | 5 | 73.3% | 3.3% |
| 3 | 635 | 4 | 61.9% | 6.3% |
| 4 | 731 | 4 | 50.1% | 12% |
| 5 | 823 | 3 | 44.7% | 19% |
| 6 | 879 | 2 | 34.4% | 28% |
| 7 | 907 | 2 | 27.1% | 36.2% |
| 8 | 1,036 | 2 | 24.8% | 41.3% |
| 9 | 1,048 | 2 | 21.2% | 49.9% |
| 10 | 1,172 | 1 | 16.6% | 56% |
A Korean series that opens at number one runs a median of six weeks, and nine in ten of them last a month or more. One that opens at number ten runs one week, and more than half are gone the following Monday.
The middle of the table is where it turns. Above position five, most runs reach four weeks. Below it, most do not.
The same measurement for everyone else
Entering higher could simply last longer on every chart in the world. So each group was measured the same way, and the relationship reduced to one number: how many weeks one position is worth, taken as the gap between the two ends of the table divided by the nine steps between them.
| Runs | Median weeks opening at 1 | Opening at 10 | Weeks per position | |
|---|---|---|---|---|
| Korean series | 8,220 | 6 | 1 | 0.56 |
| Every other series | 79,686 | 5 | 1 | 0.44 |
| Korean films | 4,089 | 4 | 1 | 0.33 |
| Every other film | 118,360 | 3 | 1 | 0.22 |
Two things fall out of that column.
Position is worth more in series than in films — 0.56 and 0.44 against 0.33 and 0.22. A film’s run is short whatever it opens at, so there is less room for the opening to matter.
And position is worth more for Korean titles than for the rest, in both formats. Korean series get 0.56 weeks a step where other series get 0.44; Korean films 0.33 where other films get 0.22. On these charts the opening position is a sharper signal about a Korean title than about anything else.
That is a different statement from “Korean titles last longer”, which we measured separately and which is true of series only. This one says the first week tells you more — the spread between a good opening and a bad one is wider.
What this cannot tell you
It is not a forecast. These are averages over thousands of runs, and the spread inside every position is wide: a quarter of the runs that opened at position 8 still reached four weeks, and one in ten that opened at number one did not.
It also cannot tell you why. A title that opens at number one had something behind it — a marketing push, a returning cast, a season two — and none of that is in a rank table. The opening position is a symptom of whatever produced it, not a cause of what follows.
And a chart is not viewing. A title one place outside a top 10 is invisible here at any level of viewing, so everything above is about time on a rank list and nothing else. Netflix publishes no country-level viewing figures at all.
What changed on 3 September 2026
Our list of Korean titles had been frozen at 8 August. We rebuilt it, it went from 397 titles to 420, and one title we had been counting as Korean (Dangerous Liaisons, the 2022 French film) is not. 31 figures in this piece moved with it. None of them changed what the piece found. The ones a reader is most likely to have quoted:
| Was | Now | |
|---|---|---|
| Runs that opened at No.1 | 506 | 505 |
| Of those, lasting four weeks or more (unchanged) | 89.9% | 89.9% |
| Runs that opened at No.10 | 1,181 | 1,172 |
| Of those, gone after one week | 56.1% | 56% |
Every table above is now generated from the counted file rather than typed out, and a check reads each figure back out of that file on every build. We print what moved rather than swapping it quietly: one wrong number makes the correct ones beside it worth doubting.
Where these numbers come from
Sources
- Netflix — Tudum weekly Top 10 country lists, 493,600 rows read, 2021-07-04 to 2026-07-26, 93 markets, Russia excluded · https://www.netflix.com/tudum/top10
- Wikidata — Korean titles identified by item number and country of origin, using the same single rule as the rest of this publication · https://query.wikidata.org
What we checked
- Films and series are never mixed, because the same data shows Korean films behaving like all films while Korean series do not
- Every non-Korean title on the same charts is measured the same way, since entering higher could last longer on every chart everywhere
- Runs still on a chart in the last week we hold are removed rather than counted as short, and the number removed is published
- The relationship is reported as the difference between the two ends divided by the nine steps between them, so the table is the whole argument and no coefficient hides an assumption
What we left out, and why
- Russia, excluded across this publication because Netflix withdrew and the remaining weeks are not comparable
- 1,860 runs still on a chart in the final week, which have no finished length
The data behind this
Written from the same data
Take this away — 10 cards
The figures in this article, as images. Free to repost with the address on them.

If you work in this business
Everything on this page is measured from the same weekly Netflix lists, per market and per title. We publish the pages free; what we sell is the same measurement cut to one company's catalogue — including the figures behind /opening.
What a company sheet contains, and what it cannot tell you →