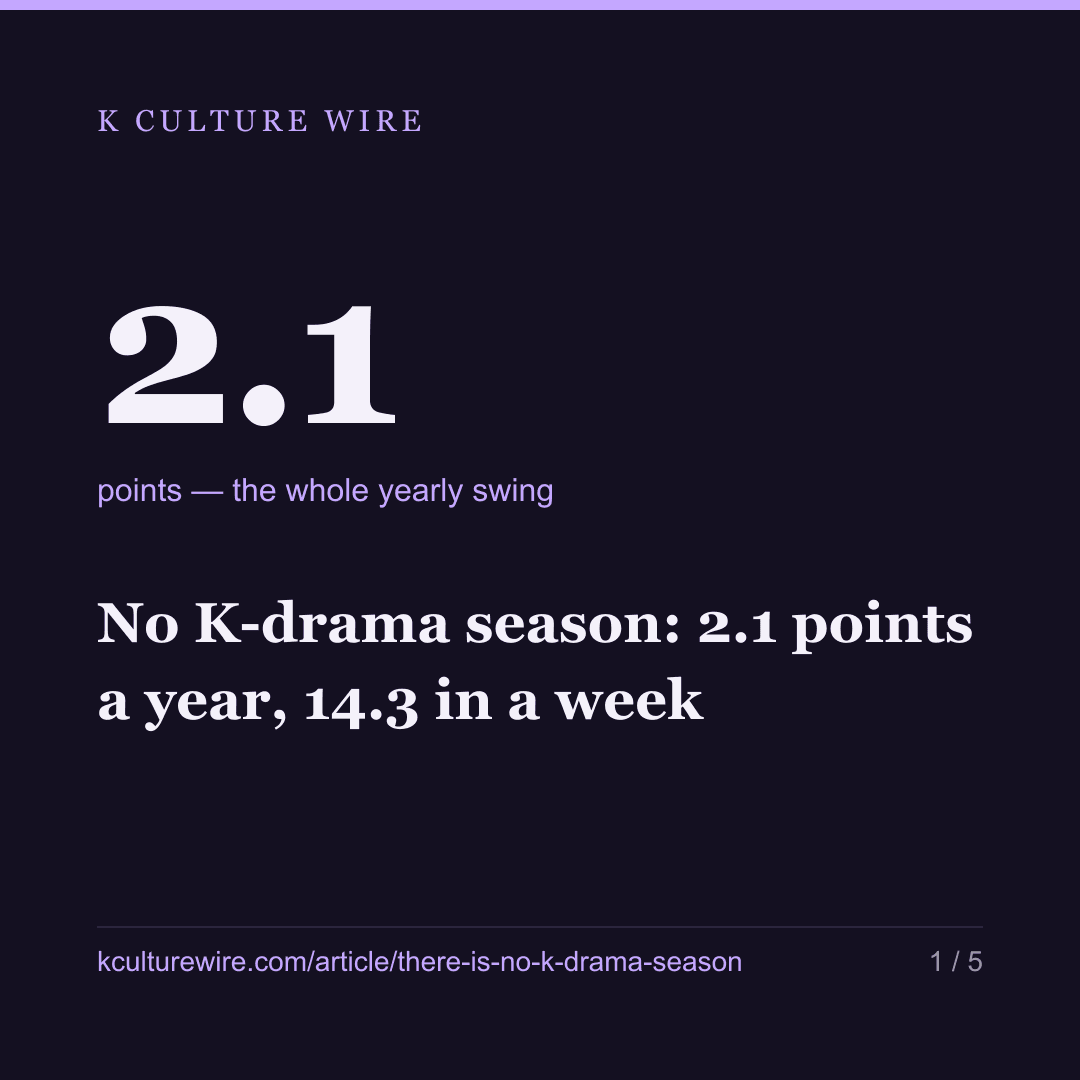
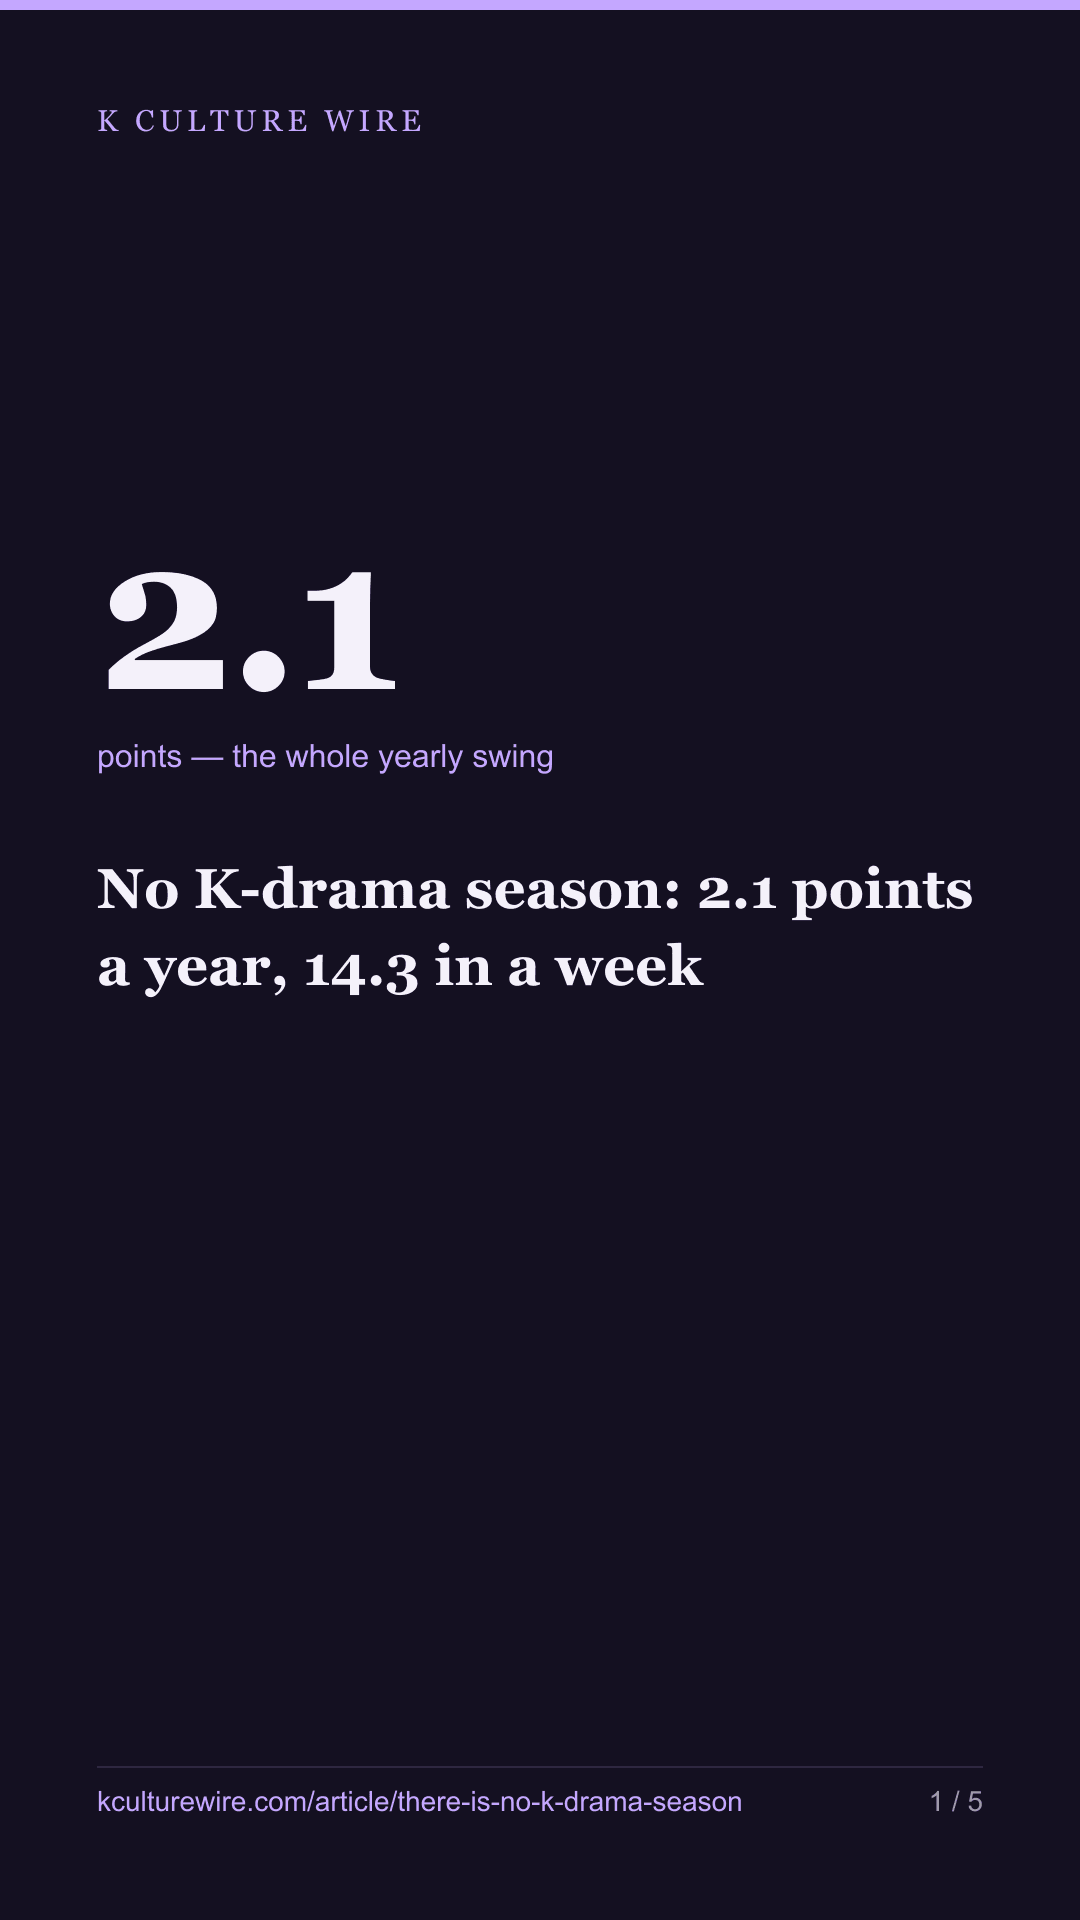
No K-drama season: 2.1 points a year, 14.3 in a week
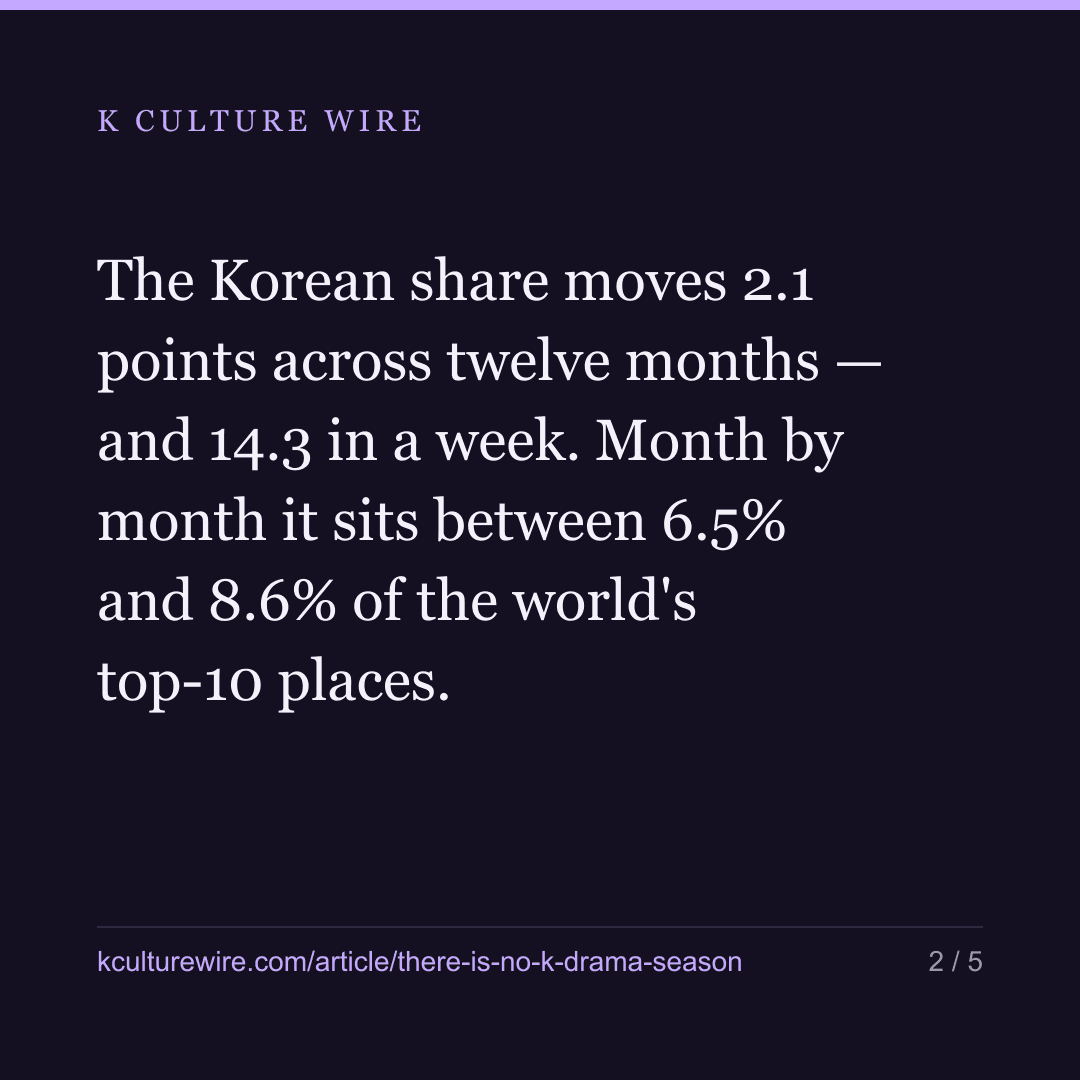
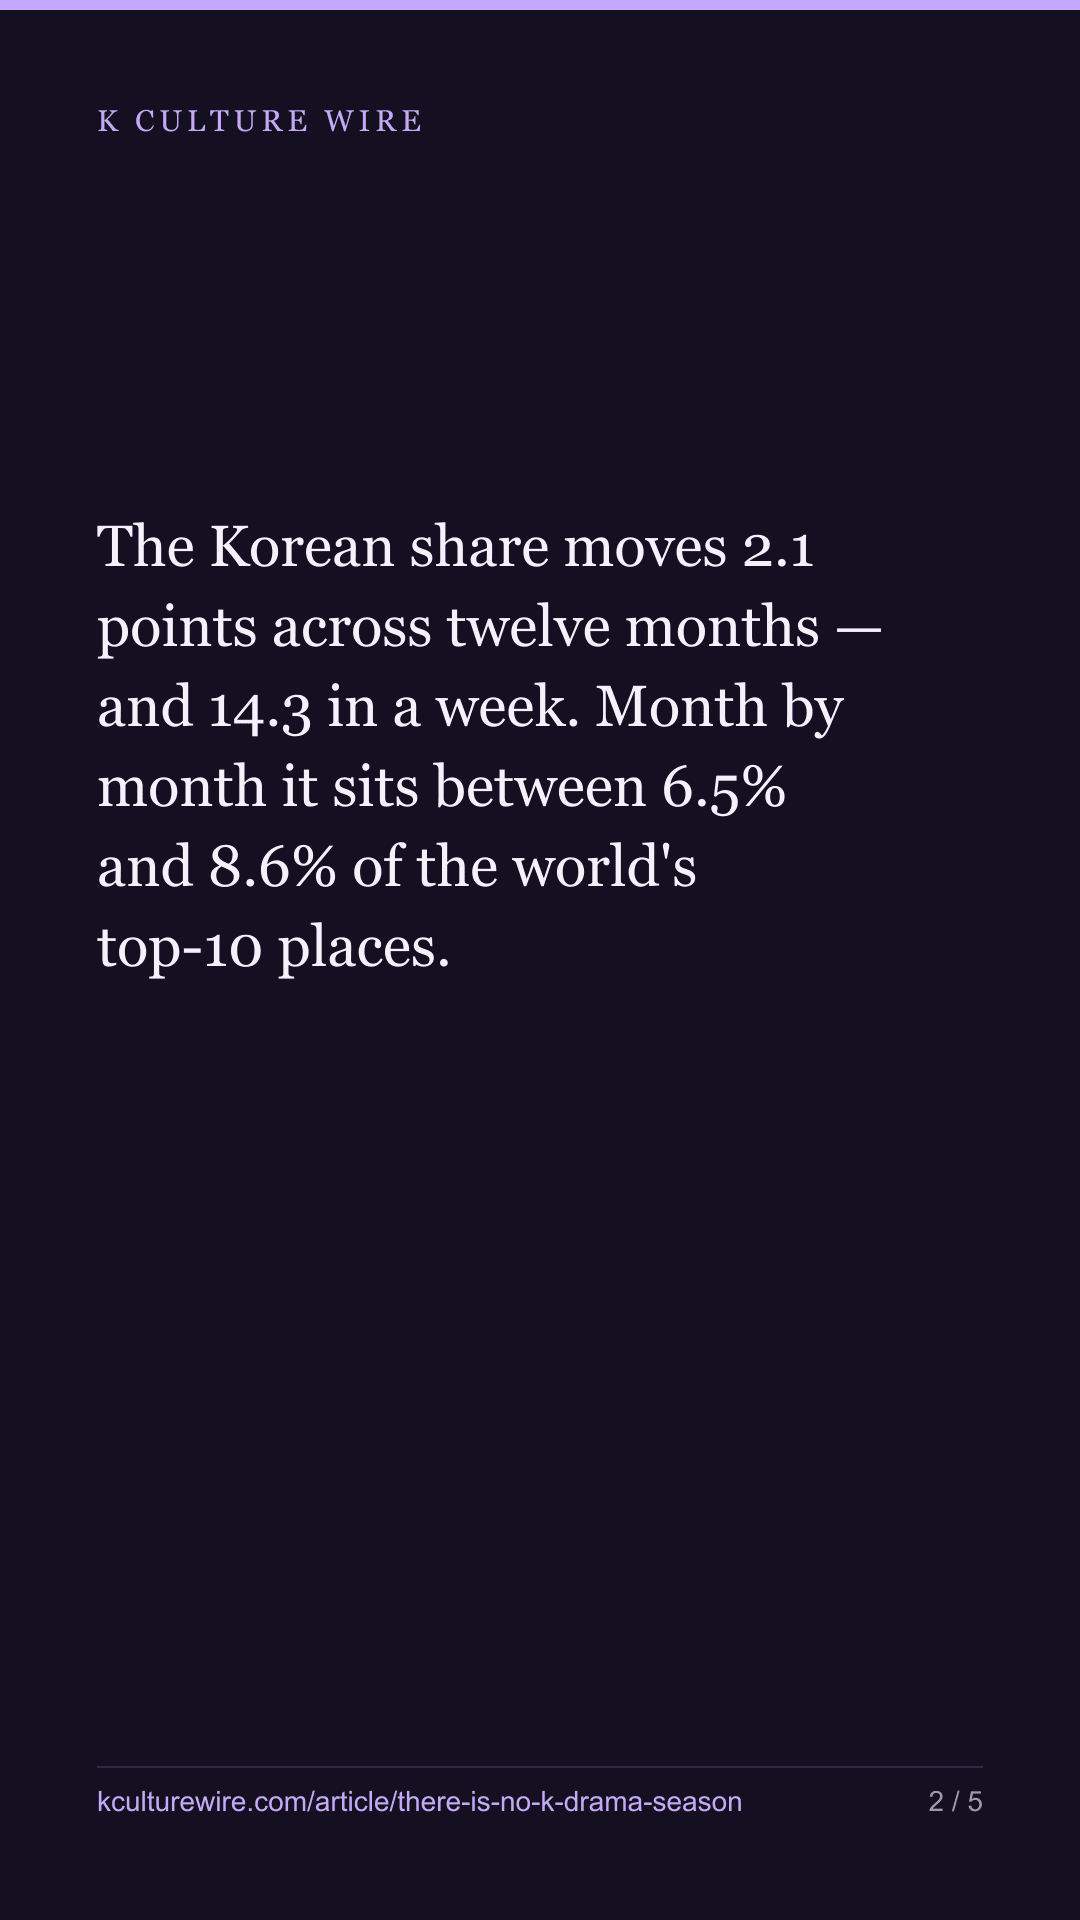
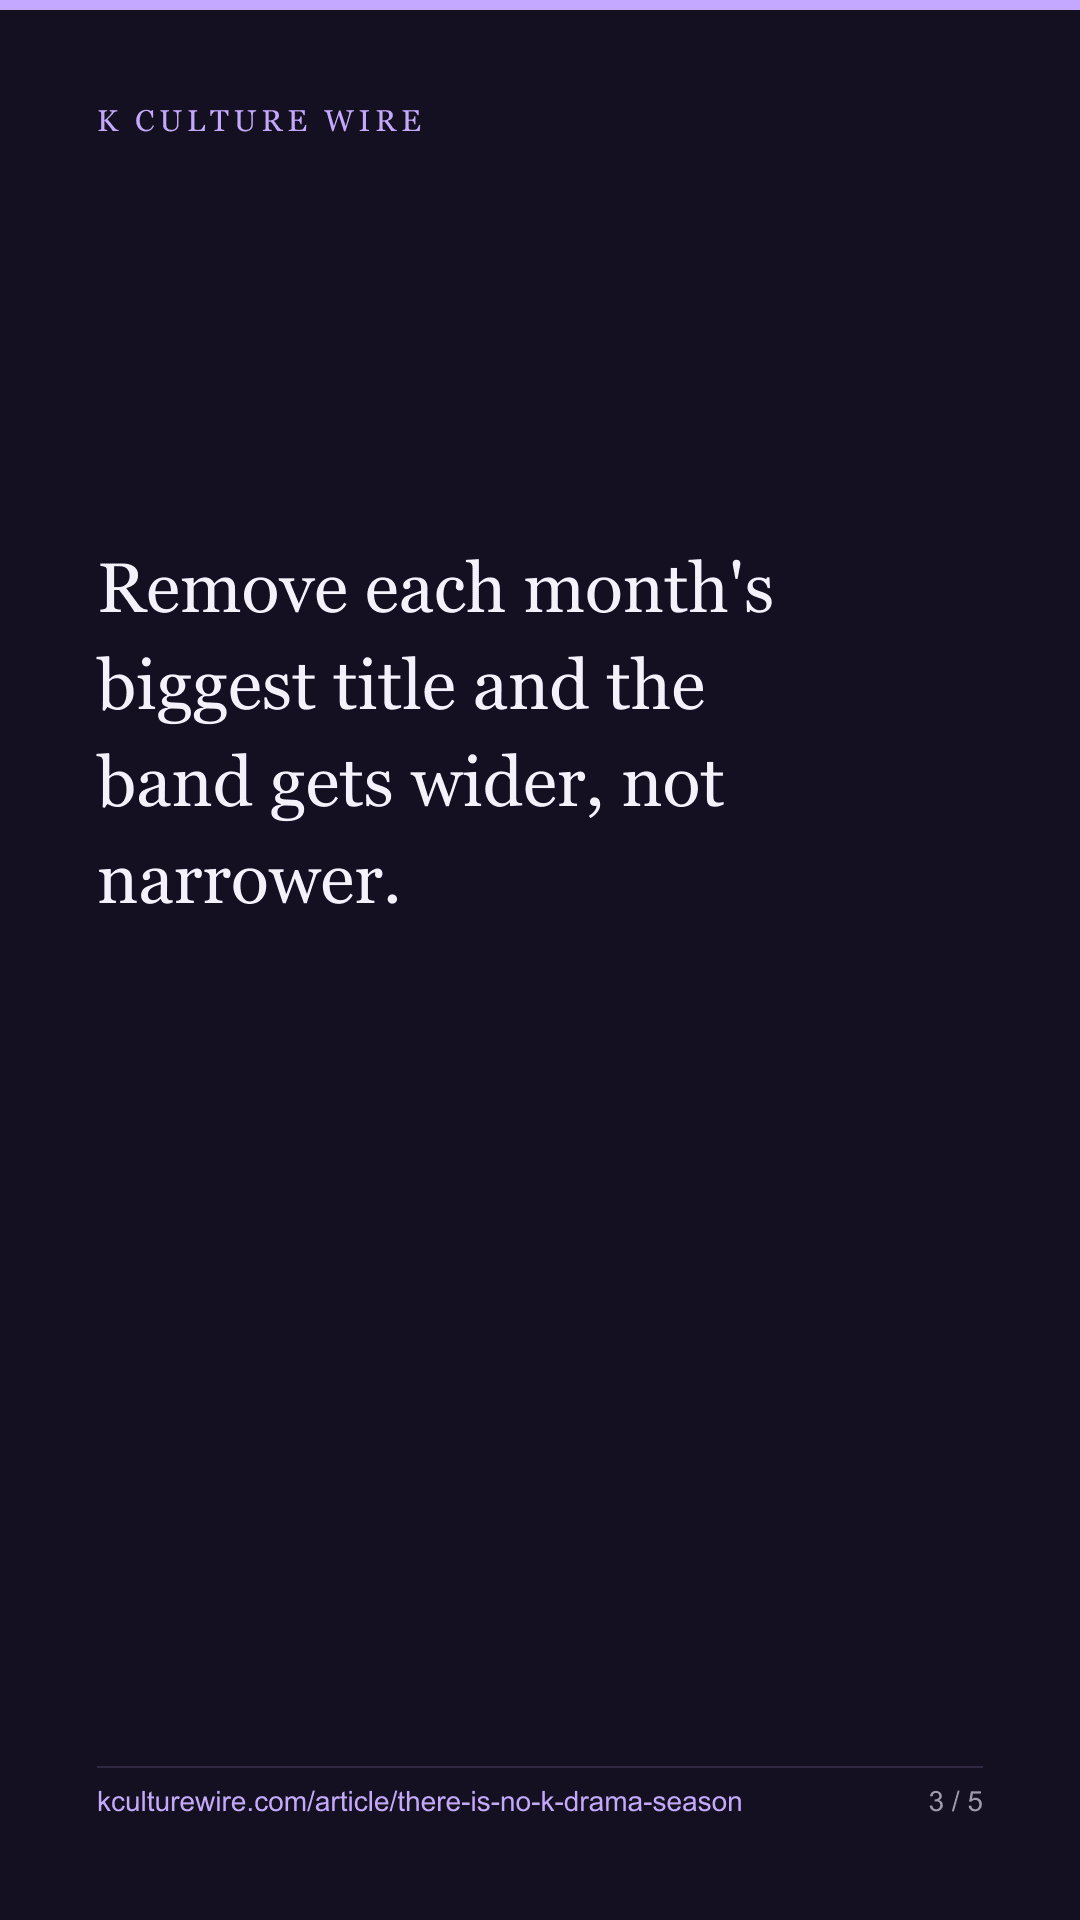
The Korean share moves 2.1 points across twelve months — and 14.3 in a week. Month by month it sits between 6.5% and 8.6% of the world's top-10 places. Remove each month's biggest title and the band gets wider, not narrower.
The table this is written from: /world-share
People plan around a K-drama season the way they plan around a football season. We had no idea whether one existed, so we counted it: across 93 markets and 265 weeks, what share of Netflix’s published top-10 places did Korean titles hold in each calendar month?
Twelve months, 2.1 points
| Month | Korean share | Without that month’s biggest title |
|---|---|---|
| January | 8.4% | 6.8% |
| February | 7.9% | 7% |
| March | 7.9% | 7.4% |
| April | 8.3% | 7.5% |
| May | 7.6% | 7.2% |
| June | 7.1% | 6.7% |
| July | 8.3% | 7.1% |
| August | 8.1% | 7.7% |
| September | 8.6% | 7.9% |
| October | 8% | 7% |
| November | 6.5% | 5.6% |
| December | 7.5% | 6.7% |
The whole year sits at 7.9%. The best month is 8.6% and the worst is 6.5%. That is the entire range: 2.1 points.
For comparison, our world-share page records the highest single week at 16.2% and the lowest at 1.9% — a range of 14.3 points, 6.8 times the monthly one. Whatever moves this number, it is not the month of the year.
The obvious suspect, and what happened to it
A two-point wobble across twelve months could easily be one show. Squid Game is the largest Korean title in five of the twelve months, and in January it alone accounts for a fifth of every Korean chart place in the month.
So we removed each month’s own biggest title and measured again — that is the right-hand column above. If the swing were a title effect, the band should collapse.
It does not. The band goes from 2.1 points to 2.3. Taking the biggest title out of every month leaves the monthly pattern slightly wider than before, which is the opposite of what a one-title explanation predicts.
What we are left with is a very small monthly pattern that we cannot attribute to a single release and cannot explain. We are printing the twelve numbers and stopping there.
Why this is worth knowing anyway
A finding of “no pattern” is worth as much as a pattern when people are already acting as if the pattern exists. If you are deciding when to look for Korean titles on Netflix, the honest answer from five years of charts is that the calendar will not help you. The week will.
That also sets the scale for anything else we publish about this data. A monthly figure that moves by two points is close to flat; when we report a change of ten points — as we did for the nine Asian markets that fell from 30.3% to 19.5% — that is five times the size of the biggest seasonal swing in the same data, which is part of why we believe it.
What this does not say
It does not say Korean releases are evenly spread through the year. Netflix publishes charts, not schedules, and a title released in March can hold places in June. The two questions are different and only one of them is answerable here.
It does not say September is a good month to release into. A 2.2-point band across five years, which does not survive as a story once you look at what is inside it, is not a planning tool and we would rather say so than dress it up as one.
What changed on 3 September 2026
Our list of Korean titles had been frozen at 8 August. We rebuilt it, it went from 397 titles to 420, and one title we had been counting as Korean (Dangerous Liaisons, the 2022 French film) is not. 13 figures in this piece moved with it. None of them changed what the piece found. The ones a reader is most likely to have quoted:
| Was | Now | |
|---|---|---|
| The whole yearly swing | 2.5 points | 2.1 points |
| Best month | 9.1% | 8.6% |
| Worst month | 6.6% | 6.5% |
| The weekly swing, for comparison | 14.2 points | 14.3 points |
Every table above is now generated from the counted file rather than typed out, and a check reads each figure back out of that file on every build. We print what moved rather than swapping it quietly: one wrong number makes the correct ones beside it worth doubting.
Where these numbers come from
Sources
- Netflix — Tudum weekly Top 10 country lists for every country Netflix publishes — 93 markets with a complete record, 265 weeks from 2021-07-04 to 2026-07-26, grouped by calendar month · https://www.netflix.com/tudum/top10
- Wikidata — Country of origin (P495 = Q884) to identify Korean titles, with titles Netflix classes on its English-language global charts excluded · https://query.wikidata.org
What we checked
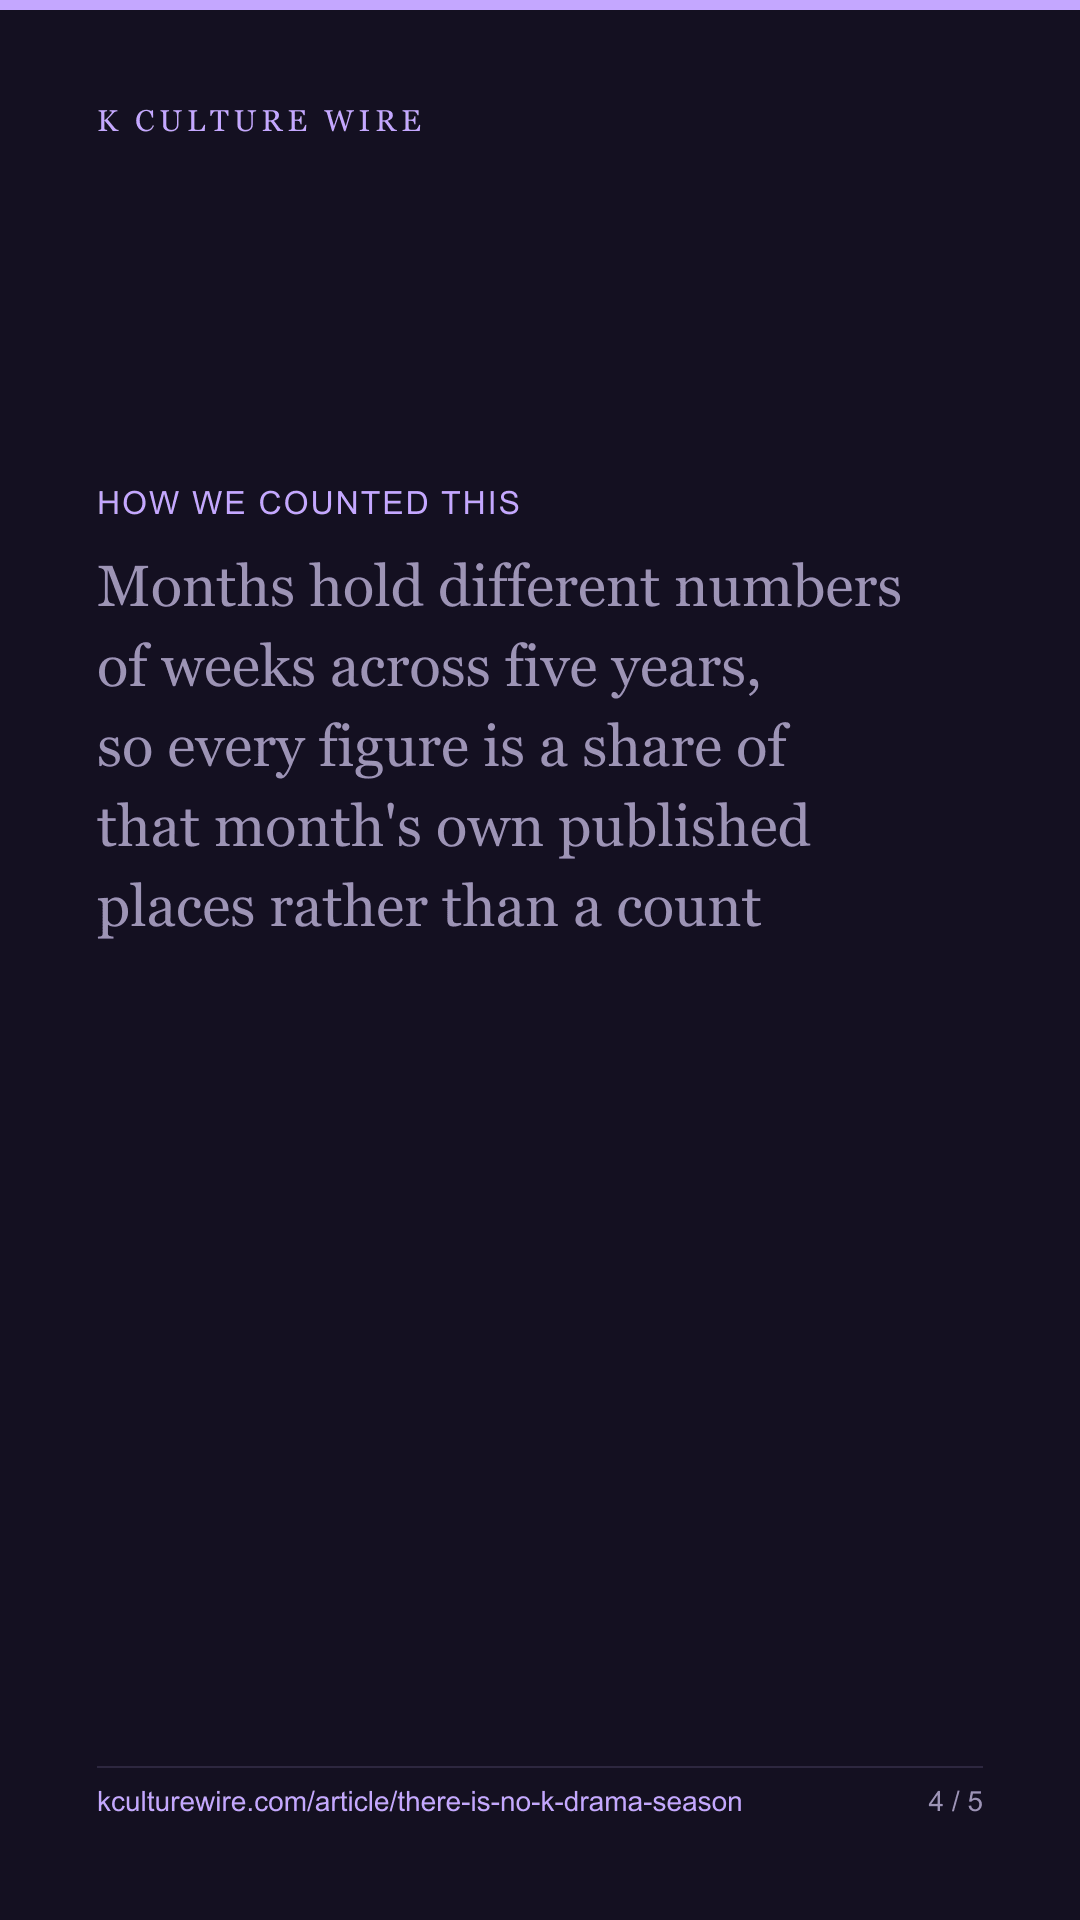
- Months hold different numbers of weeks across five years, so every figure is a share of that month's own published places rather than a count
- The twelve monthly Korean counts sum to the same total our world-share page reports, and the collector refuses to run if they do not
- The collector also refuses to run if the weekly range turns out to be narrower than the monthly one, because that would invert the finding and the piece would need rewriting rather than publishing
What we left out, and why
- Release dates. This counts the weeks a title was on a chart, not when anything came out, and a title released in March can hold places in June
- Viewing. Country lists carry a rank and no hours figure
- Russia, whose list Netflix stopped publishing in February 2022
- Any claim about why September is the highest month. A 2.2-point band across five years of data is not something we are prepared to explain
The data behind this
Written from the same data
Take this away — 10 cards
The figures in this article, as images. Free to repost with the address on them.


If you work in this business
Everything on this page is measured from the same weekly Netflix lists, per market and per title. We publish the pages free; what we sell is the same measurement cut to one company's catalogue — including the figures behind /world-share.
What a company sheet contains, and what it cannot tell you →