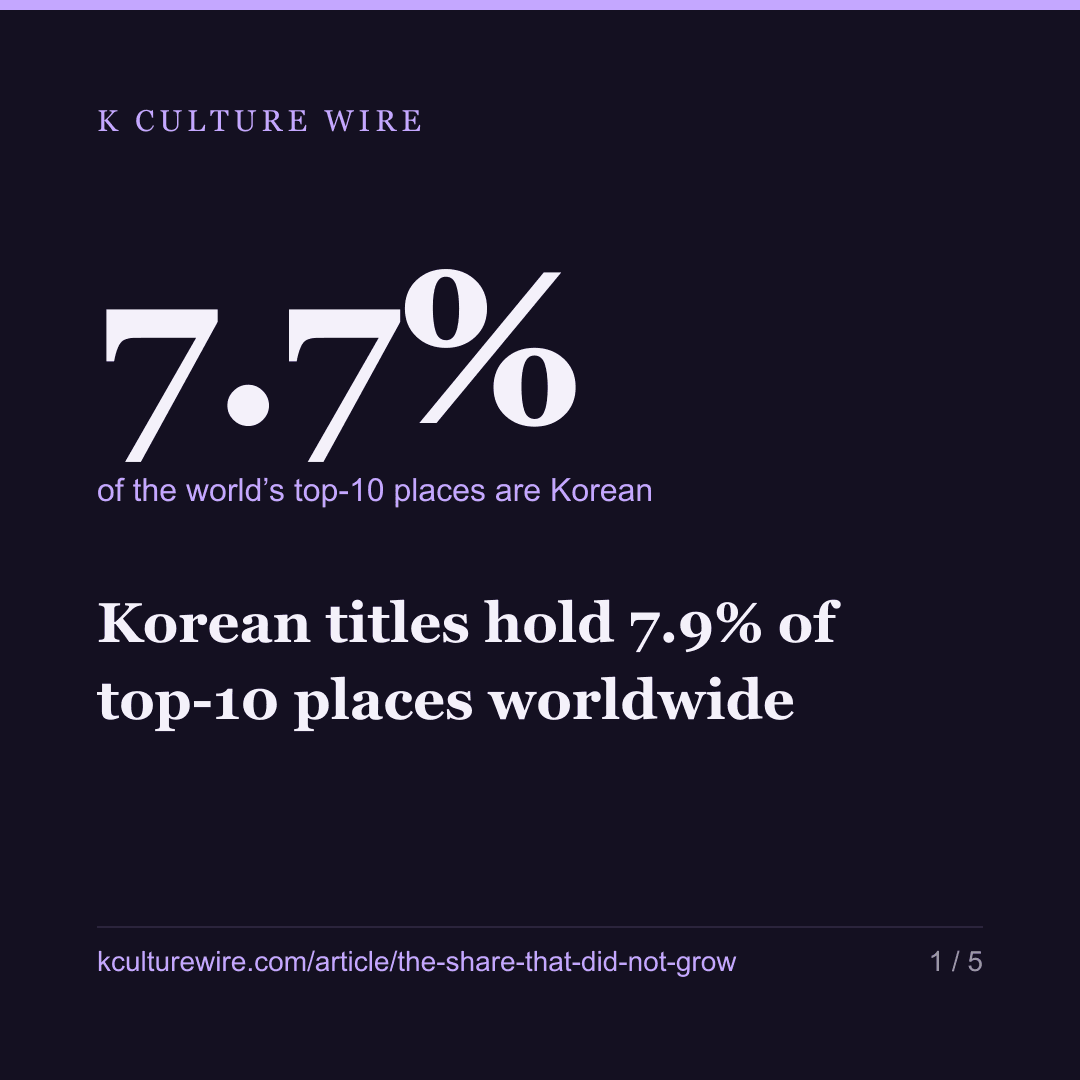
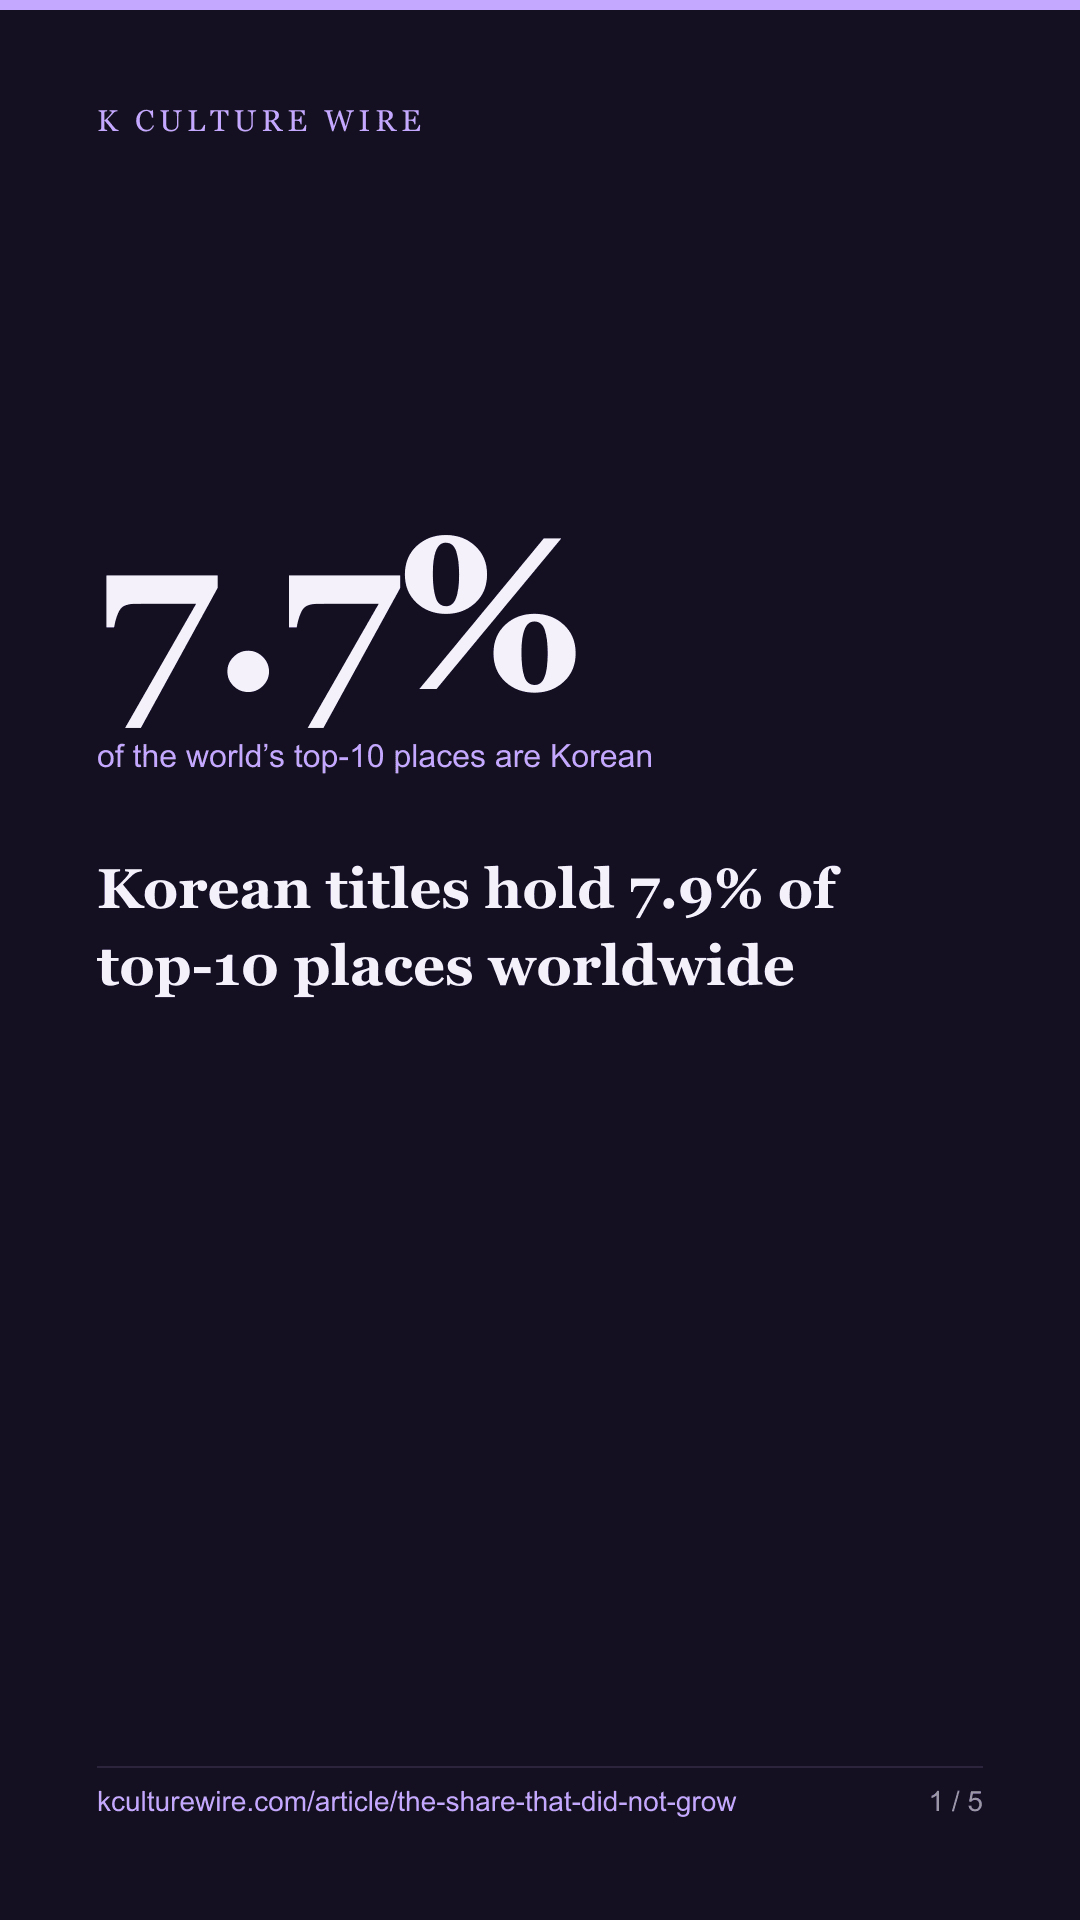
Korean titles hold 7.9% of top-10 places worldwide
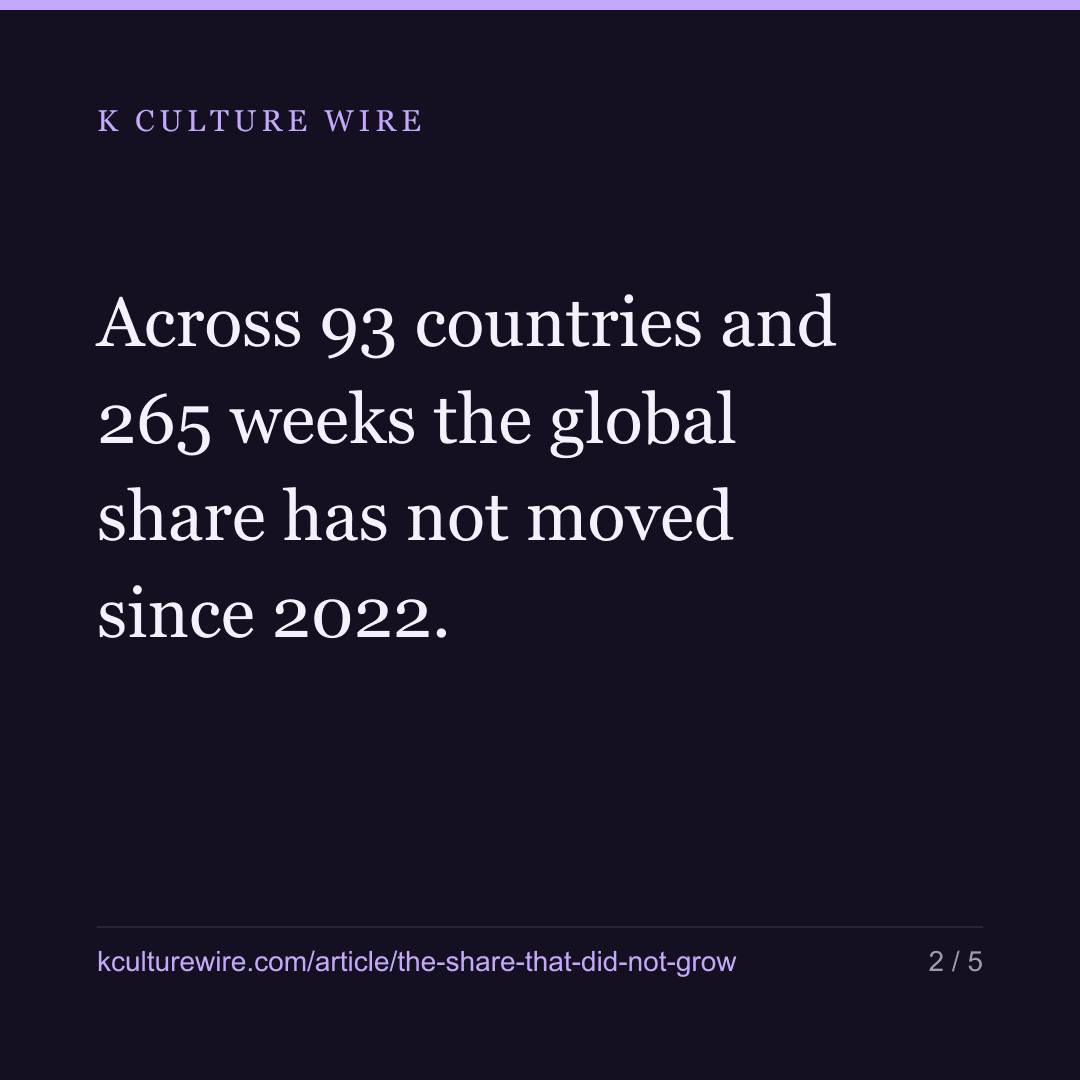
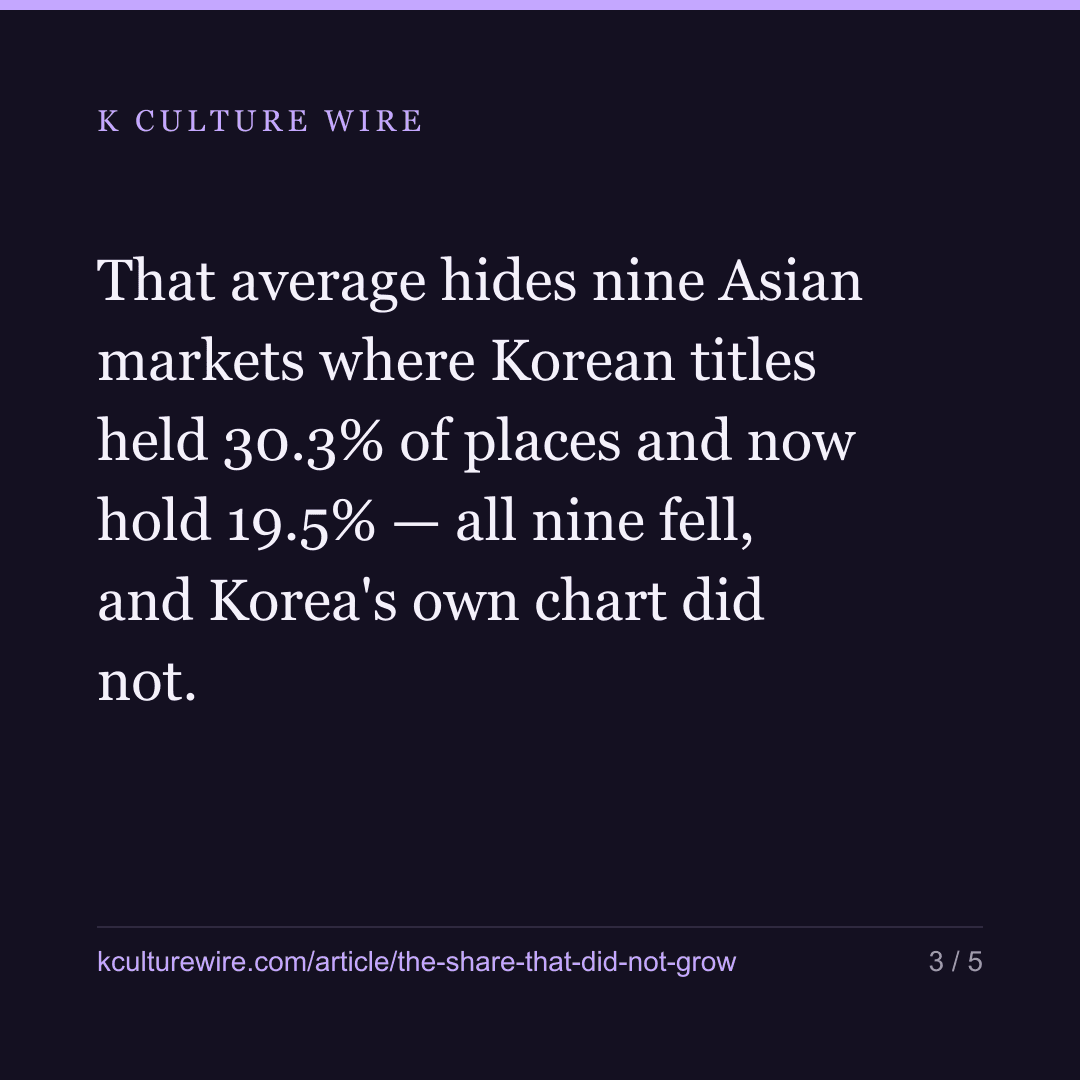
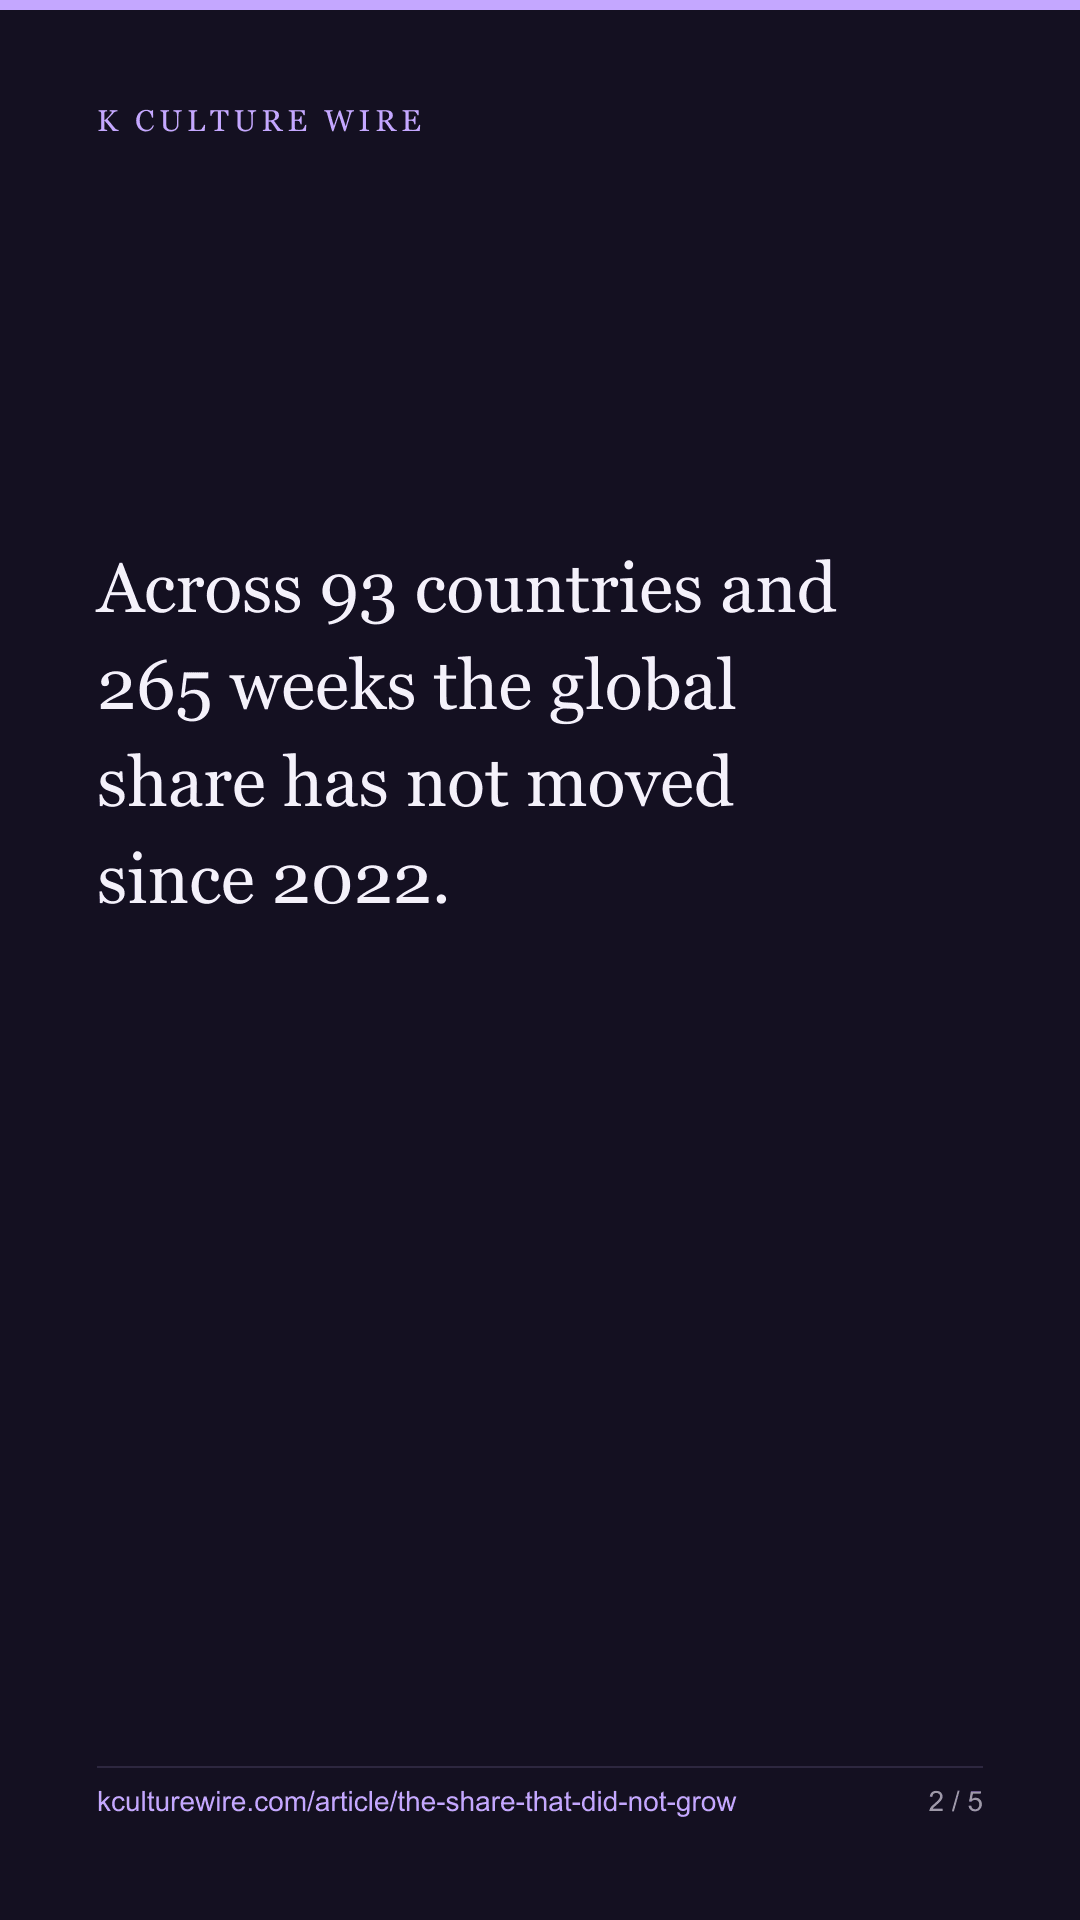
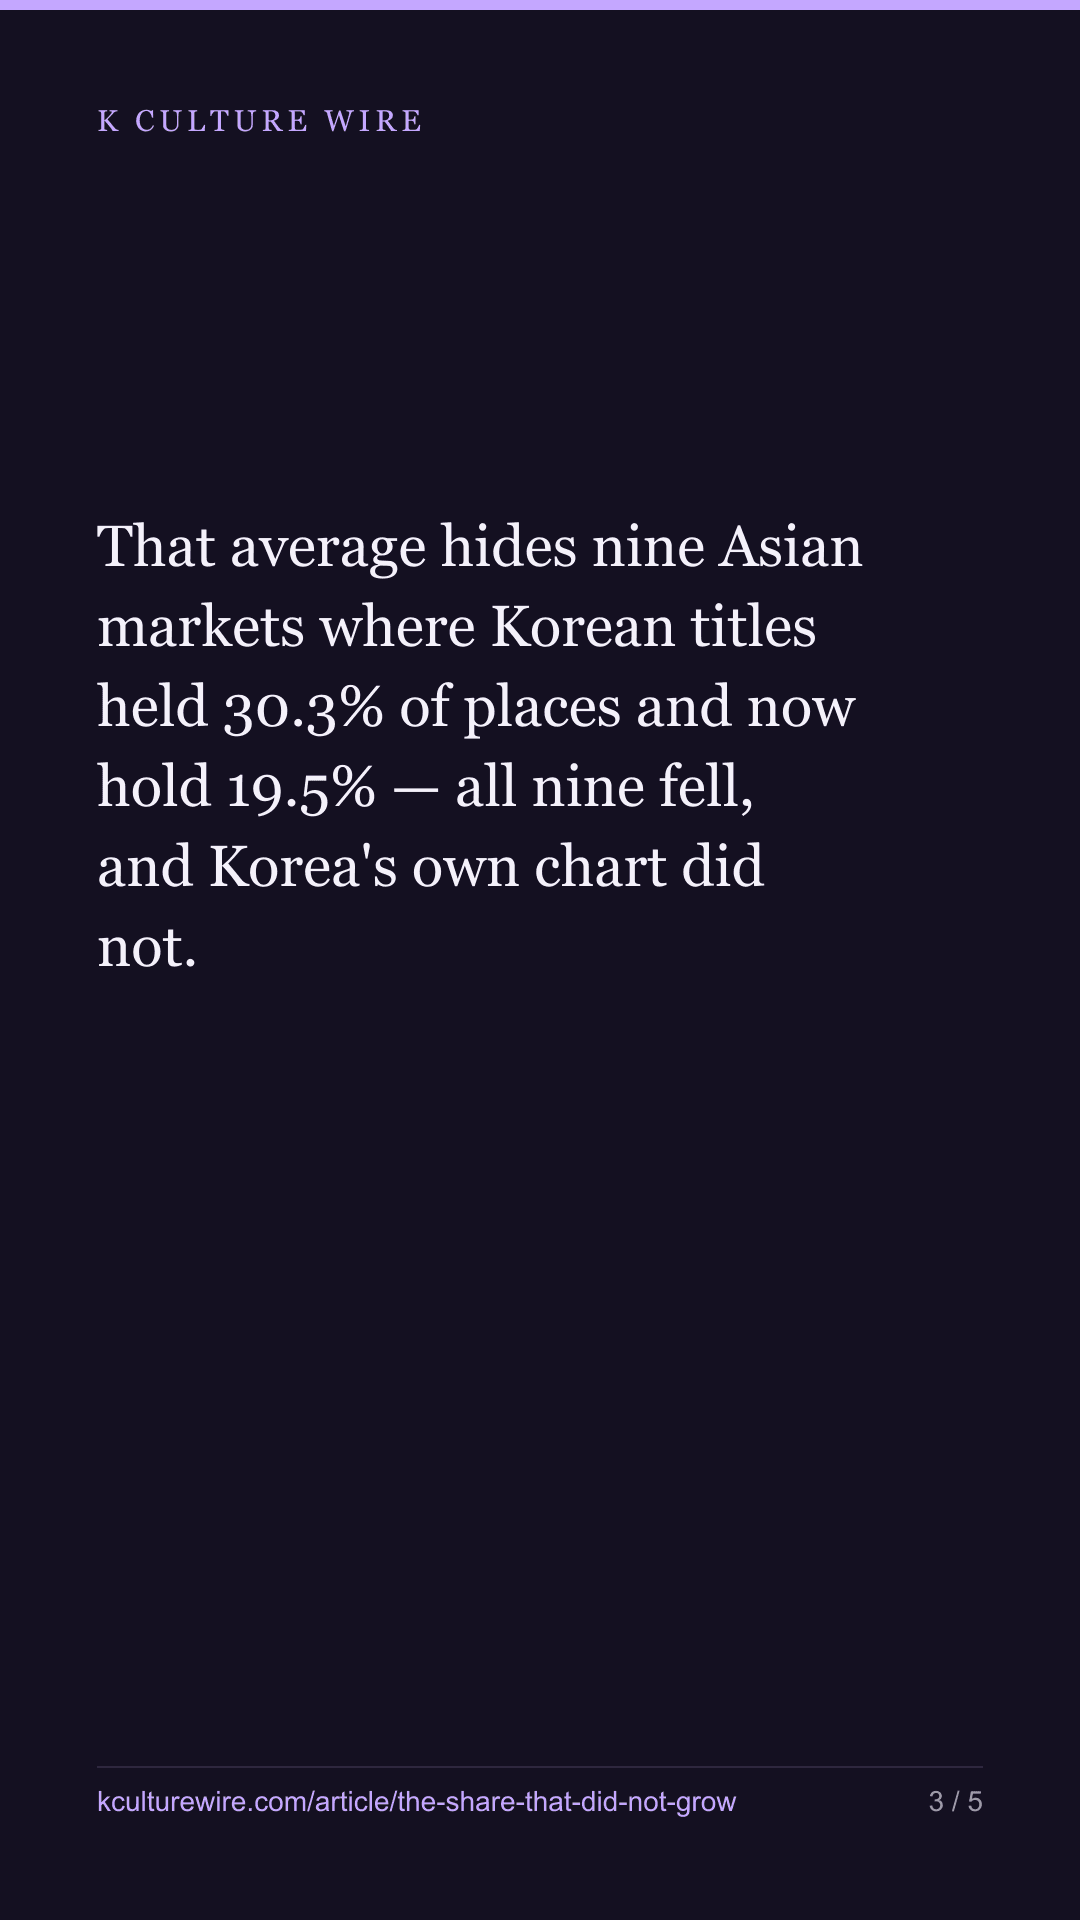
Across 93 countries and 265 weeks the global share has not moved since 2022. That average hides nine Asian markets where Korean titles held 30.3% of places and now hold 19.5% — all nine fell, and Korea's own chart did not.
The table this is written from: /world-share
Netflix publishes twenty places per country per week — ten films, ten series. It is a fixed pie, and that makes it one of the few things about the Korean wave that can be counted rather than asserted.
We counted all of it: 93 countries with a complete record, 268 weeks, 498,480 places. Korean titles hold 39,139 of them — Korean titles hold 7.9% of the world’s top-10 places.
7.9% of the world, and half of Korea
| Korean share of top-10 places | |
|---|---|
| All 93 markets | 7.7% |
| The median country | 4.6% |
| South Korea itself | 49.7% in 2025 |
Korea’s own figure is the one that surprises people first. Even at home, in the market where every Korean release lands and where the audience needs no subtitles, fewer than half of Netflix’s top-10 places hold a Korean title.
Ten markets sit above 20%, and there is no mystery about which ones:
| Korean share | Markets | Which |
|---|---|---|
| 20% and above | 10 | South Korea, Vietnam, Indonesia, Malaysia, Taiwan, Thailand, Hong Kong, the Philippines, Singapore, Japan |
| 10–20% | 11 | Bangladesh, Qatar, Saudi Arabia, Peru, Bolivia, Nigeria and five more |
| 5–10% | 24 | |
| 3–5% | 17 | |
| 2–3% | 22 | |
| Under 2% | 9 | Latvia, Norway, Estonia, Ukraine, the United Kingdom, Denmark, Ireland, the United States, Iceland |
Every market in the top band is in East or Southeast Asia. The bottom band is northern Europe and the English-speaking world.
The global share has not moved
| Year | Weeks | Korean share |
|---|---|---|
| 2022 | 52 | 7.5% |
| 2023 | 53 | 8.2% |
| 2024 | 52 | 6.9% |
| 2025 | 52 | 8.2% |
Four complete years, and the share ends where it started. If the Korean wave has been growing since 2022, it has not been growing into these places.
That flat line is also the least interesting thing on this page, because it is an average of 93 countries and it hides the only movement in the data.
What the average hides
| Group | 2022 | 2023 | 2024 | 2025 |
|---|---|---|---|---|
| South Korea | 51.2% | 58.3% | 52.0% | 53.3% |
| The nine Asian markets that were once above 20% | 30.5% | 26.9% | 19.9% | 20.8% |
| The five largest English-speaking markets | 1.9% | 1.4% | 2.0% | 2.0% |
The nine markets where Korean titles were strongest gave up 9.7 points in four years — better than a third of the share they held. The English-speaking markets did not pick it up; they are where they were. The global average stayed flat because nine countries falling is a small thing inside an average of 93.
All nine fell. That is the finding, not the order.
| Market | 2022 | 2025 | Change |
|---|---|---|---|
| Vietnam | 34.4% | 25.8% | −8.6 |
| Indonesia | 34.3% | 26.7% | −7.6 |
| Malaysia | 31.4% | 21.5% | −9.9 |
| Taiwan | 27.1% | 21.3% | −5.8 |
| Thailand | 30.8% | 20.3% | −10.5 |
| Hong Kong | 27.9% | 19.4% | −8.5 |
| Philippines | 27.9% | 20.6% | −7.3 |
| Singapore | 27.8% | 19.2% | −8.6 |
| Japan | 32.8% | 11.9% | −20.9 |
We are not putting these in an order of merit and the ranking is not the point. The point is that there is no exception. One market falling is a market. Nine out of nine falling, across a range of languages, incomes and neighbouring content industries, is the same thing happening to all of them.
Fewer titles, not shorter runs
A share can fall two ways: the same titles hold fewer places each, or fewer titles get in at all. These are different problems and the data separates them cleanly.
| Year | Korean share | Korean titles charting | Places per Korean title | All titles charting |
|---|---|---|---|---|
| 2022 | 30.5% | 165 | 17.3 | 1,127 |
| 2023 | 26.9% | 145 | 17.7 | 1,158 |
| 2024 | 19.9% | 102 | 18.3 | 1,248 |
| 2025 | 20.8% | 110 | 17.7 | 1,247 |
The number of distinct Korean titles reaching these charts fell from 165 to 110. What each one did once it arrived barely changed — 17.3 places to 17.7. A Korean title that charts in these markets performs as well as it did in 2022. There are simply far fewer of them.
Meanwhile the total number of distinct titles charting rose from 1,127 to 1,247. The lists got busier and Korean titles took a smaller part of them.
The control: Korea’s own chart
There is an obvious way this whole page could be wrong. We identify Korean titles through Wikidata, and Wikidata records a new title later than Netflix charts it. If our recognition were quietly decaying, recent years would look emptier of Korean content whether or not anything had changed.
Korea’s own chart tests that, because it is measured with exactly the same identification:
| 2022 | 2023 | 2024 | 2025 | |
|---|---|---|---|---|
| South Korea | 49.8% | 54.3% | 51.2% | 49.7% |
It does not sag. A ruler that was losing recent Korean titles would shorten here first and hardest, because this is the chart most densely packed with them. It ends within a tenth of a point of where it started while the nine markets lost more than ten points, so whatever moved was not the ruler.
The peaks are one title
| Week | Korean share | Korean places | Largest single title |
|---|---|---|---|
| 2025-07-06 | 16.1% | 300 | Squid Game — 240 places, 80.0% |
| 2025-01-05 | 15.2% | 283 | Squid Game — 186, 65.7% |
| 2024-12-29 | 15.2% | 282 | Squid Game — 186, 66.0% |
| 2024-11-10 | 2.0% | 37 | A Virtuous Business — 8, 21.6% |
The last row is the lowest week in the record. Across 93 countries and 1,860 published places that week, Korean titles held 37.
The highest week in five years is four-fifths one show. That is worth holding next to the paragraph above about title counts: the thing that moves the global figure is not a rising tide of Korean content, it is whether one enormous title happens to be out.
What we are not saying
We are not saying Korean content is in decline as an industry. Our own pages show content exports growing 63% in two years over a period when top-of-chart viewing did not move, and this is another measurement of the same disagreement rather than a verdict about it.
We are also not offering a cause. Netflix’s own commissioning, the growth of local production in Thailand and Indonesia, and the simple fact that more titles now compete for the same twenty places are all plausible, and this data separates none of them. What it does say is narrower and firmer: in the markets where Korean titles held the most ground, they hold a third less of it than they did in 2022, and that is true in every one of those markets.
What changed on 3 September 2026
We recounted from the current files. The record is now 268 weeks rather than 265, so the totals grew: 498,480 top-10 places across 93 countries, of which Korean titles hold 39,139. Every share in the tables was rebuilt from the data rather than edited by hand.
The finding did not change. The global share has not moved since 2022, and the nine Asian markets that were once above 20% have all fallen while Korea’s own chart has not.
Where these numbers come from
Sources
- Netflix — Tudum weekly Top 10 country lists for every country Netflix publishes — 93 markets with a complete record, 268 weeks from 2021-07-04 to 2026-08-16 · https://www.netflix.com/tudum/top10
- Wikidata — Country of origin (P495 = Q884) to identify Korean titles, with titles Netflix classes on its English-language global charts excluded · https://query.wikidata.org
What we checked
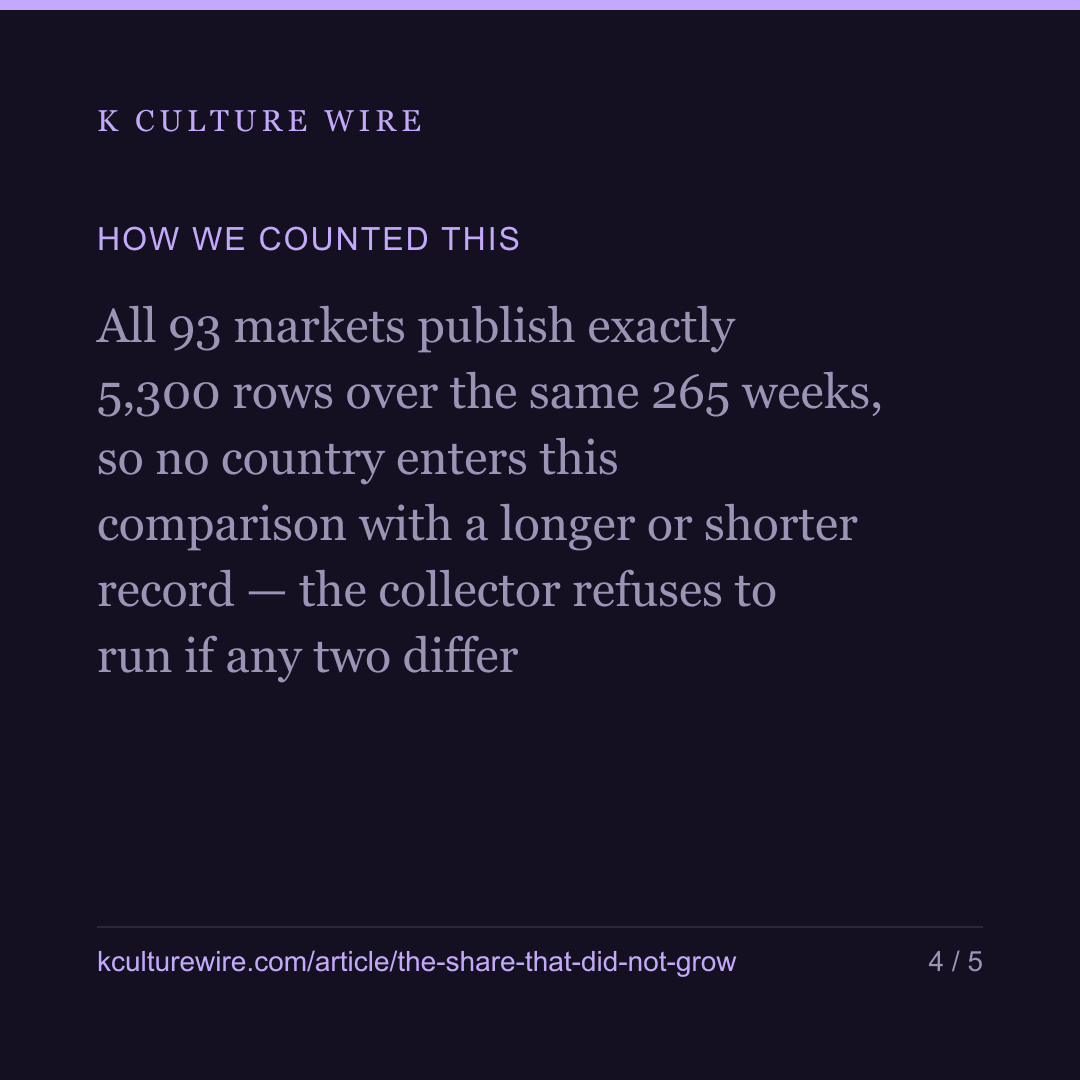
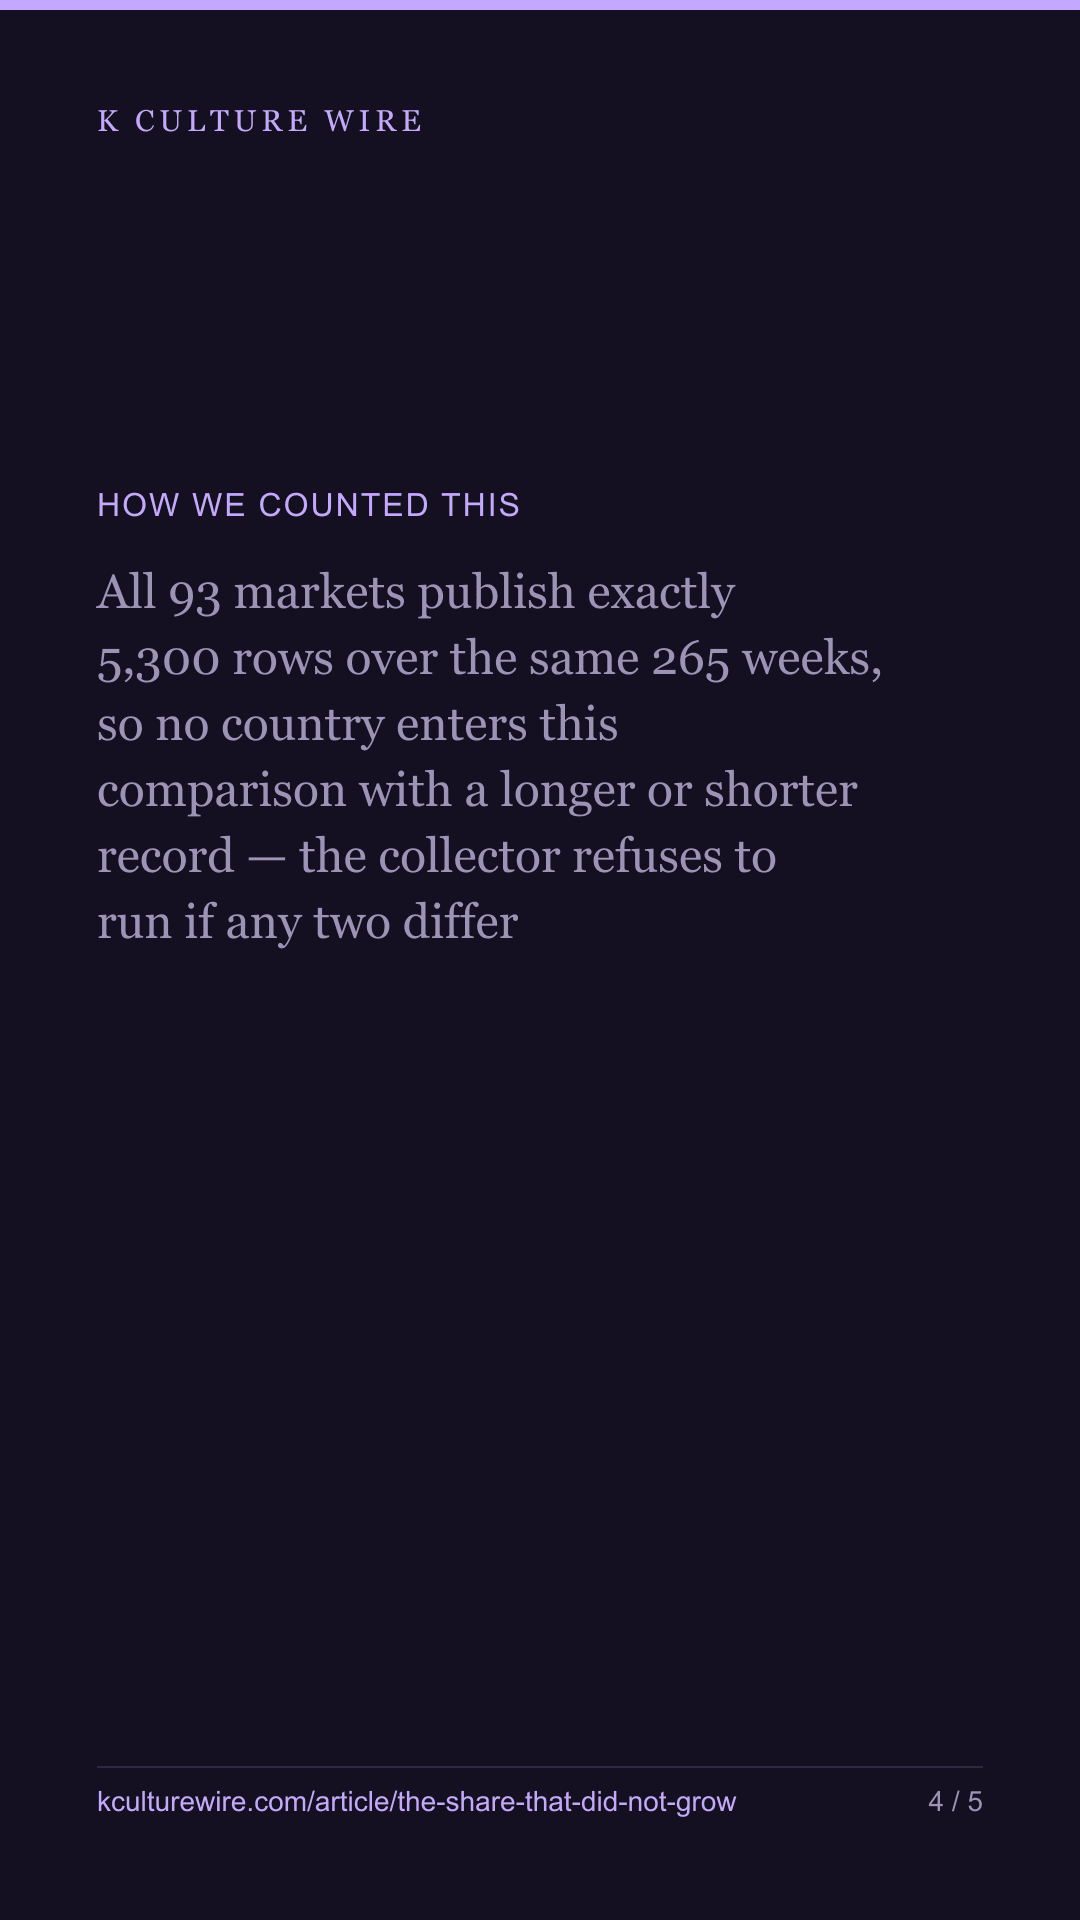
- All 93 markets publish exactly 5,300 rows over the same 265 weeks, so no country enters this comparison with a longer or shorter record — the collector refuses to run if any two differ
- Only complete calendar years (2022 to 2025) are used for anything described as a trend; 2021 has 26 weeks of data and 2026 has 30, and both are reported separately rather than blended in
- Korea's own chart is measured with the same identification as every other market and acts as the control: if our ability to recognise Korean titles were decaying over time, that share would sag too
What we left out, and why
- Russia, whose list Netflix stopped publishing in February 2022 after 700 rows. Including it would make the earliest year move for a reason that has nothing to do with Korean titles
- Viewing. Country lists carry a rank and no hours figure, so nothing here says how much anything was watched — only how many of the published places a Korean title occupied
- Any cause for the decline. We can say what fell, in which markets, and whether it was fewer titles or shorter runs. We cannot say why, and we have not gone looking for a story to fit
- Countries where Netflix publishes no list at all, which includes most of Africa and central Asia. Nothing here describes them
The data behind this
Written from the same data
Take this away — 10 cards
The figures in this article, as images. Free to repost with the address on them.
If you work in this business
Everything on this page is measured from the same weekly Netflix lists, per market and per title. We publish the pages free; what we sell is the same measurement cut to one company's catalogue — including the figures behind /world-share.
What a company sheet contains, and what it cannot tell you →