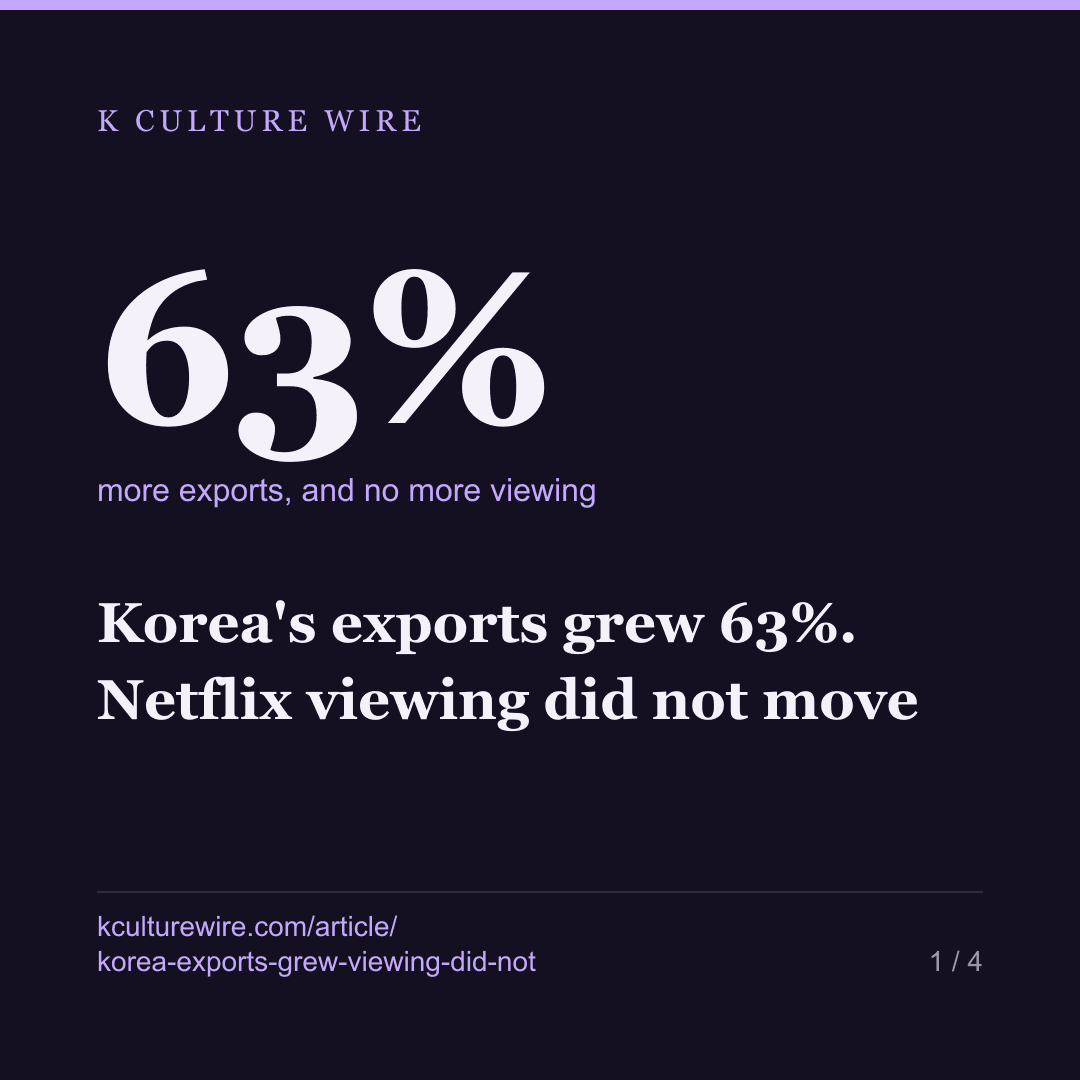
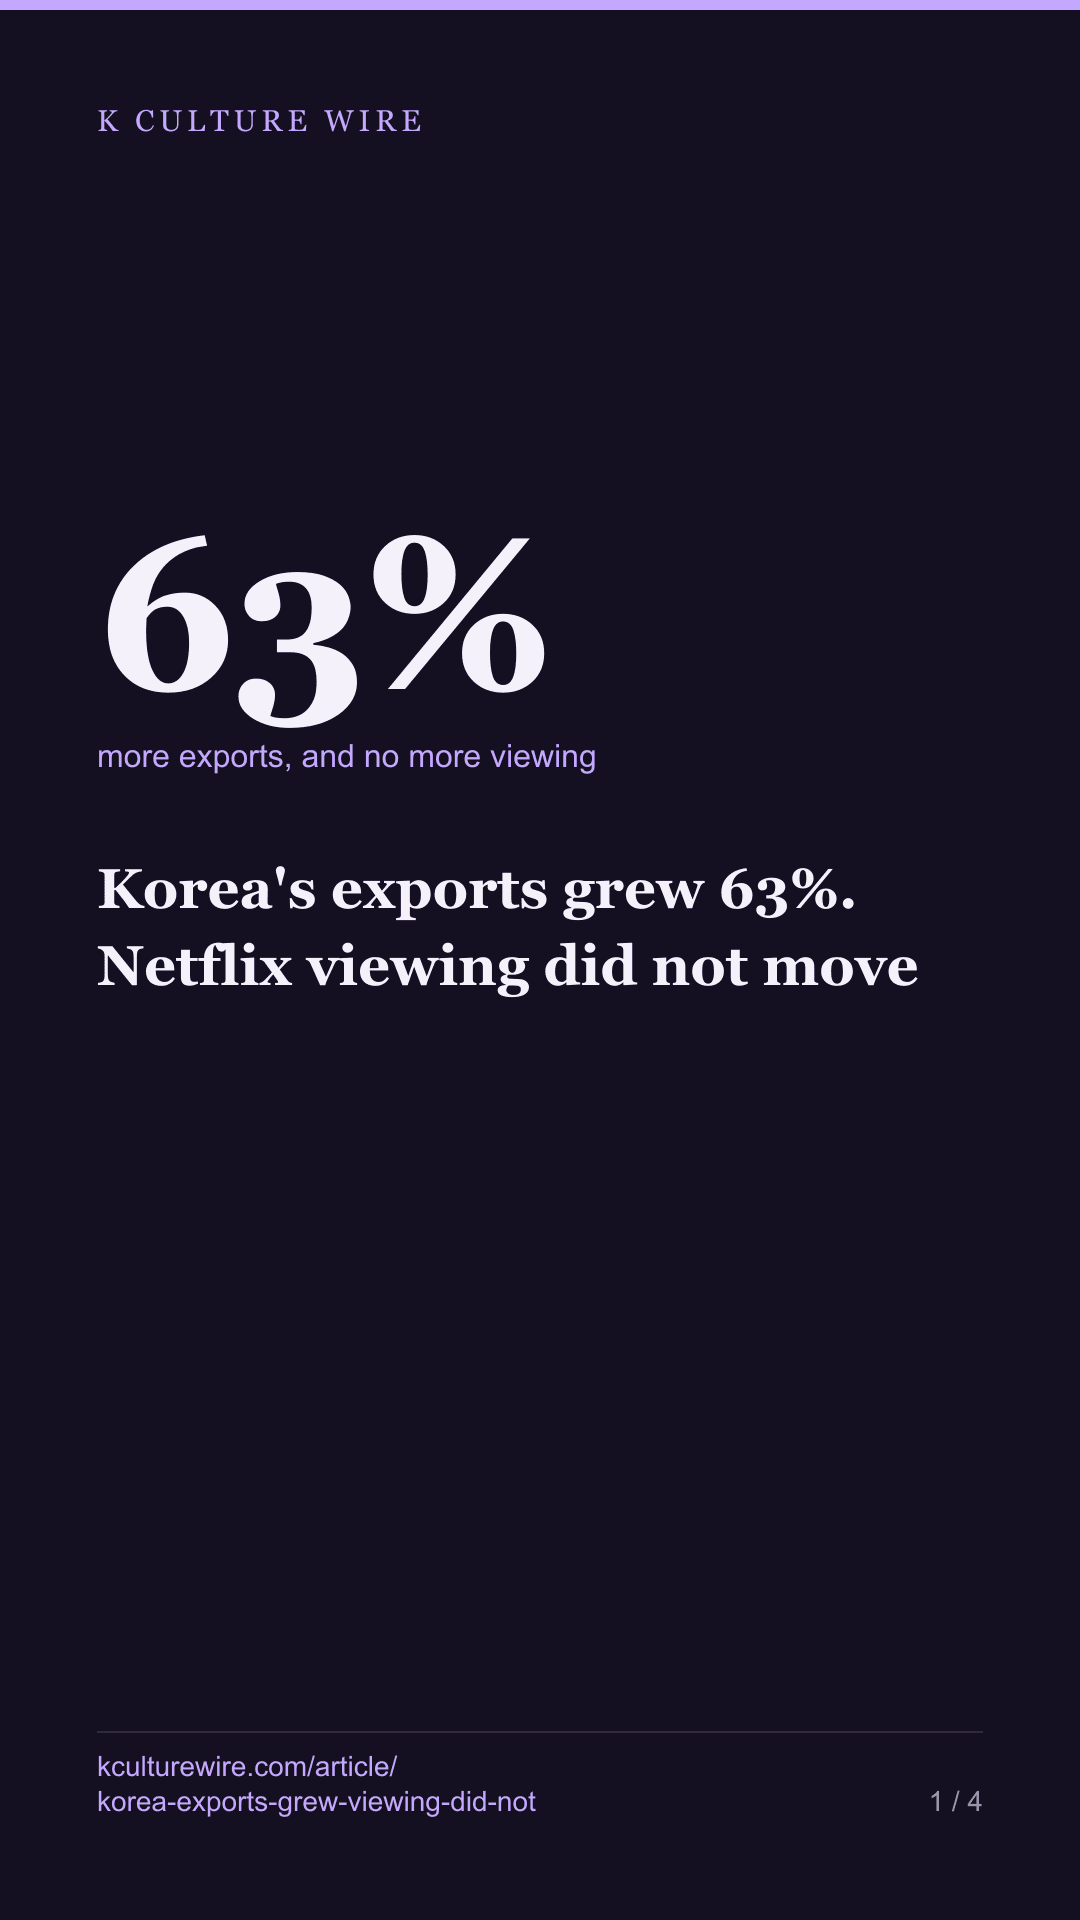
Korea's exports grew 63%. Netflix viewing did not move
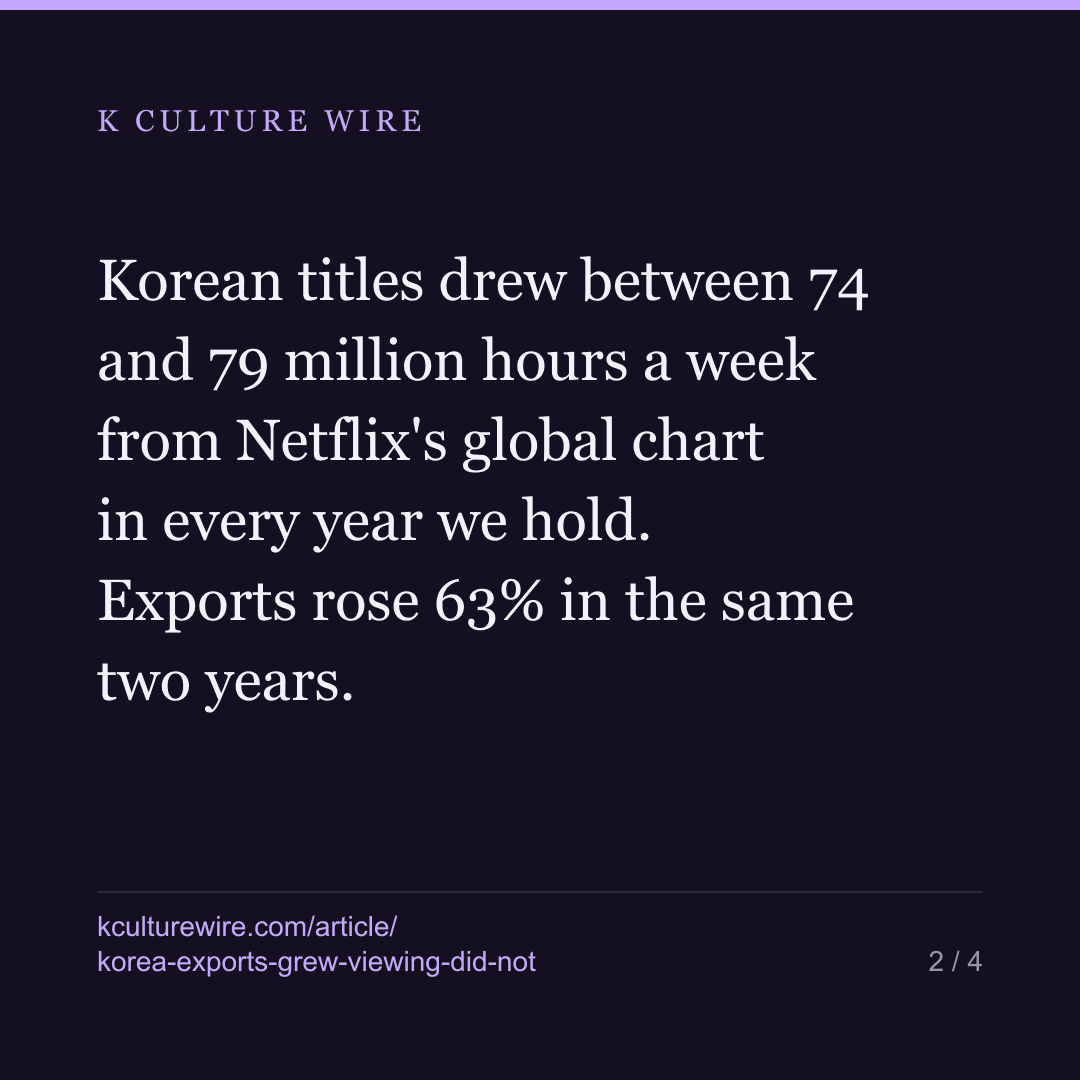
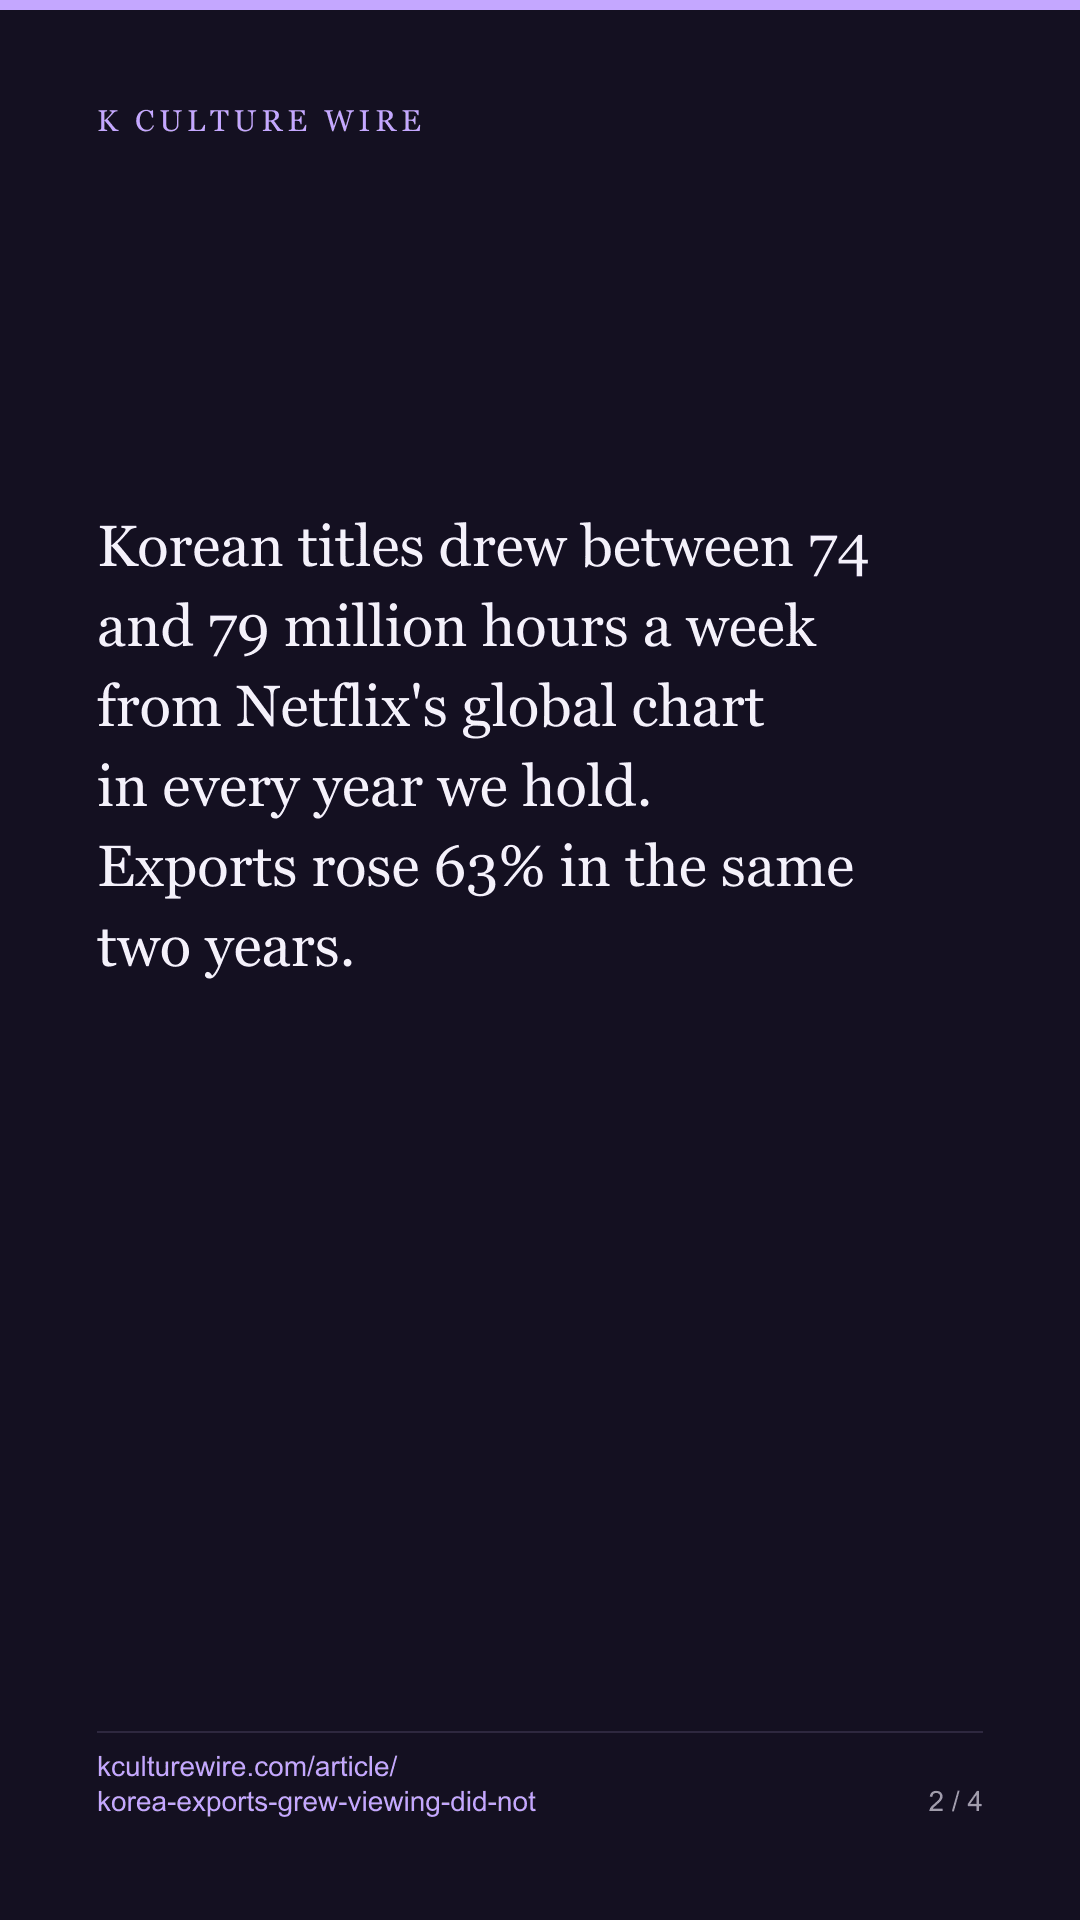
Korean titles drew between 74 and 79 million hours a week from Netflix's global chart in every year we hold. Exports rose 63% in the same two years.
The table this is written from: /watched
Two Korean datasets cover the same years from opposite ends. One counts what the world watched. The other counts what Korean companies sold. Between 2022 and 2024 they point in different directions, and the gap is large enough to be worth stating carefully.
What the world watched
Netflix has published a global Top 10 every week since July 2021. Dividing each year’s Korean hours by the number of weeks in it — so a part-year is not compared against a full one — gives this:
| Year | Weeks | Korean hours per week | Same, with every Squid Game season removed |
|---|---|---|---|
| 2021 | 26 | 126.9m | 41.2m |
| 2022 | 52 | 75.4m | 74.2m |
| 2023 | 53 | 76.6m | 76.1m |
| 2024 | 52 | 76.5m | 65.6m |
| 2025 | 52 | 117.3m | 75.7m |
| 2026 | 30 | 79.1m | 79.1m |
The two years that stand out are 2021 and 2025. Both carried a Squid Game release. Take the show out of every year and the series reads 74.2, 76.1, 65.6, 75.7, 79.1 — a spread of 21% from top to bottom, with no direction to it.
Korean viewing at the top of Netflix’s global chart has not grown since 2022. One programme accounts for the years that look like growth.
What Korean companies sold
Over the same period, the government’s content industry survey records this:
| Year | Music exports | Broadcast programme exports | Together |
|---|---|---|---|
| 2022 | $927.6m | $948.0m | $1,875.7m |
| 2023 | $1,222.5m | $1,047.2m | $2,269.8m |
| 2024 | $1,801.4m | $1,257.2m | $3,058.6m |
That is +63.1% in two years. Broadcast programmes on their own — the closer comparison, since music does not travel through Netflix — rose 32.6%.
The two do not have to agree, and it is worth saying why
Export revenue counts what Korean companies were paid. Chart hours count what people watched at the very top of one service. Several ordinary things pull them apart:
- A licence is paid once; viewing arrives later, or elsewhere. A drama sold in 2024 may be watched in 2025, on a service that publishes nothing.
- The chart has a ceiling. Ten rows a week, worldwide. If Korean titles already hold a steady share of those ten, more Korean supply does not raise the count — it redistributes it.
- Music is most of the export growth and none of the viewing. Music exports rose 94% over the two years; they do not appear in a video chart at all.
- Prices can rise without volume. Both series are nominal dollars, and a streaming licence renegotiated upward looks identical to selling more.
The limit that matters most
Netflix publishes ten rows a week and nothing beneath them. A Korean title watched heavily but never in the top ten does not exist in this data. If Korean viewing is growing below the chart line — which is exactly what a broader, less hit-driven catalogue would look like — none of the numbers above would move.
So the honest statement is narrower than the headline anyone would want: Korean presence at the very top of the global chart has been flat for four years, while Korean content export revenue has not been. Whether that is a plateau in demand or a change in where demand shows up, this data cannot say — and neither can anyone else’s, because nobody publishes the part that would settle it.
Exports grew; so did another category, at almost exactly the same rate and for unrelated reasons. Read music and broadcast, side by side for thirteen years →
Where these numbers come from
Sources
- Netflix — Top 10 weekly global hours viewed (Tudum), Non-English charts, 265 consecutive weeks from 2021-07-04 to 2026-07-26 · https://www.netflix.com/tudum/top10
- Korea Creative Content Agency (한국콘텐츠진흥원) — Content Industry Survey (콘텐츠산업조사) — music industry exports (KOSIS DT_113_STBL_1020468) and broadcast programme exports (DT_113_STBL_1025706), via KOSIS open API · https://kosis.kr
- Wikidata — Country of origin (P495 = Q884) used to identify Korean titles in the weekly lists · https://www.wikidata.org
What we checked
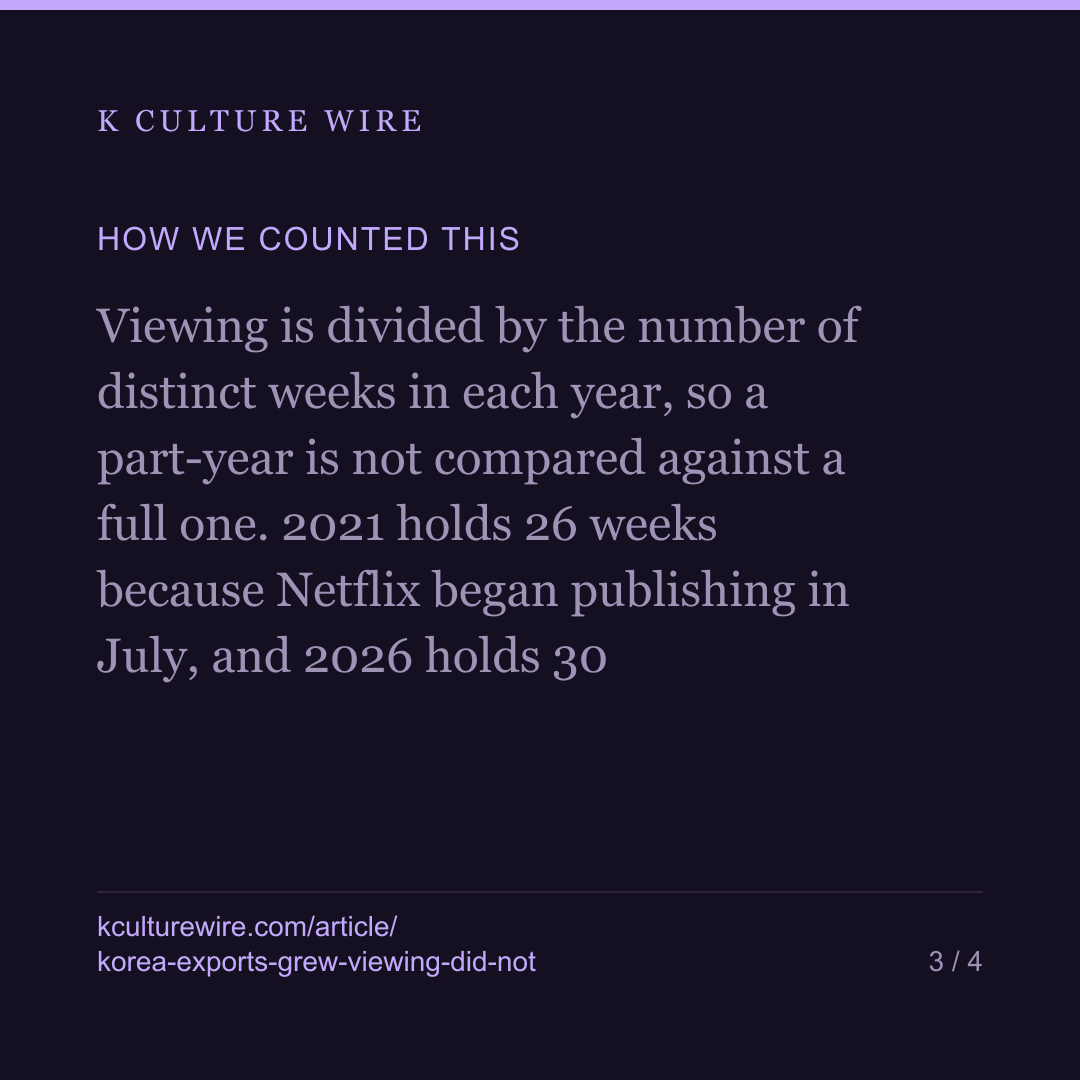
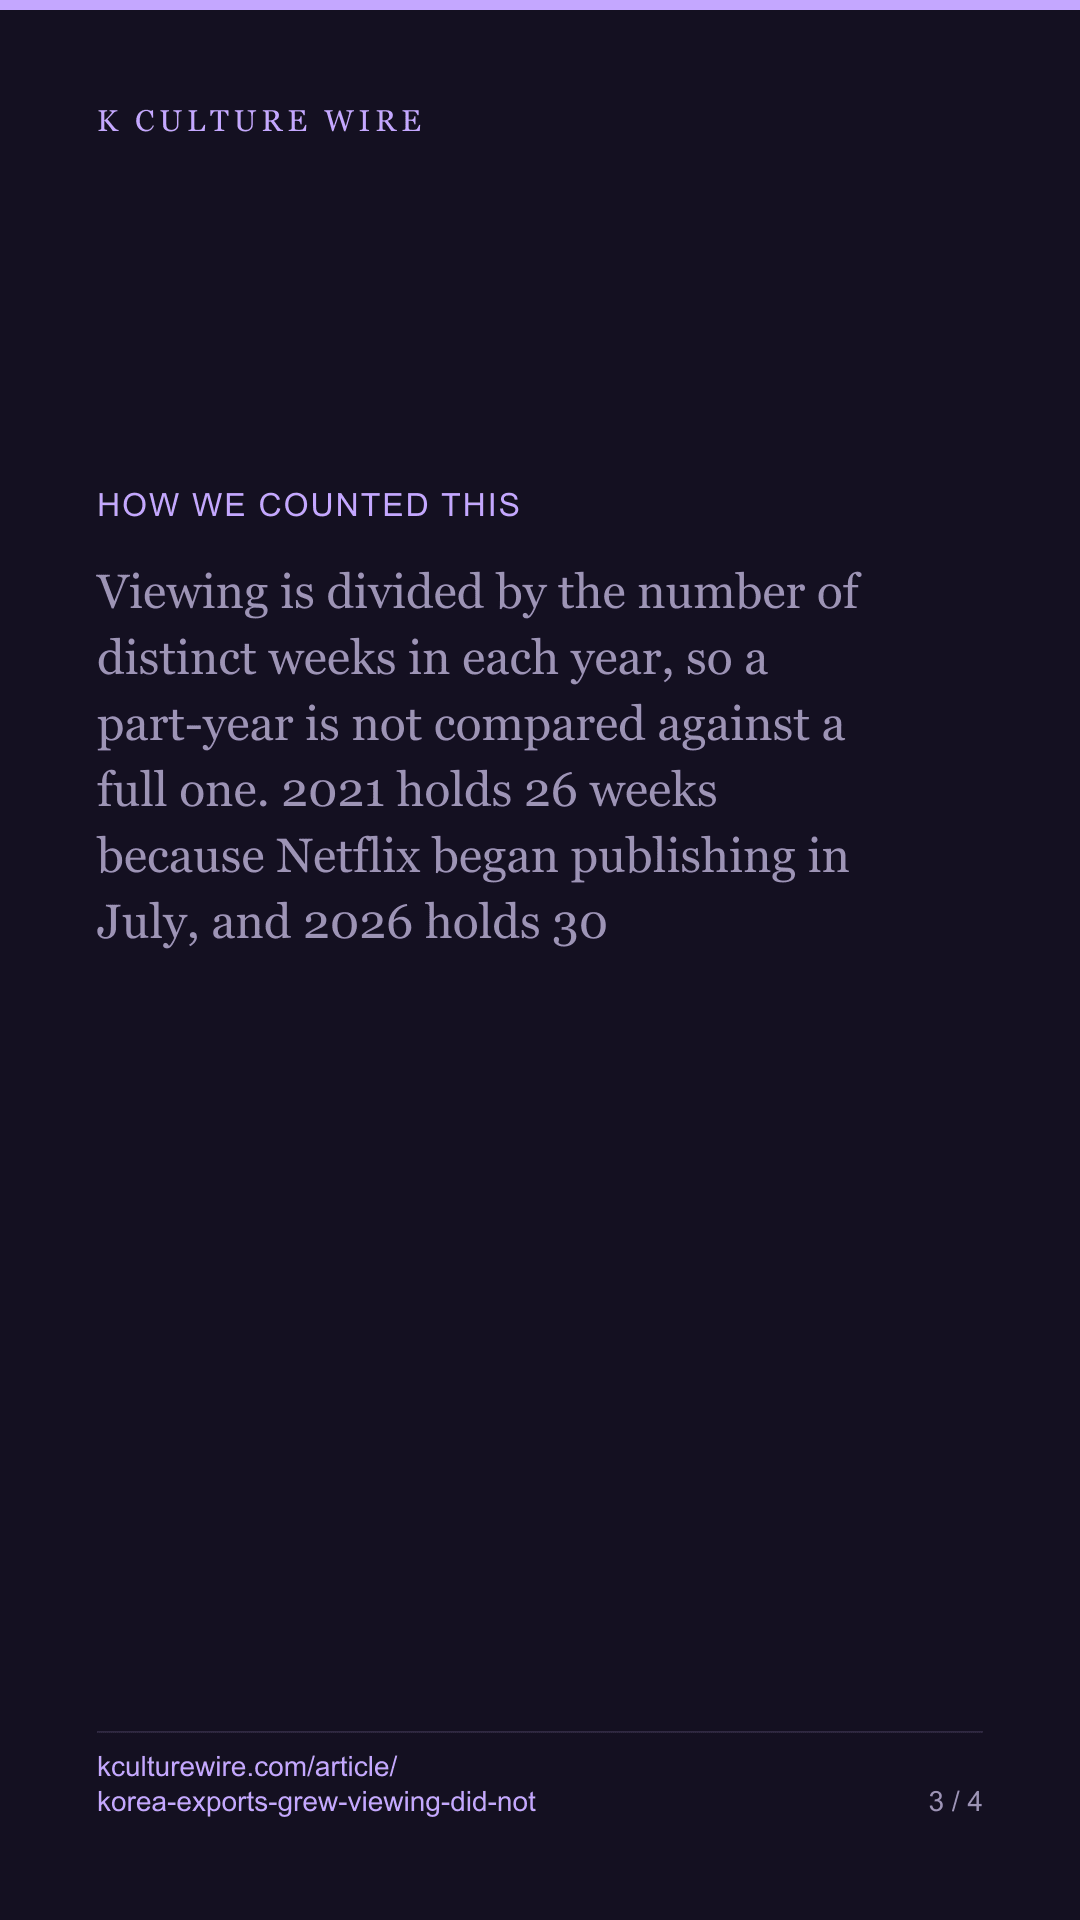
- Viewing is divided by the number of distinct weeks in each year, so a part-year is not compared against a full one. 2021 holds 26 weeks because Netflix began publishing in July, and 2026 holds 30
- Weekly hours are 75.4m in 2022, 76.6m in 2023, 76.5m in 2024 and 79.1m across the 30 weeks of 2026. 2025 is 117.3m and 2021 is 126.9m — the two years carrying a Squid Game release
- Removing every Squid Game season from all years gives 74.2m, 76.1m, 65.6m, 75.7m and 79.1m per week for 2022 to 2026. The spread between highest and lowest is 21%, and there is no trend in either direction
- Exports are read as published in thousands of US dollars: music plus broadcast is $1,875.7m in 2022, $2,269.8m in 2023 and $3,058.6m in 2024, a rise of 63.1%. Broadcast programmes alone rose 32.6% over the same two years
- The two sides are unrelated bodies — a streaming company's own chart and a government industry survey — and neither is derived from the other
What we left out, and why
- Anything below each week's top ten. Netflix publishes ten rows and nothing under them, so a Korean title watched steadily by a large audience that never breaks in is invisible here. Viewing could be growing below the chart and this data would not show it. That is the single largest limit on the comparison and we are not going to bury it
- Netflix's own revenue, licence fees or what it paid for anything. Netflix publishes hours viewed and no money at all
- Any claim that one side causes or contradicts the other. Export revenue counts what Korean companies sold; chart hours count what the world watched at the very top of one service. They can move apart for many reasons that neither dataset records
- Inflation and exchange rates. Both export series are nominal US dollars as published
- 2025 and 2026 export figures, which the survey has not published. The export comparison ends at 2024
- Certainty that every title counted is Korean. Identification is title text against Wikidata; 79.8% of the viewing sits on titles only Korean works carry, 17.0% on titles a foreign work shares a name with, and 3.2% on titles Wikidata gives no country for
The data behind this
Written from the same data
Take this away — 8 cards
The figures in this article, as images. Free to repost with the address on them.
If you work in this business
Everything on this page is measured from the same weekly Netflix lists, per market and per title. We publish the pages free; what we sell is the same measurement cut to one company's catalogue — including the figures behind /watched and /exports and /tv-exports.
What a company sheet contains, and what it cannot tell you →