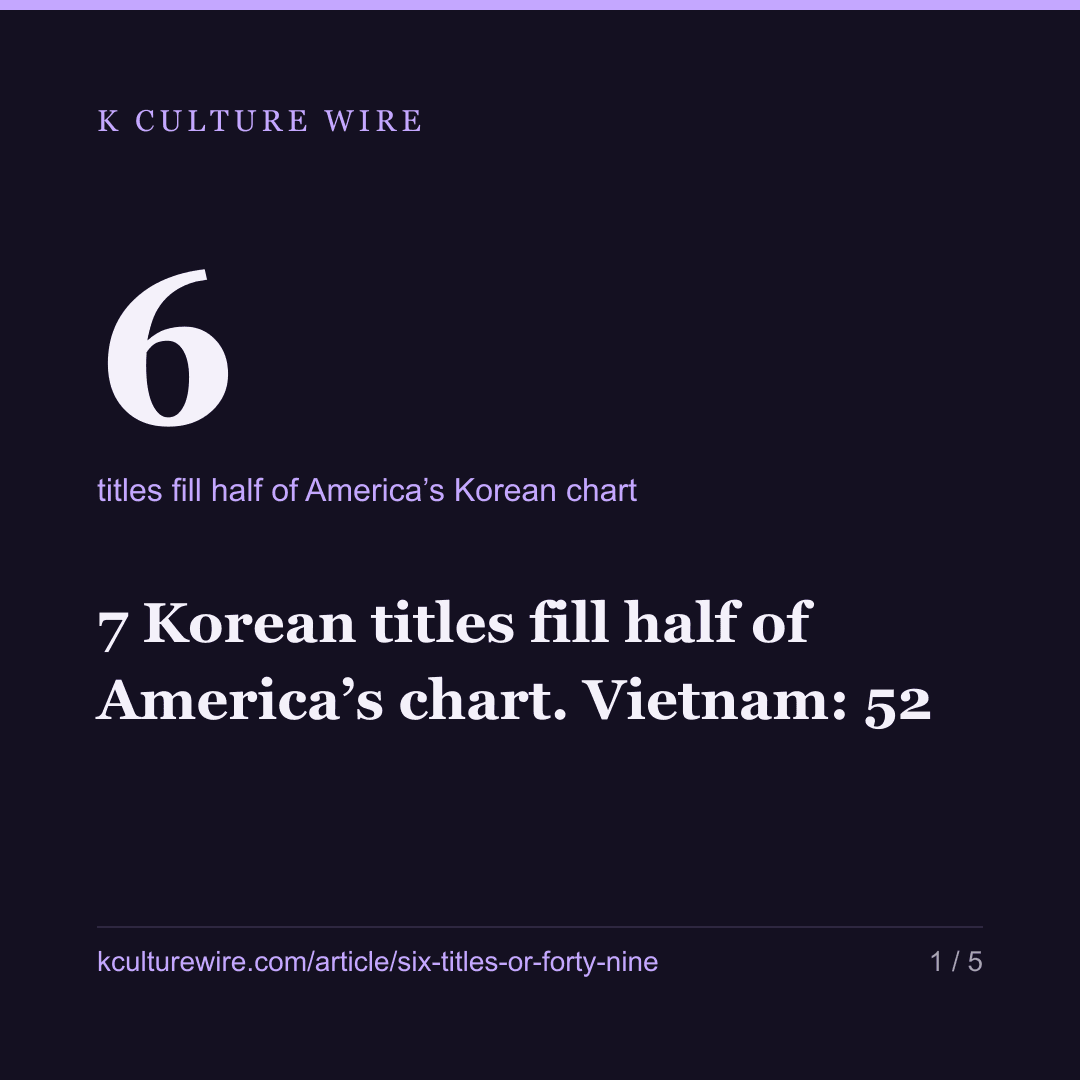
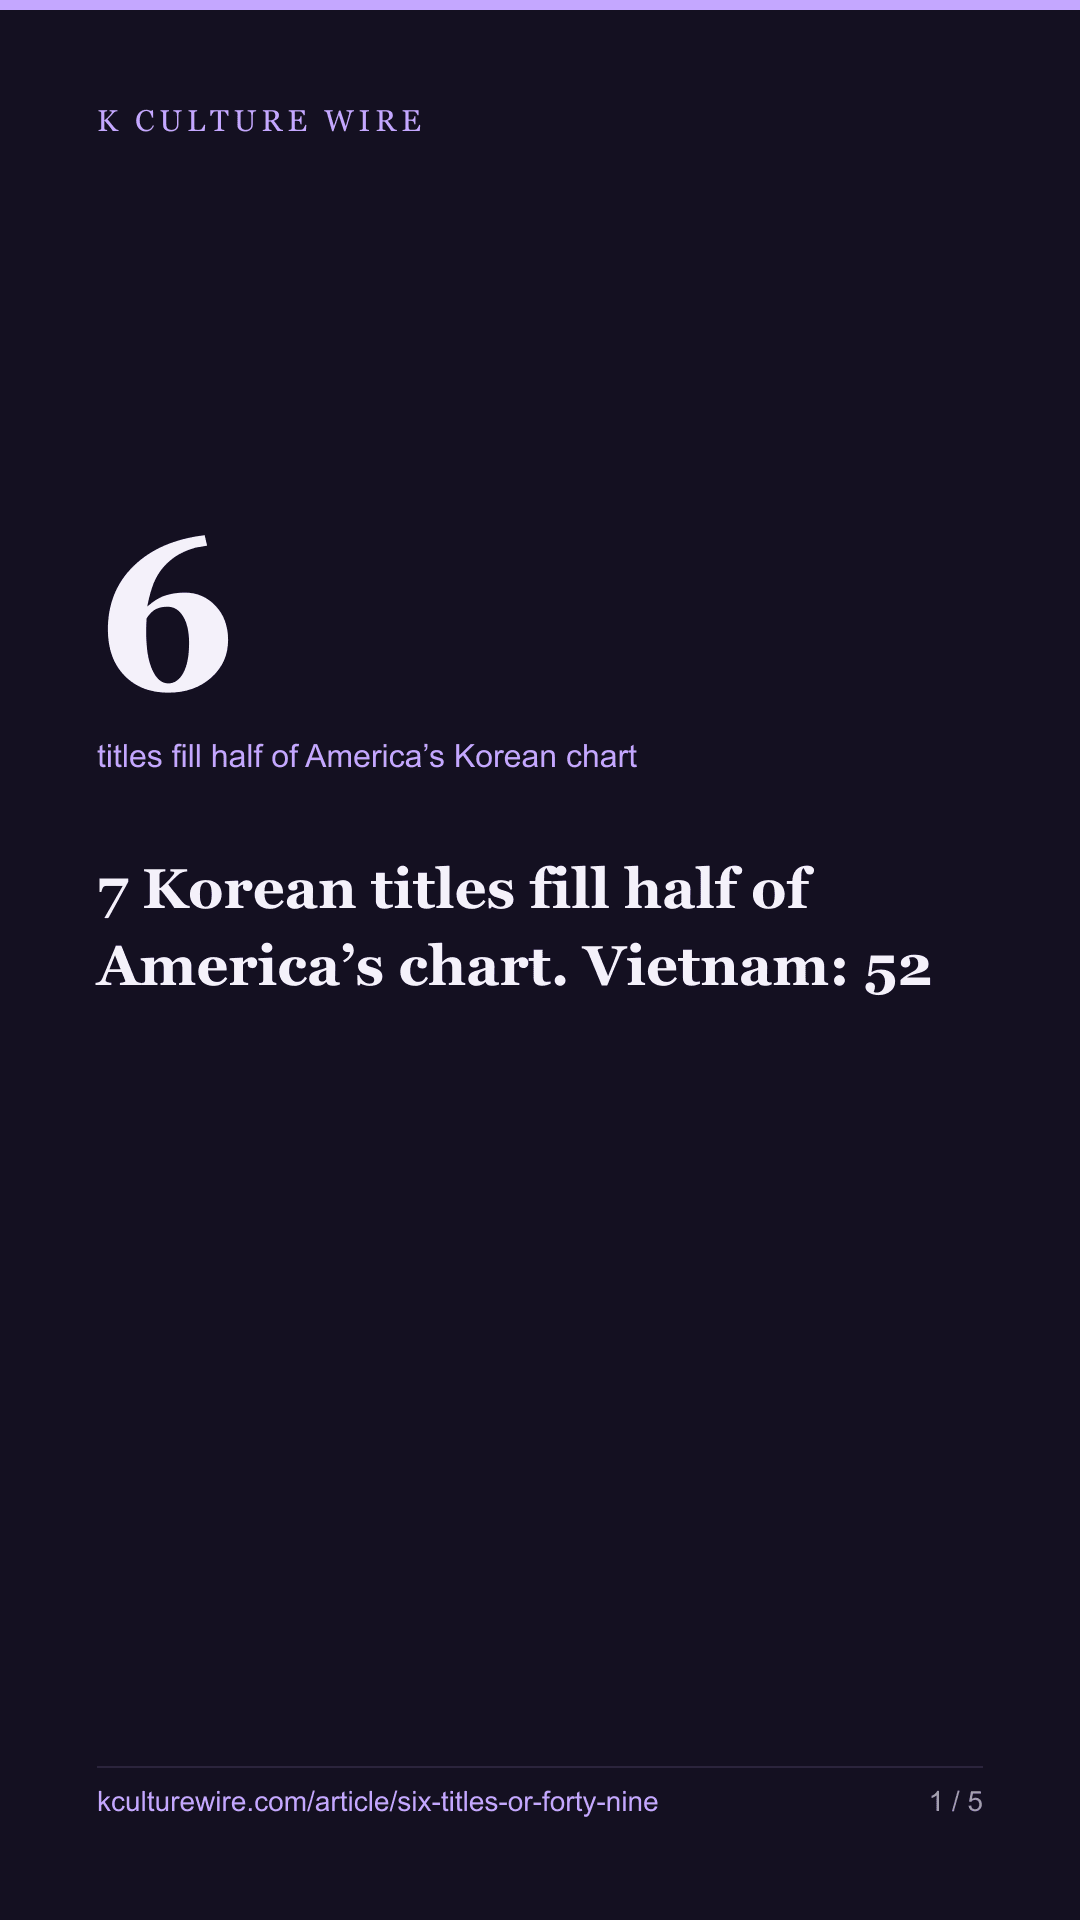
7 Korean titles fill half of America’s chart. Vietnam: 52
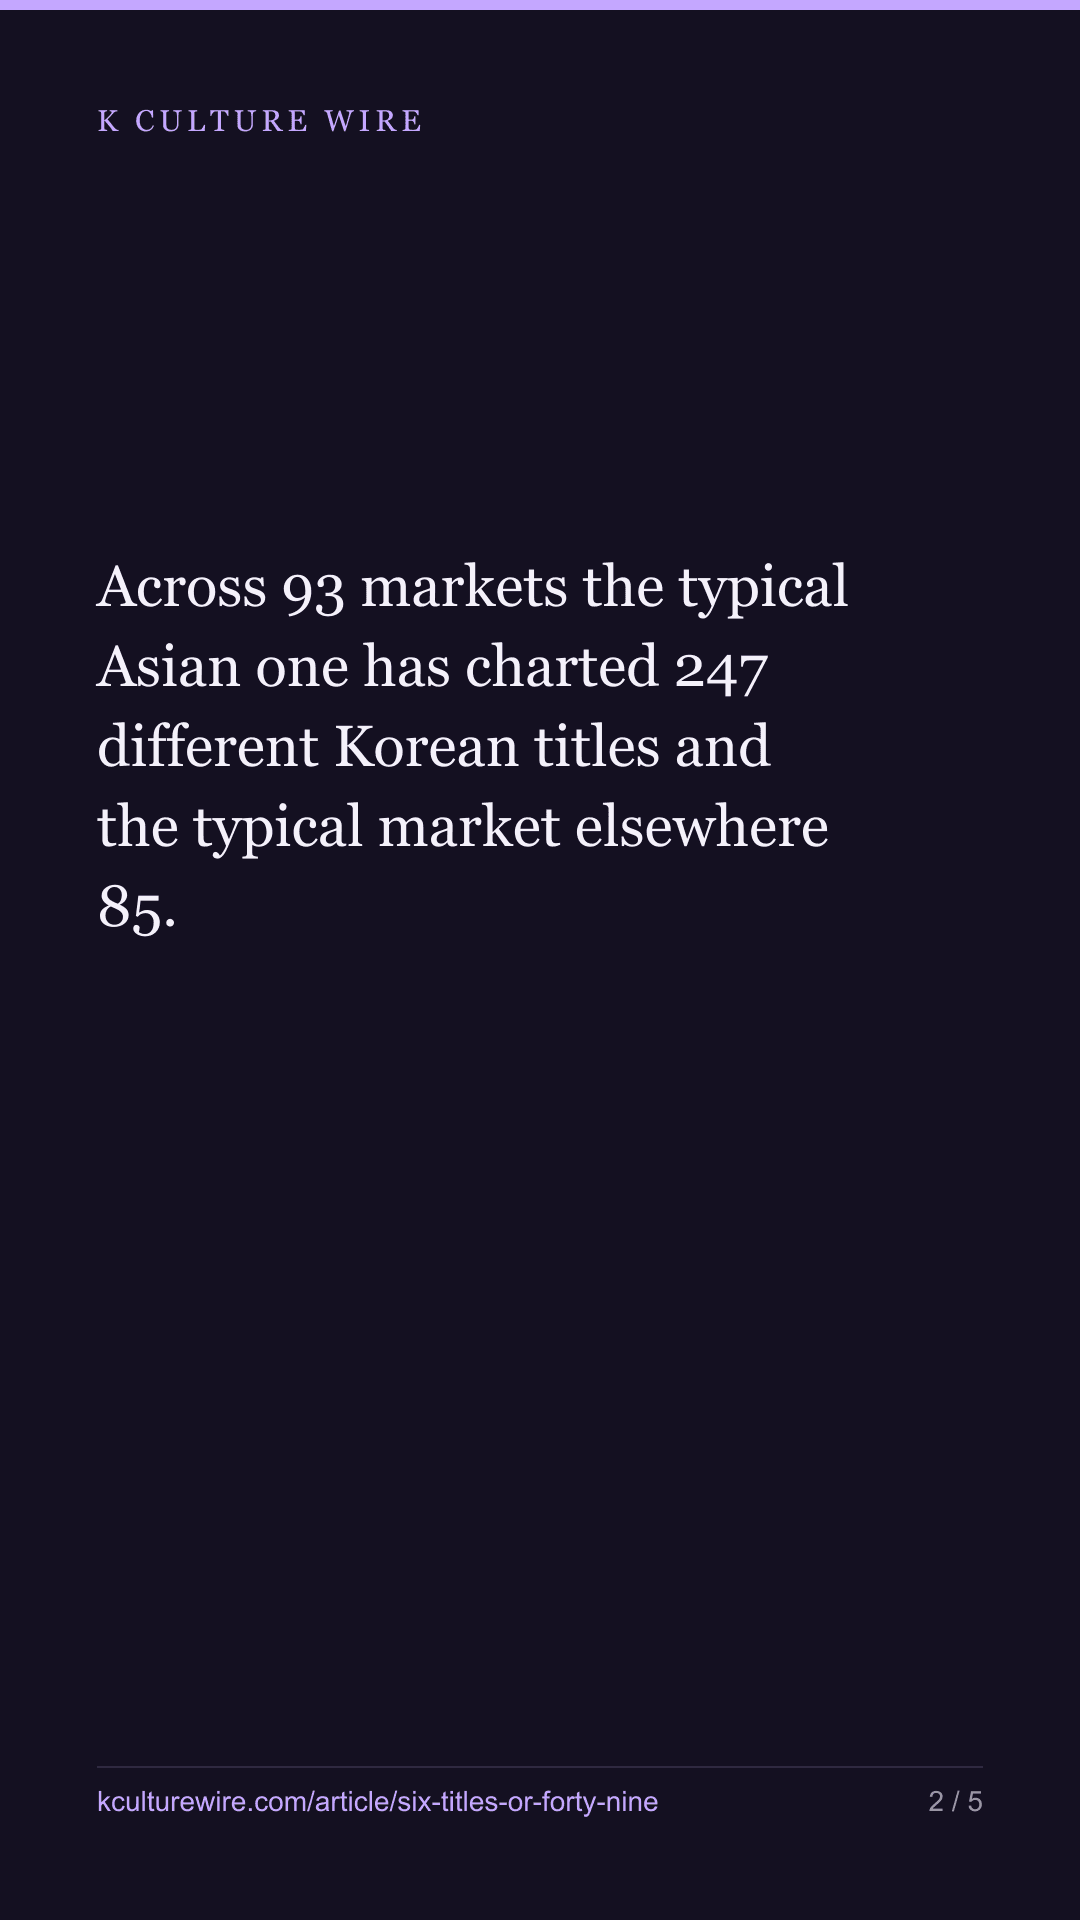
Across 93 markets the typical Asian one has charted 247 different Korean titles and the typical market elsewhere 85. Matching markets by how many Korean places they hold removes a third of that gap. Two-thirds of it survives.
The table this is written from: /catalogue-depth
Our world-share page counts what fraction of Netflix’s published top-10 places hold a Korean title. That number hides something: the same 5% can be twenty titles taking turns or one title sitting there all year, and those are different things to be a viewer of.
Seven Korean titles fill half of America’s Korean chart places. In Vietnam it takes 52.
So we counted the other thing. Across 93 markets and 265 weeks, how many different Korean titles has each one actually seen, and how few of them carry half of it?
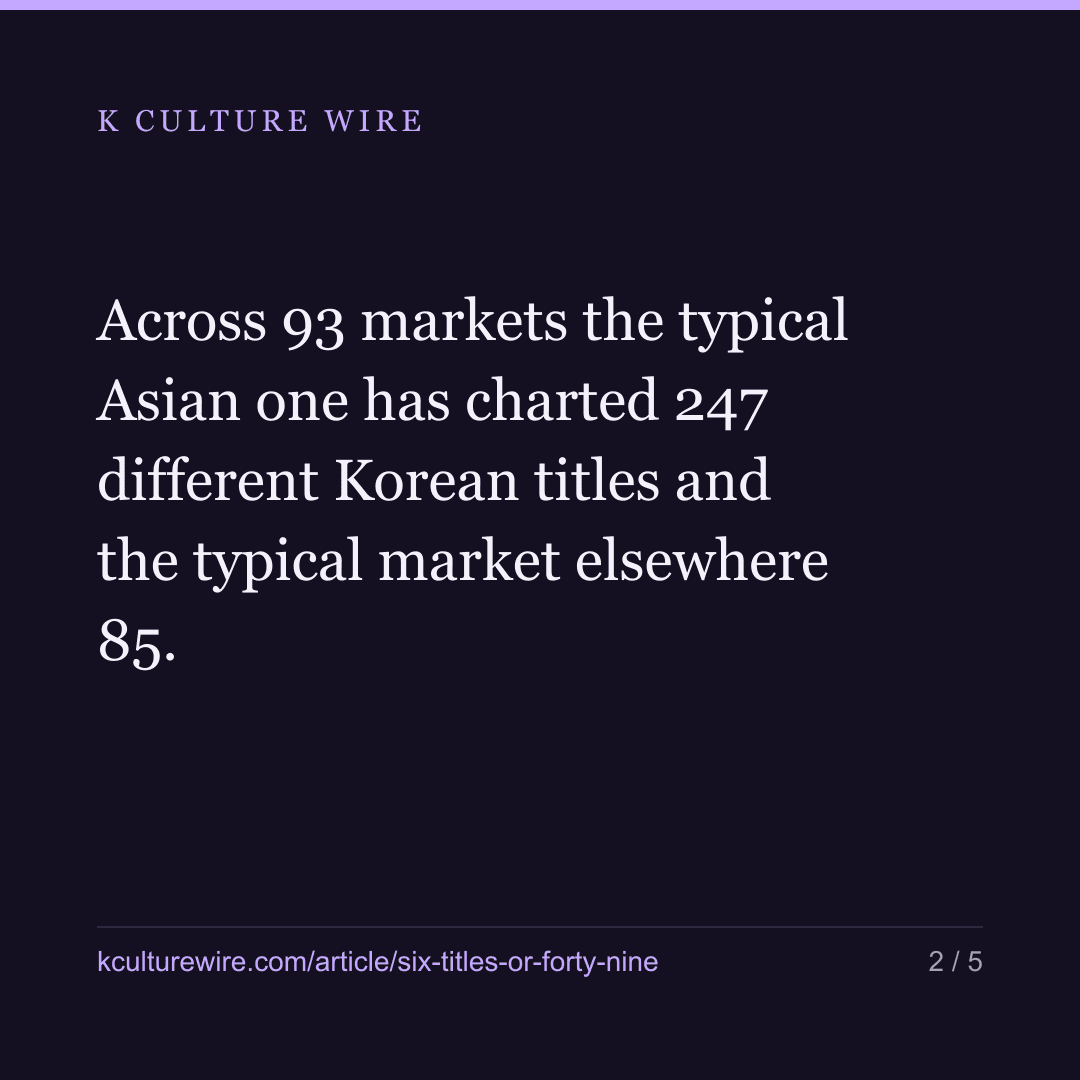
The typical Asian market has charted 247 Korean titles. Elsewhere, 85.
| Markets | Korean places | Different Korean titles | Titles that fill half | Largest single title | |
|---|---|---|---|---|---|
| The ten Asian markets | 10 | 1,299 | 259 | 56 | 2.7% |
| The other markets | 83 | 215 | 89 | 19 | 14.3% |
All figures are medians of the markets in each group.
In the median Asian market it takes 54 different Korean titles to account for half of all the Korean chart appearances. Everywhere else, 17. And the single biggest Korean title holds 2.8% of the Korean places in the median Asian market against 14.4% elsewhere.
The two ends
| Market | Different titles | Fill half | Largest title | Its share |
|---|---|---|---|---|
| South Korea | 592 | 124 | I am Solo | 3.9% |
| Indonesia | 275 | 57 | Squid Game | 2.3% |
| Thailand | 275 | 52 | Alchemy of Souls | 4.2% |
| Vietnam | 261 | 52 | Reply 1988 | 2.4% |
| Malaysia | 259 | 55 | Squid Game | 2.7% |
| Ukraine | 19 | 2 | Squid Game | 46.7% |
| Latvia | 32 | 2 | Squid Game | 47.0% |
| Estonia | 35 | 3 | Squid Game | 43.0% |
| Ireland | 39 | 8 | Squid Game | 22.2% |
| United States | 39 | 7 | Squid Game | 31.8% |
Twenty Korean titles have ever entered Ukraine’s top 10 across five years. Two of them account for half of all Korean chart appearances there.
There is a second thing in that table, and it is not the one we expected to write. Squid Game is the largest Korean title in Indonesia and Malaysia too. The difference is not which title leads — it is how much of the market that title is. It leads Indonesia with 2.3% and Latvia with 47%, and those two numbers describe completely different viewing experiences of the same show.
Where the leader is a different title, it is a different kind of title. Korea’s own most persistent charting title is I am Solo, a dating show; Vietnam’s is Reply 1988, a series from 2015; and Thailand’s is Alchemy of Souls. None of those is the programme a reader outside Asia would name if asked for a Korean show.
The objection, and what happens to it
A market with fewer Korean places will look more concentrated for arithmetic reasons alone. If a country only ever has 84 Korean chart appearances, it cannot possibly spread them over 247 titles. On that reading this page says nothing except “some markets chart less Korean content”, which we already published.
So we tested it. Take only the markets holding between 600 and 1,200 Korean places — a range where both groups have members — and compare within it.
| Matched on Korean places (600–1,200) | Markets | Korean places | Different titles | Titles that fill half | Largest title |
|---|---|---|---|---|---|
| Asian | 2 | 1,186 | 253 | 56 | 6.6% |
| Other | 7 | 669 | 155 | 31 | 6.7% |
The Asian markets in that band are Japan and Singapore. The others are Bangladesh, Bolivia, the Maldives, Nigeria, Peru, Qatar and Saudi Arabia.
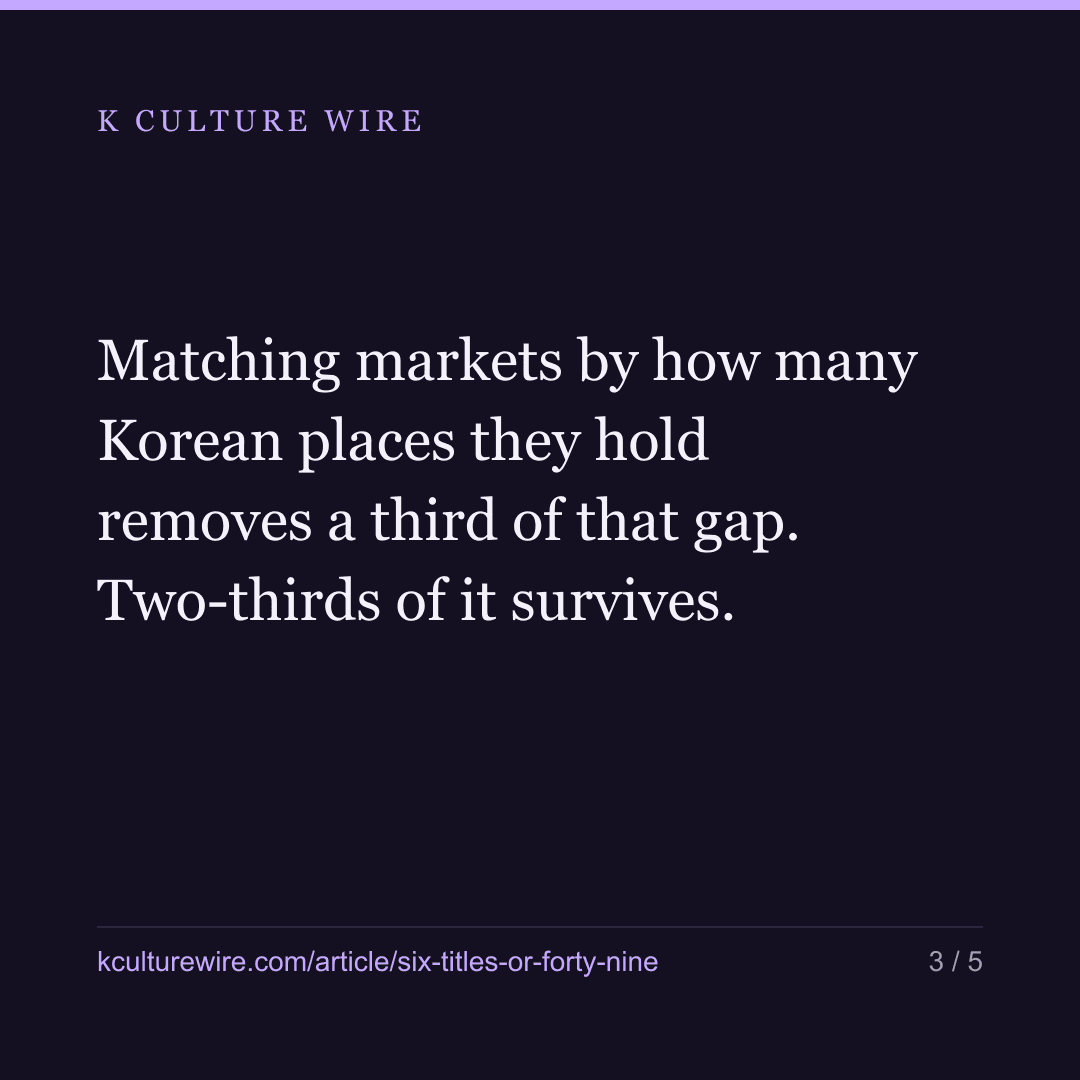
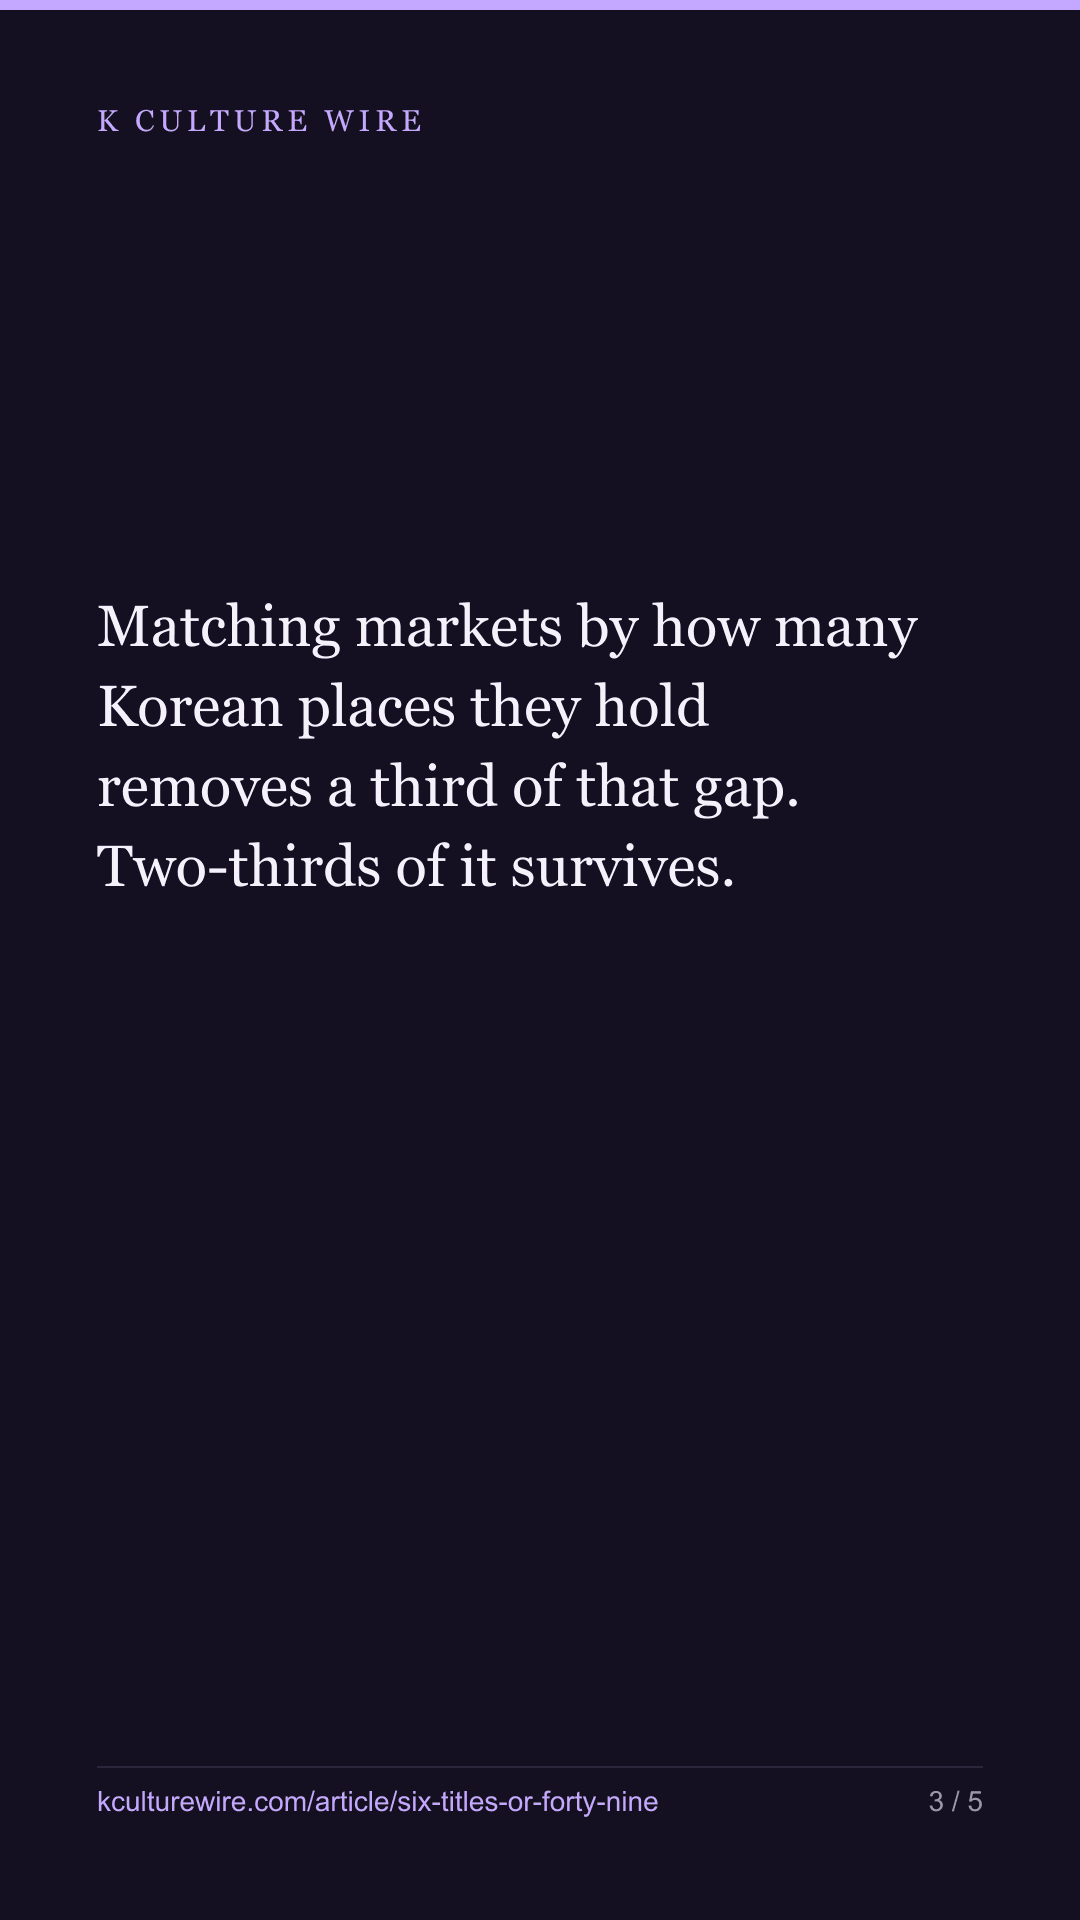
The raw gap in titles-to-fill-half was 37 (56 against 19). Inside the matched band it is 25 (56 against 31). So about a third of the gap was volume, and two-thirds of it is not. That is the honest size of the finding: smaller than the first table suggests, and not zero.
Japan is the shallowest of the ten
Within the ten Asian markets, the number of titles needed to fill half runs from 35 to 124. The low end is Japan: 245 different Korean titles have charted there, as many as its neighbours, but 35 of them carry half the places and its largest single title holds 6.6% — closer to the non-Asian pattern than to Vietnam’s 52 and 2.4%.
We are not going to explain that here. Japan has a large domestic catalogue of its own and a separate history with Korean television, and this data can distinguish none of it. We are naming it because a group of ten with one member behaving differently is worth saying out loud rather than leaving inside a median.
What this is not
It is not a measure of taste. A market whose top 10 rarely holds a Korean title may be watching a great deal of Korean content that never breaks into ten places against everything else Netflix carries; nothing here can see that.
It is not a ranking. The two ends are printed to show the width of the range, and the middle 80-odd markets are not ordered against each other anywhere on this page.
And the surviving two-thirds of the gap is not explained. We controlled for one thing — how many Korean places a market has at all — because it was the objection we could test. Release windows, subtitle and dub availability, and the size of each market’s domestic production are all plausible and none of them is separated here.
Every figure above, including the matched-band control and the full width inside the Asian group, is on the catalogue-depth table with what it cannot answer printed beside it.
What changed on 3 September 2026
We recounted from the current files and two things needed saying.
The headline number was wrong by one. It takes seven Korean titles to fill half of America’s Korean chart places, not six. Our own check had the word “six” written into it by hand, so the check was asking the article to repeat a figure the data no longer supported — a check that enforces a stale number is worse than no check. It now reads both figures from the data.
Every table on this page was rebuilt from the data file rather than edited by hand, so the market medians and the two extremes reflect the current 268-week record.
The finding did not change. A market’s Korean share says nothing about how many different Korean titles it has actually seen, and the gap between the Asian markets and the rest survives even after we match markets on how many Korean places they have at all.
Where these numbers come from
Sources
- Netflix — Tudum weekly Top 10 country lists for every country Netflix publishes — 93 markets with a complete record, 265 weeks from 2021-07-04 to 2026-07-26 · https://www.netflix.com/tudum/top10
- Wikidata — Country of origin (P495 = Q884) to identify Korean titles, with titles Netflix classes on its English-language global charts excluded · https://query.wikidata.org
What we checked
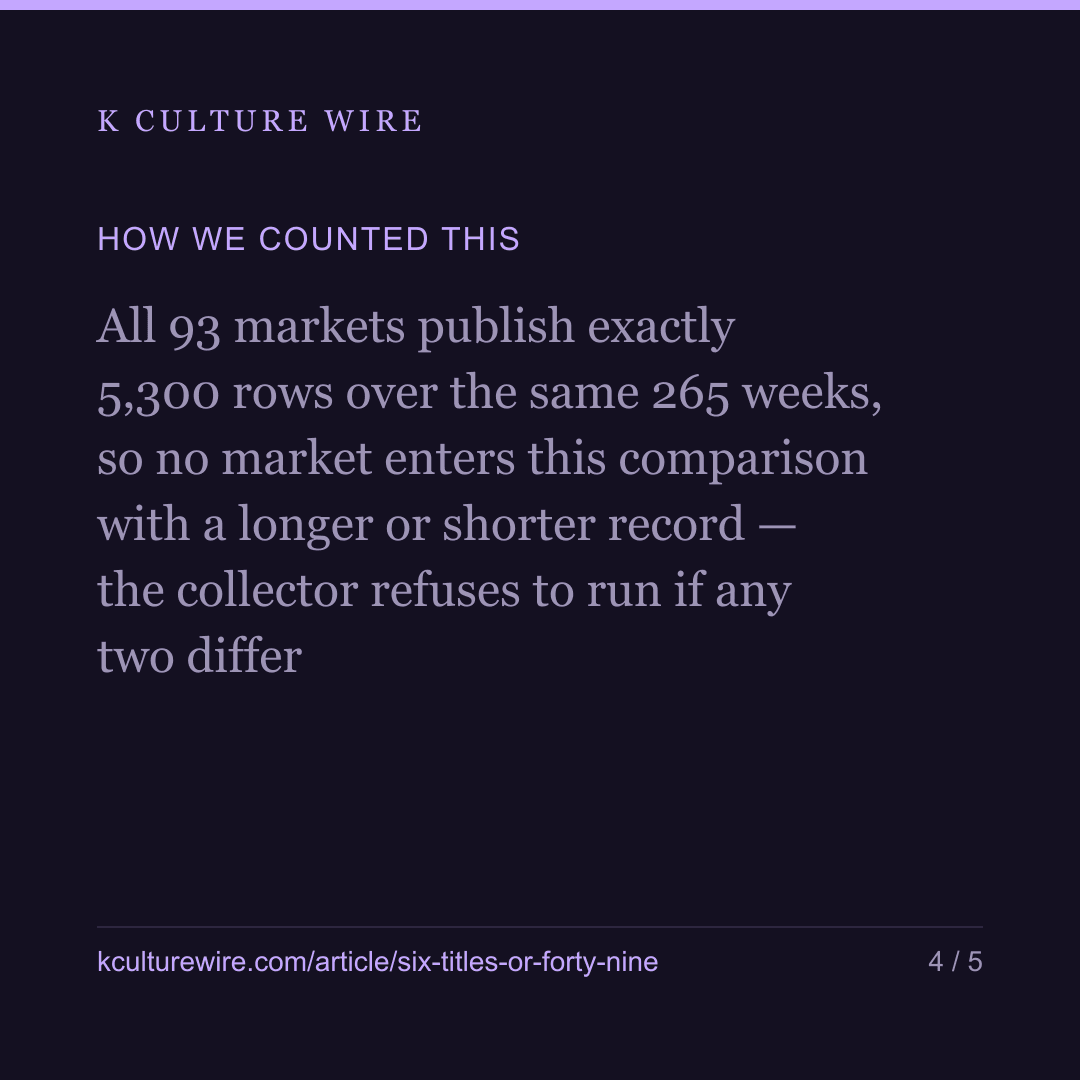
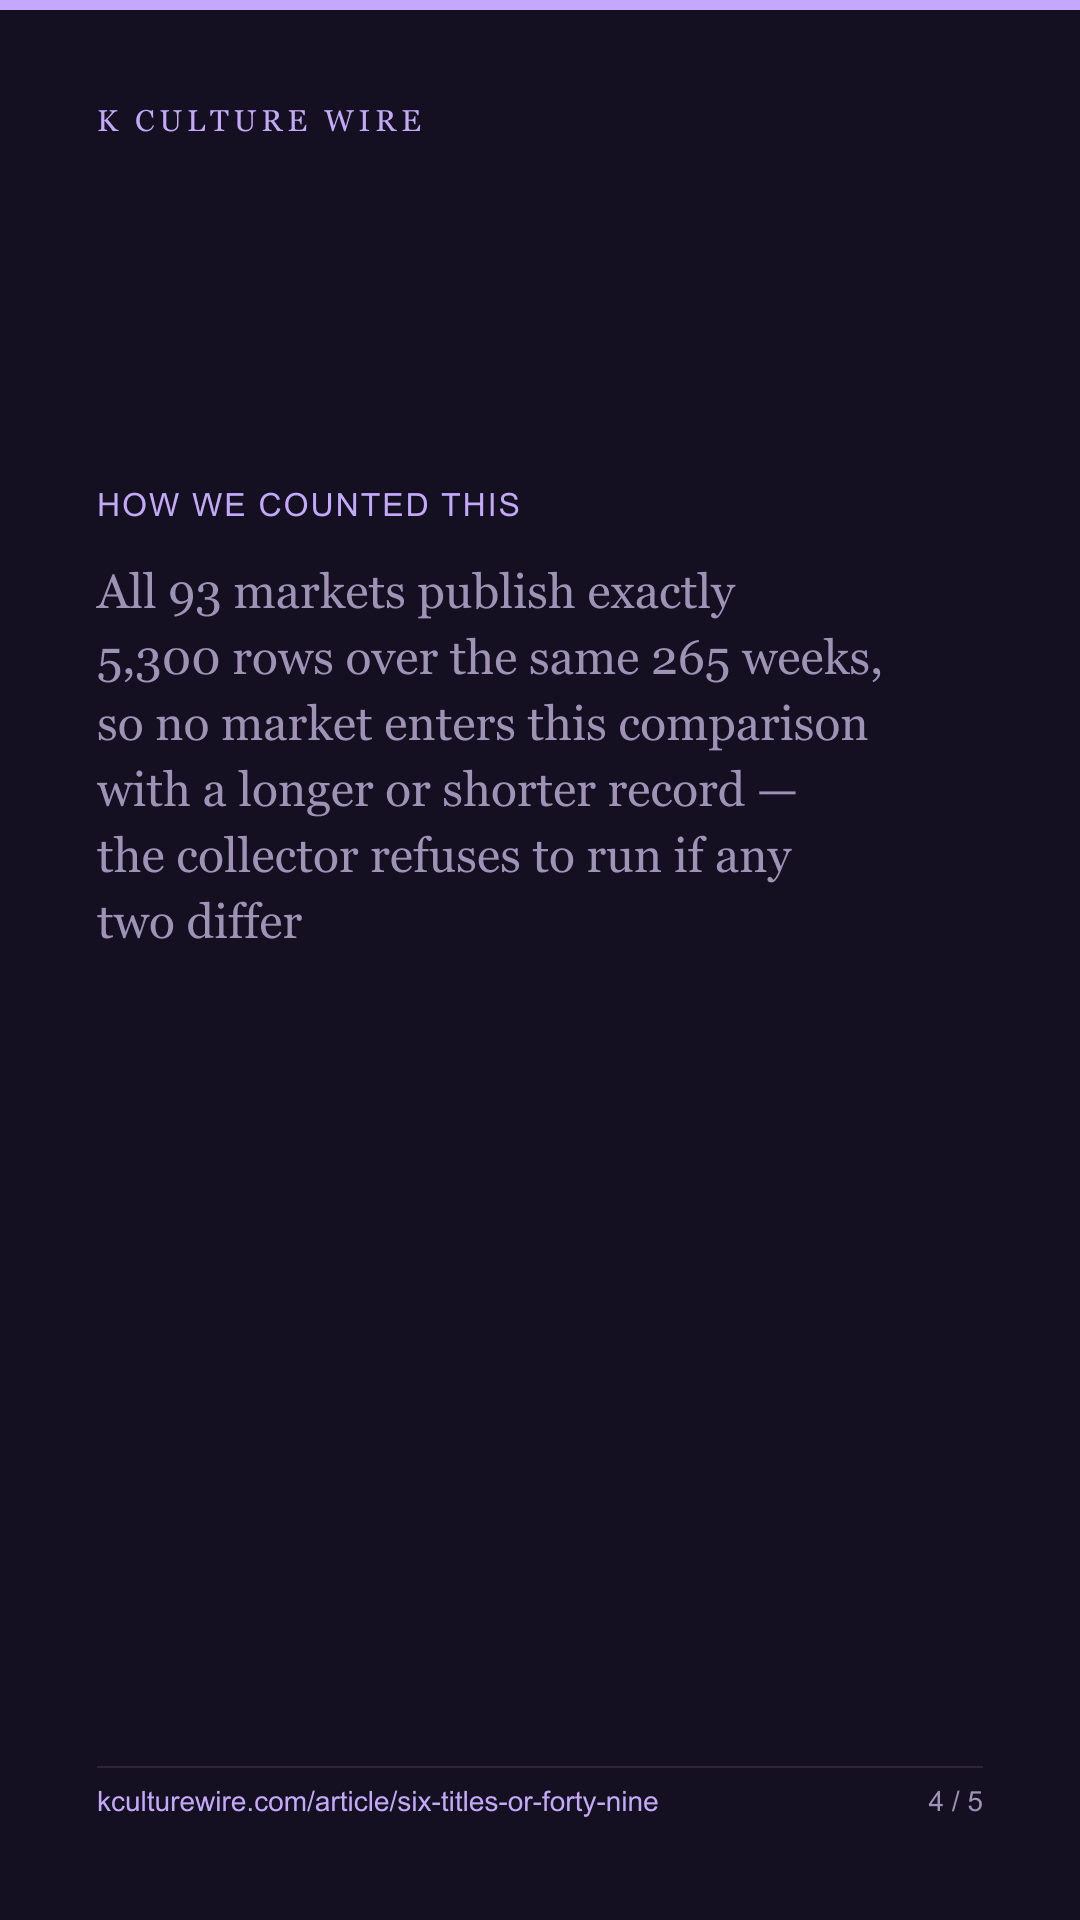
- All 93 markets publish exactly 5,300 rows over the same 265 weeks, so no market enters this comparison with a longer or shorter record — the collector refuses to run if any two differ
- The depth figure is recomputed from each market's own title counts rather than read from a stored value, and the collector refuses to run if any market's half-count exceeds its own title count
- The ten Asian markets are the same ten that hold above 20% on our world-share page. They were not selected again for this piece, and no market was moved between groups after the numbers were seen
What we left out, and why
- Russia, whose list Netflix stopped publishing in February 2022 after 700 rows against every other market's full record
- Viewing. Country lists carry a rank and no hours figure. A title watched steadily without breaking into a top ten is absent here
- Taste. This measures which titles entered a top 10, not what anyone preferred, and a market with a narrow Korean catalogue may be watching plenty that never charts
- Any claim that the surviving gap is cultural. We have controlled for one thing — how many Korean places a market has at all — and there are other candidates we have not tested
The data behind this
Written from the same data
Take this away — 10 cards
The figures in this article, as images. Free to repost with the address on them.
If you work in this business
Everything on this page is measured from the same weekly Netflix lists, per market and per title. We publish the pages free; what we sell is the same measurement cut to one company's catalogue — including the figures behind /catalogue-depth and /world-share.
What a company sheet contains, and what it cannot tell you →