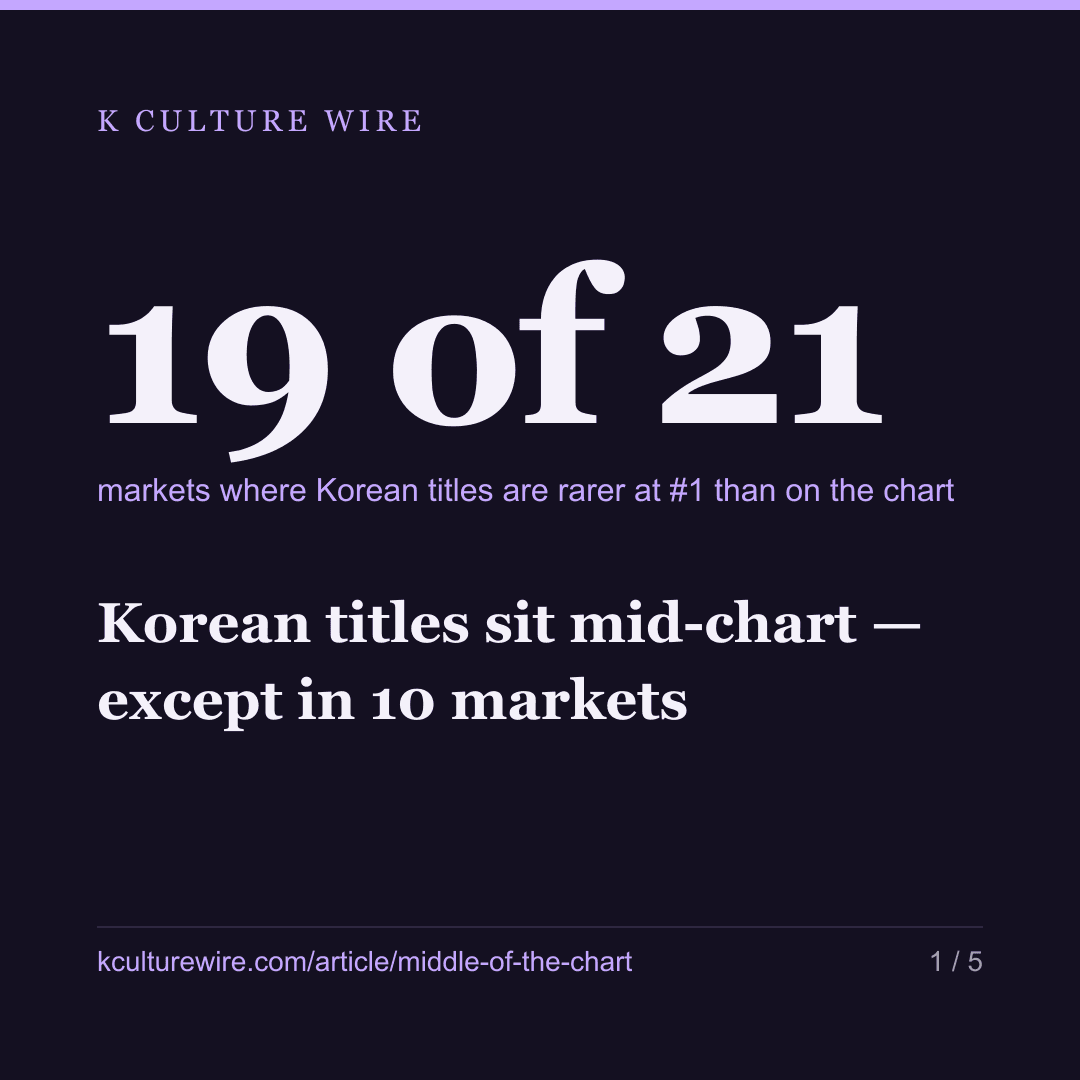
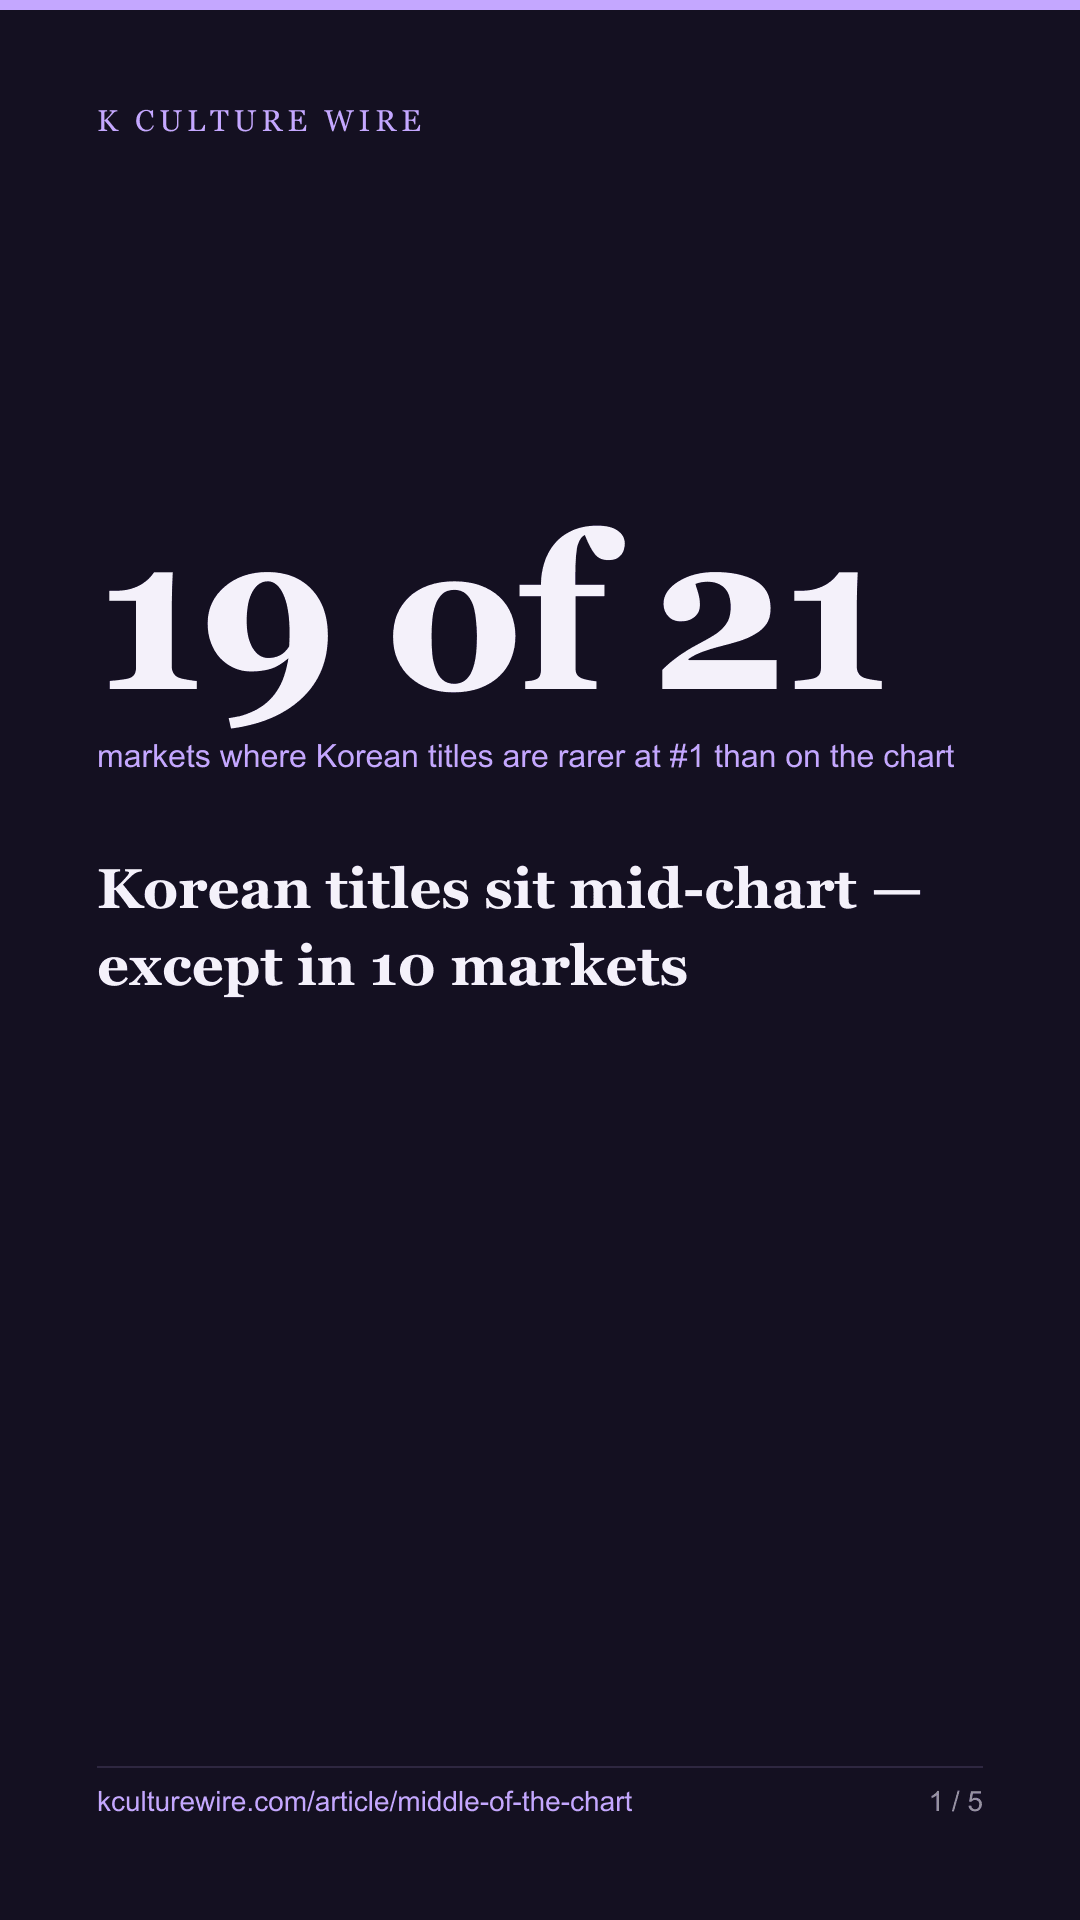
Korean titles sit mid-chart — except in 10 markets
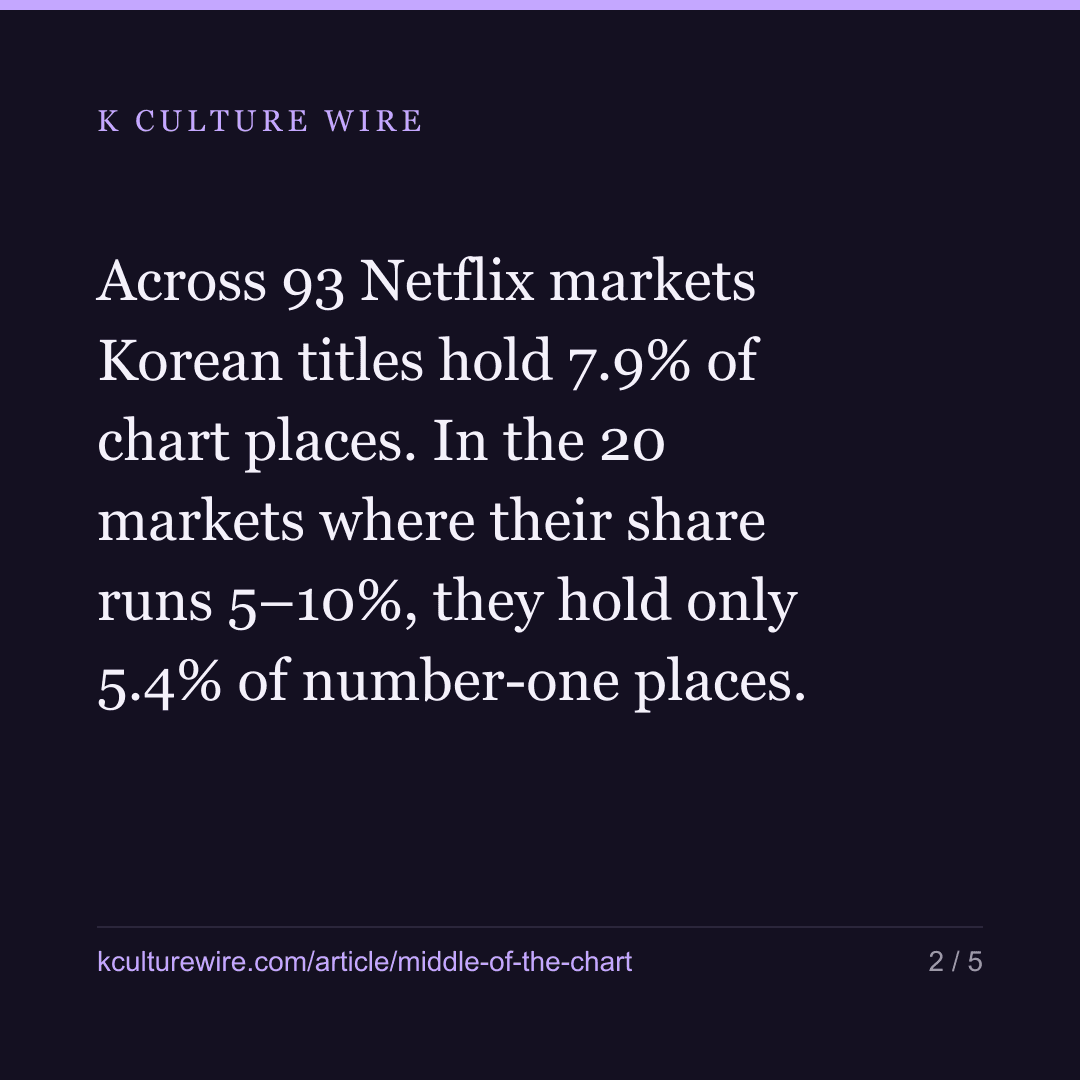
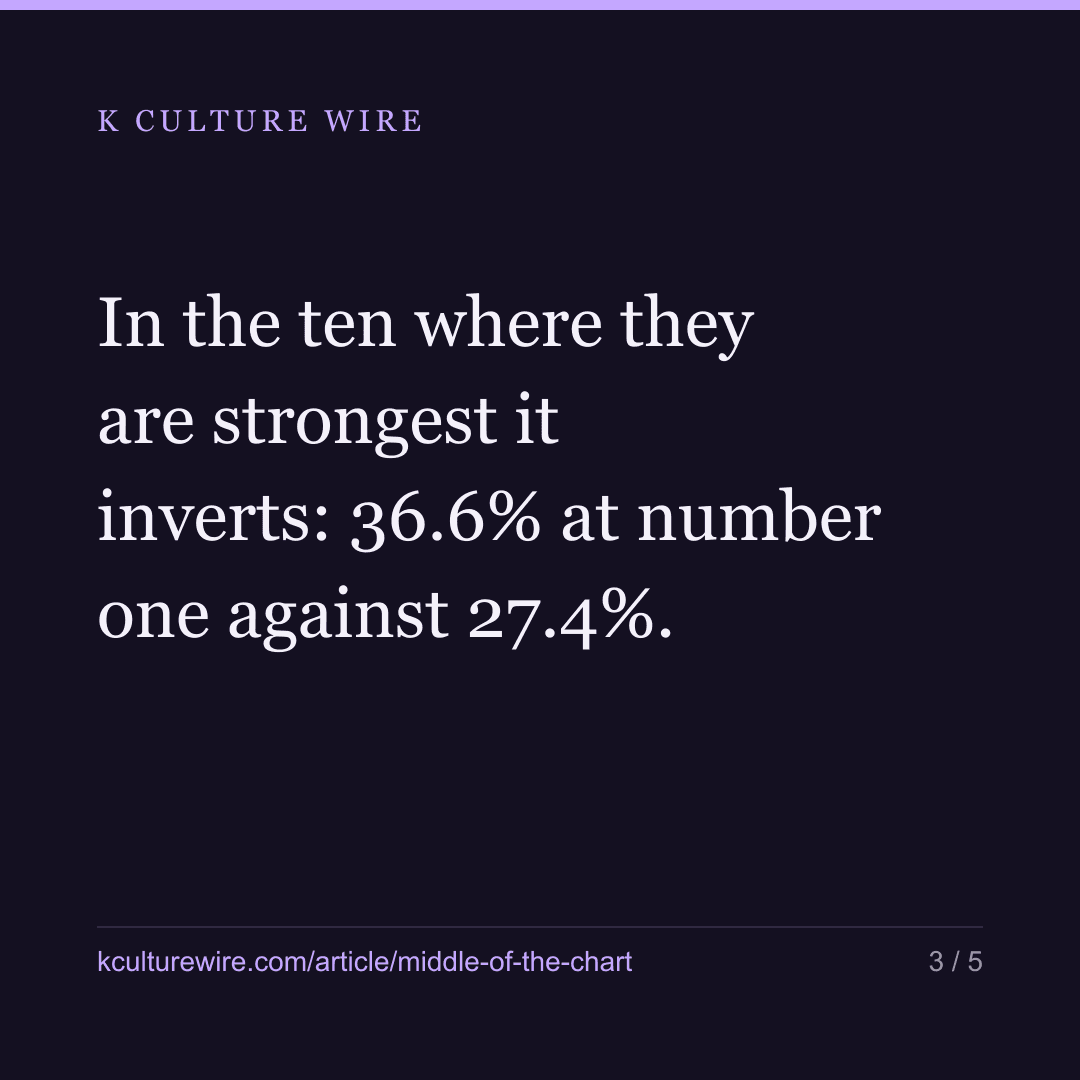
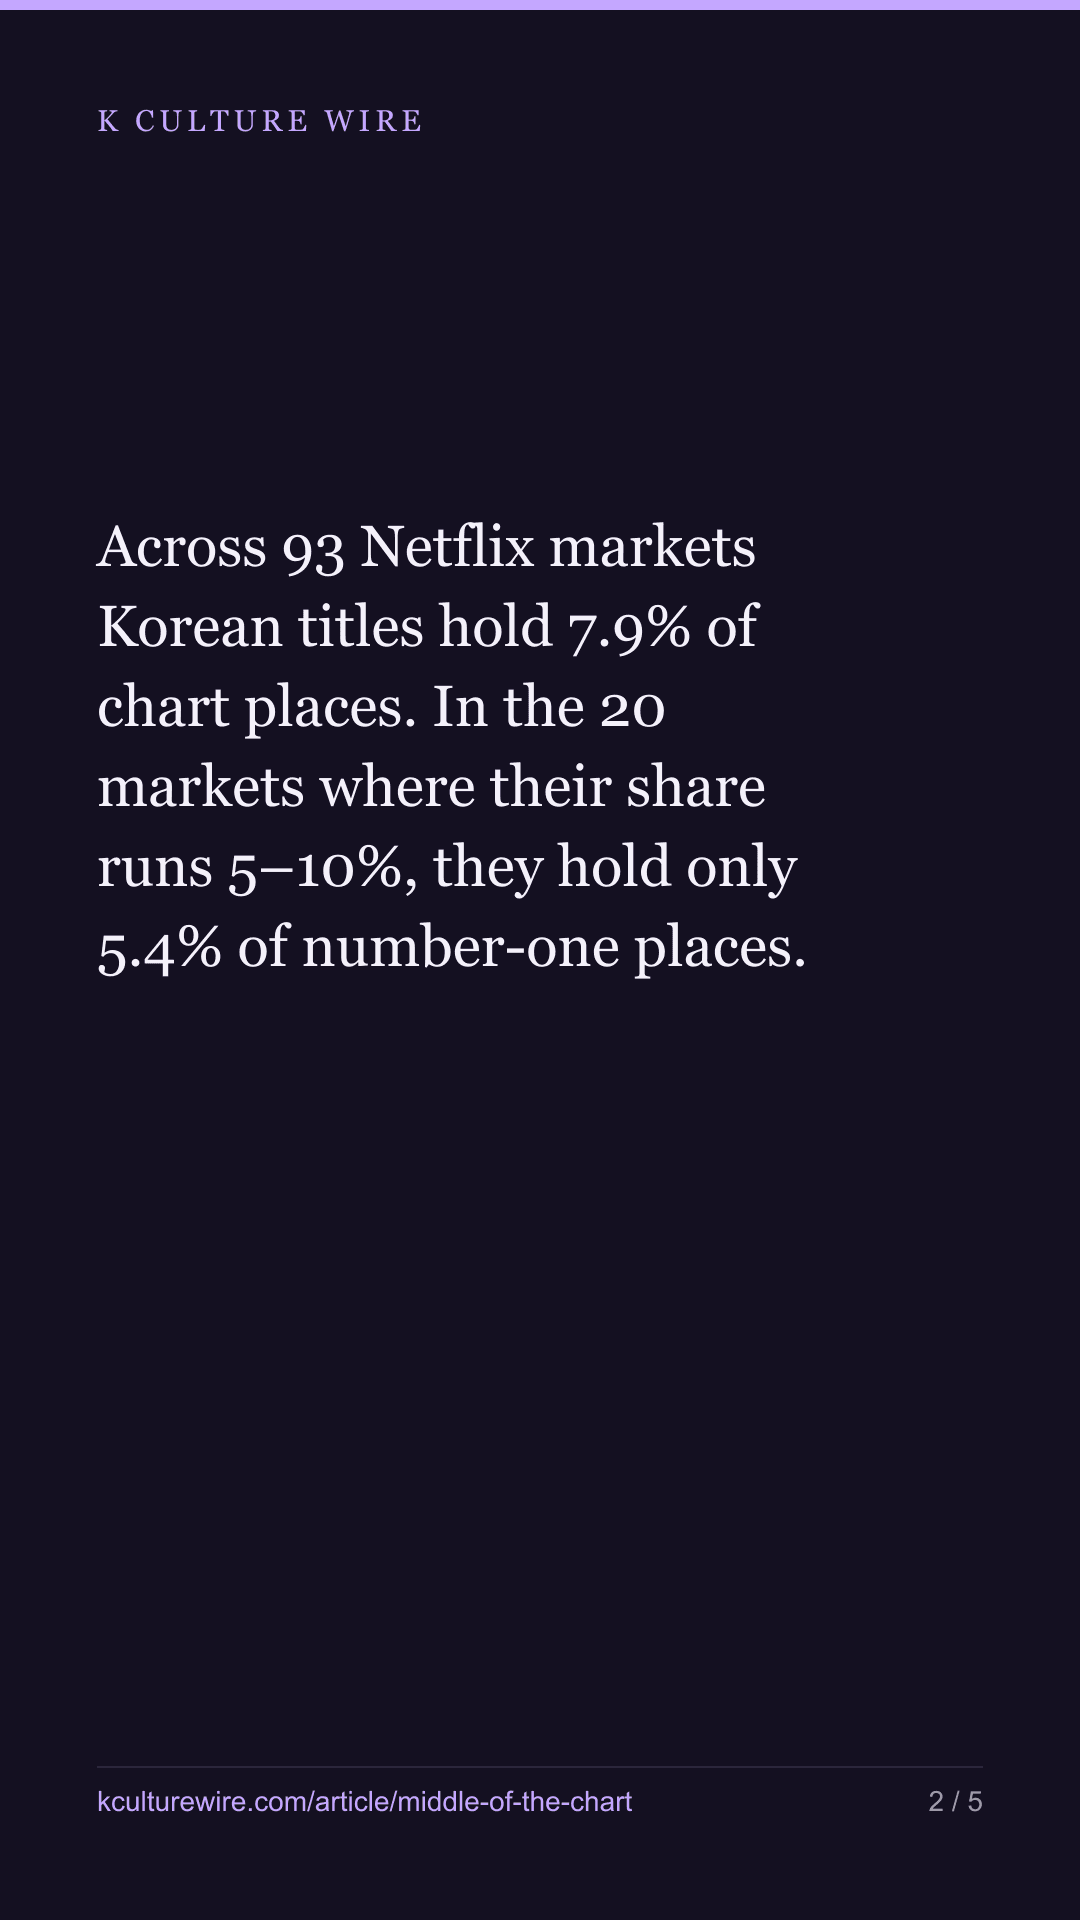
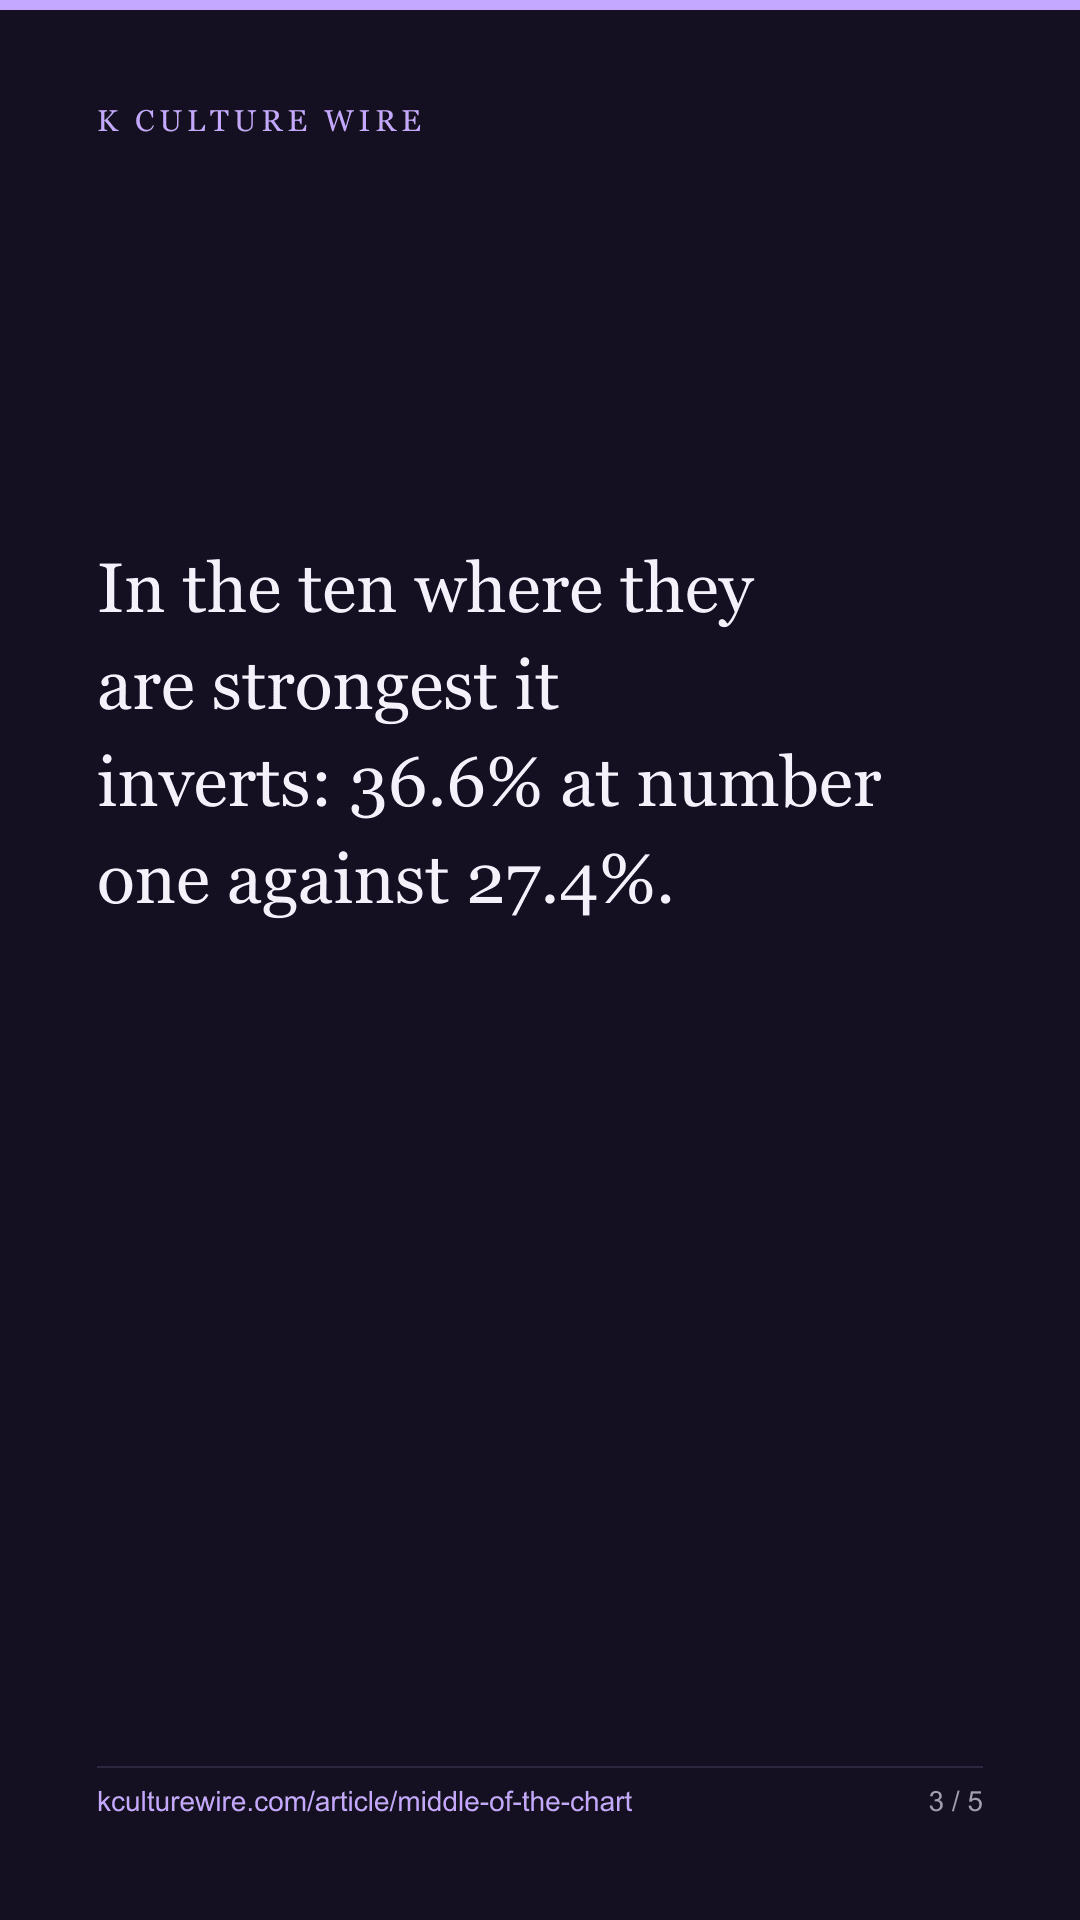
Across 93 Netflix markets Korean titles hold 7.9% of chart places. In the 20 markets where their share runs 5–10%, they hold only 5.4% of number-one places. In the ten where they are strongest it inverts: 36.6% at number one against 27.4%.
The table this is written from: /rank-shape
Every chart page we have published counts places. A Korean series at number one in Vietnam and a Korean film at number ten in Belgium both count as one place, and 498,480 of those places across 93 markets is how we get the figure we keep repeating: 7.9% of the chart is Korean.
That figure hides a question we had never asked. The places are not identical. A tenth of them are number one. Are Korean titles as likely to be there as anywhere else?
Mostly, no.
Added up, though, the answer looks like nothing at all. Across all 93 markets Korean titles hold 8.1% of number-one places against 7.9% of places overall, and 50 of 93 markets sit lower at number one than across their chart. That is a coin toss. Anyone who asked this question once and stopped there would publish a flat line and move on, and we nearly did.
It separates only when the markets are grouped by how much of the chart Korean titles hold to begin with — and then it separates in two opposite directions at once, which is precisely why the total comes out flat.
The middle of the chart
Group the 93 markets by how much of their chart is Korean to begin with, and the number-one column separates from the rest.
| Korean share of the market | Markets | #1 | #5 | #10 | All places | #1 minus all |
|---|---|---|---|---|---|---|
| Under 5% | 48 | 2.9% | 2.8% | 3.3% | 2.8% | +0.1p |
| 5–10% | 21 | 5.5% | 8.5% | 7.8% | 7.6% | −2.1p |
| 10–20% | 14 | 9.2% | 13.1% | 10% | 11.6% | −2.4p |
| 20% and over | 10 | 36.6% | 26.9% | 21.1% | 27.4% | +9.2p |
The two middle rows are humps. Korean titles are least common at number one, most common around the middle of the list, and taper again toward number ten. The bottom row is the opposite: a slope that starts at its highest point and falls all the way down.
This is not an average concealing disagreement. On the 5–10% row, 19 of 21 markets individually sit lower at number one than across their chart. On the bottom row, none of the ten do — every one of them is higher.
Films and series are separate top tens, and a pattern that only appeared when they were added together would be worth nothing. Split apart, the 5–10% row is −0.6 points for films and −3.7 points for series; the bottom row is +4.4 and +14. Different sizes, same direction, four times over.
The objection, which is right three times out of four
Number one is a tenth as many places as the chart. One title that stays on top for a year can manufacture any shape you like, so the first thing to check is whether that is all this is.
In three of the four bands, it is close to all it is.
| Korean share of the market | Distinct titles at #1 | Largest title’s share | #1 share without the top three |
|---|---|---|---|
| Under 5% | 50 | 68.2% | 0.6% (all places: 2.8%) |
| 5–10% | 68 | 35.8% | 2.9% (7.6%) |
| 10–20% | 75 | 28.3% | 5.7% (11.6%) |
| 20% and over | 263 | 5.1% | 32.2% (27.4%) |
The largest title is the same one in all four rows. In the 49 markets where Korean titles hold under 5% of the chart, Squid Game accounts for more than two-thirds of every Korean week at number one, and removing the three biggest titles drops that band’s number-one share to 0.7% — against 2.9% of the chart overall. The 0p in the table above was not a Korean chart reaching number one. It was one title.
The bottom row does not behave that way. The average market there saw 87 different Korean titles reach number one, the largest took 5.1% of those weeks, and taking out the top three leaves 32.2% — above the 27.4% those markets give Korean titles across the whole chart. Reaching number one there is ordinary.
So the honest summary is narrower than the table first suggests, and more interesting: in most of the world, Korean titles get onto the chart far more easily than they get to the top of it, and the exceptions are one title. In ten markets, they get to the top more easily than they get onto the chart at all.
What a rank cannot tell you
A position is an outcome. These figures cannot say whether a title placed fourth because fewer people watched it, because it opened against something enormous, because it arrived with less promotion, or because a market’s audience treats a foreign title as a second choice rather than a first. Netflix publishes the position and, for some weeks, the hours — never the reason. Anyone who tells you which of those is at work is telling you something this data does not contain, and we are not going to be the ones who do it.
Two other limits are worth naming. The bands are cut by each market’s own measured Korean share, so they are not regions and should not be read as a map, even though the bottom row happens to contain markets that are mostly in Asia. And a market on the bottom row is a market where Korean titles were already a quarter of the chart, so “they own the top there” is a statement about a chart that was never crowded out to begin with.
Why we bothered
Because “7.9% of the chart” is the number we sell, and it turns out to mean two different things. In Vietnam it means Korean titles are a routine first choice. In Poland it means they are a reliable mid-chart presence and, once, Squid Game. Those are not the same business, and a buyer deciding where to place a title should not be handed one number for both.
The full four-band table, both charts split apart, the ten markets named, and the concentration figures that limit every row: where on the chart Korean titles sit. The companion ruler — how few titles fill half of a country’s Korean chart — is at catalogue depth.
What changed on 3 September 2026
Recounted against a rebuilt title list. The finding is unchanged and the direction of every row is unchanged; the figures moved by tenths, and two band sizes moved by one market:
| Was | Now | |
|---|---|---|
| Markets in the 5–10% band | 20 | 21 |
| Markets in the 10–20% band | 15 | 14 |
| 5–10% band, #1 minus all places | −2.2p | −2.1p |
| 5–10% band, markets below at #1 | 18 of 20 | 19 of 21 |
| Split by format, 5–10% band | −0.7p films, −3.6p series | −0.6p films, −3.7p series |
Both tables are now generated from the counted file rather than typed out. That matters here more than in most pieces, because the check that reads this article tests which column a figure sits in — two of these tables have the same row labels, and a right number in the wrong column is a harder mistake to see than a wrong number.
Where these numbers come from
Sources
- Netflix — Tudum weekly Top 10 country lists, 2021-07-04 to 2026-08-16, 498,480 chart places across 93 markets · https://www.netflix.com/tudum/top10
- Wikidata — Country of origin (P495 = Q884) on charting titles, retrieved by item number rather than by name · https://query.wikidata.org
What we checked
- Films and series were counted as separate charts, because they are separate charts, and the pattern survives the split in both directions
- Every band reports how many distinct Korean titles reached number one and what share the largest of them took, because a tenth as many places at rank 1 means one long-running title can make the whole shape
- Direction was counted alongside size — how many markets in each band sit lower at number one — so that a band average cannot be produced by a few extreme markets
- Bands are cut by each market's own measured Korean share, not by region, so the rows are not a map
The data behind this
Written from the same data
Take this away — 10 cards
The figures in this article, as images. Free to repost with the address on them.
If you work in this business
Everything on this page is measured from the same weekly Netflix lists, per market and per title. We publish the pages free; what we sell is the same measurement cut to one company's catalogue — including the figures behind /rank-shape.
What a company sheet contains, and what it cannot tell you →