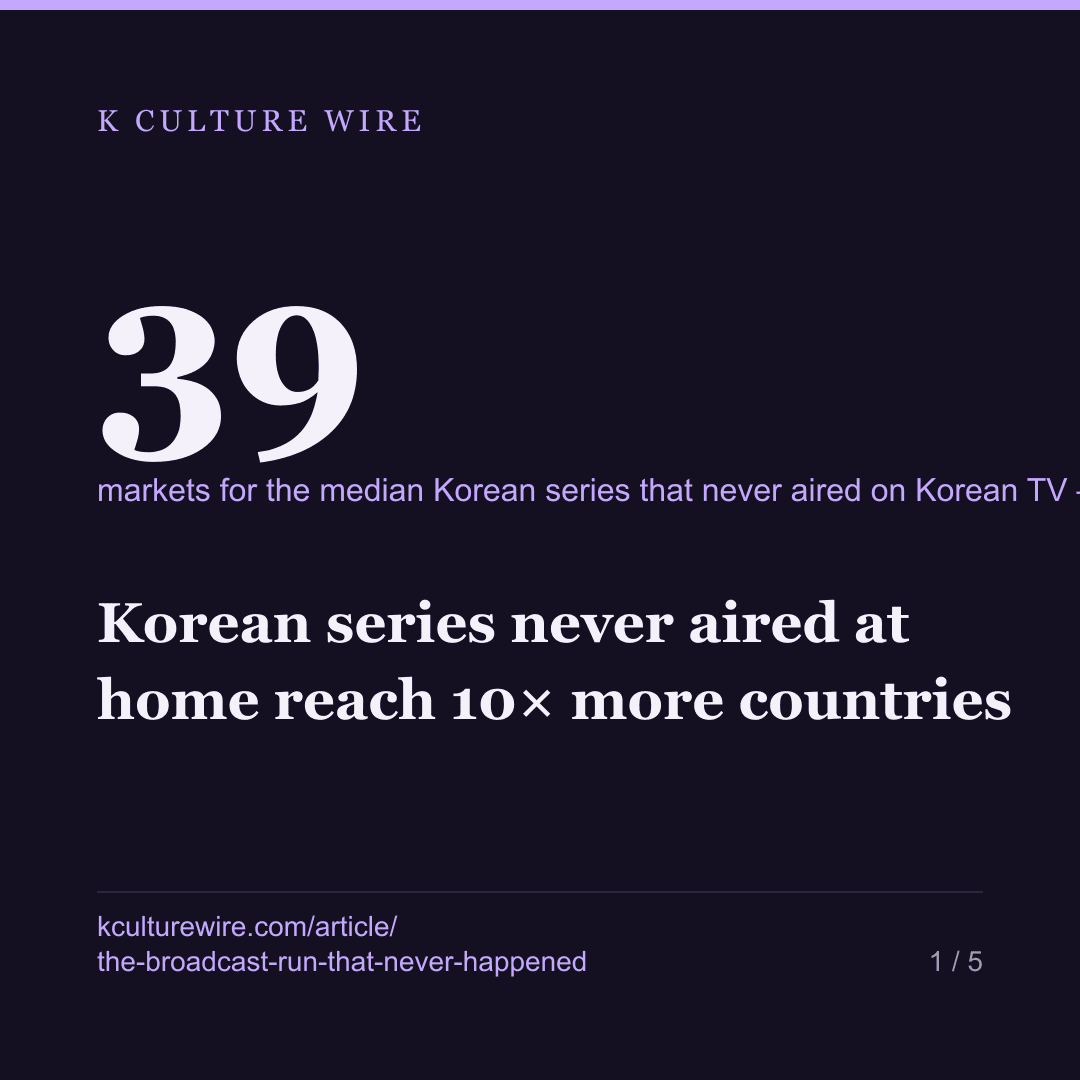
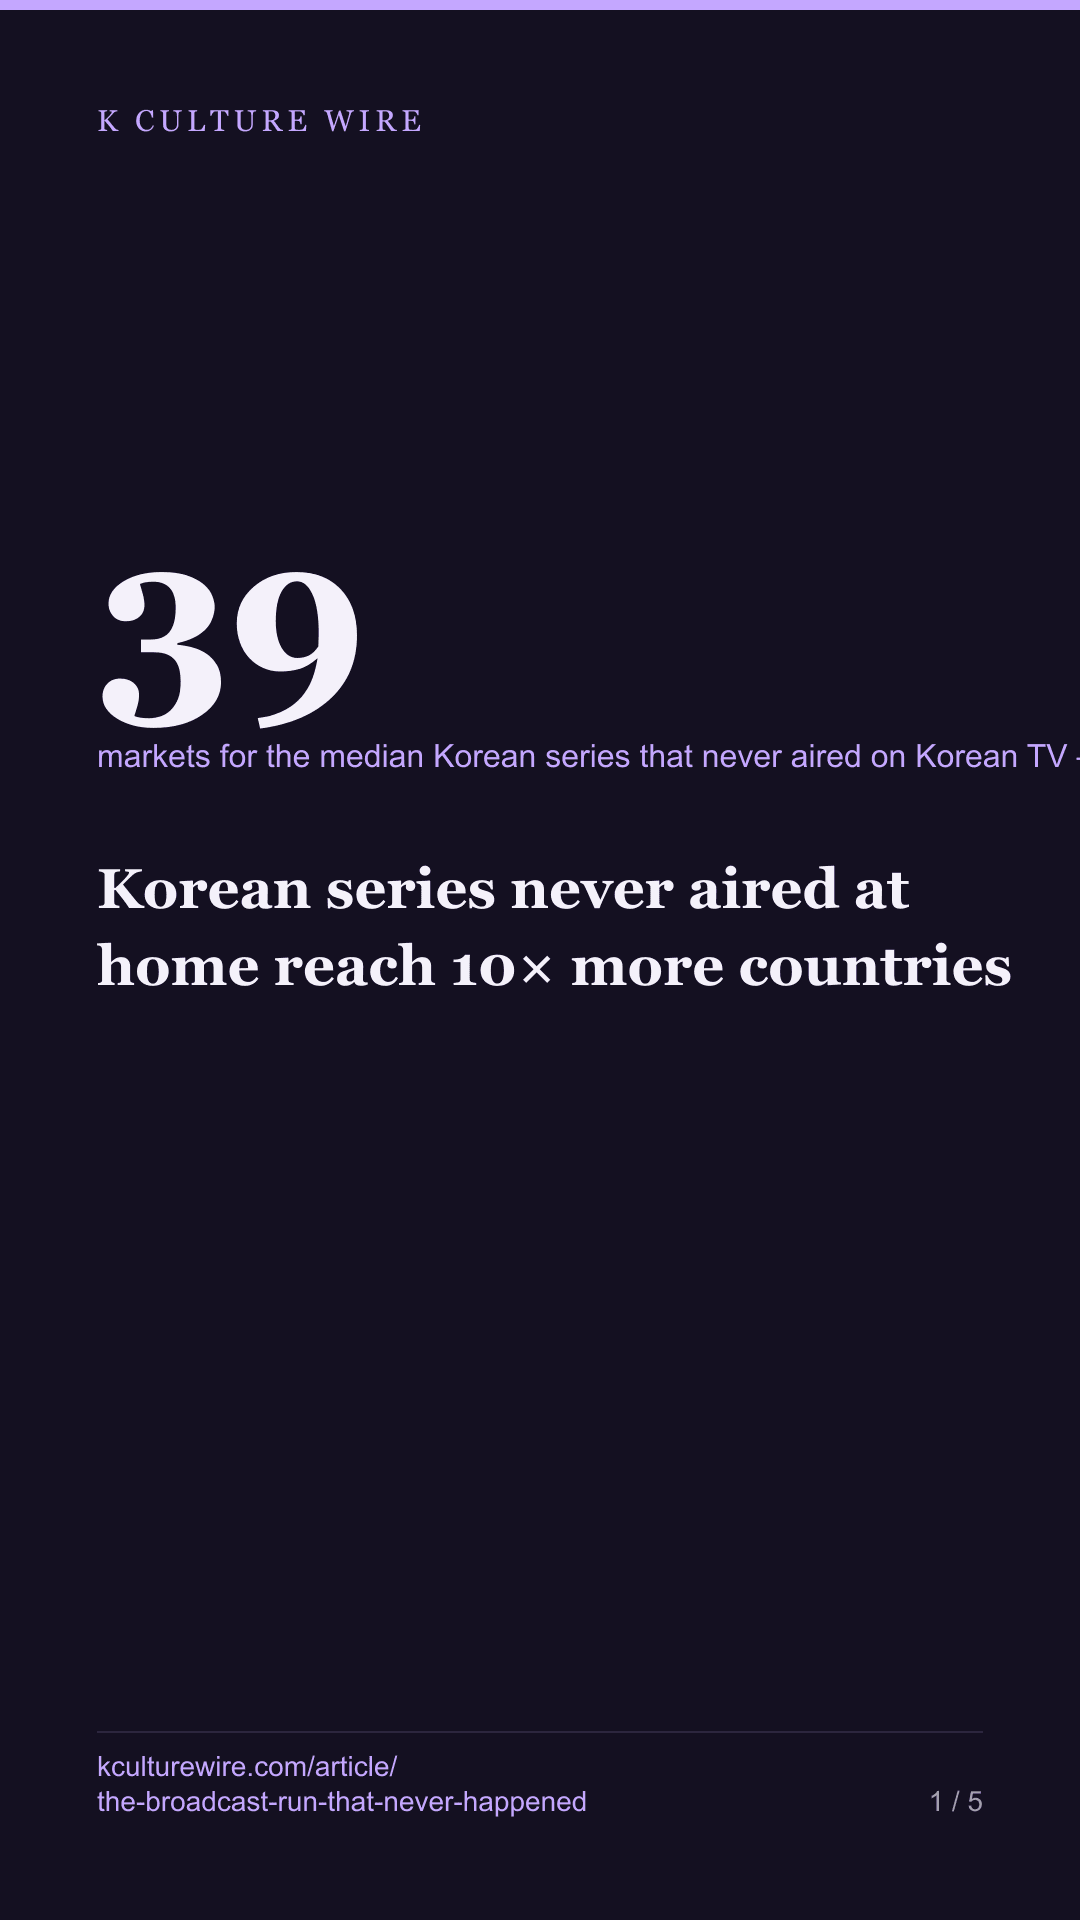
Korean series never aired at home reach 10× more countries
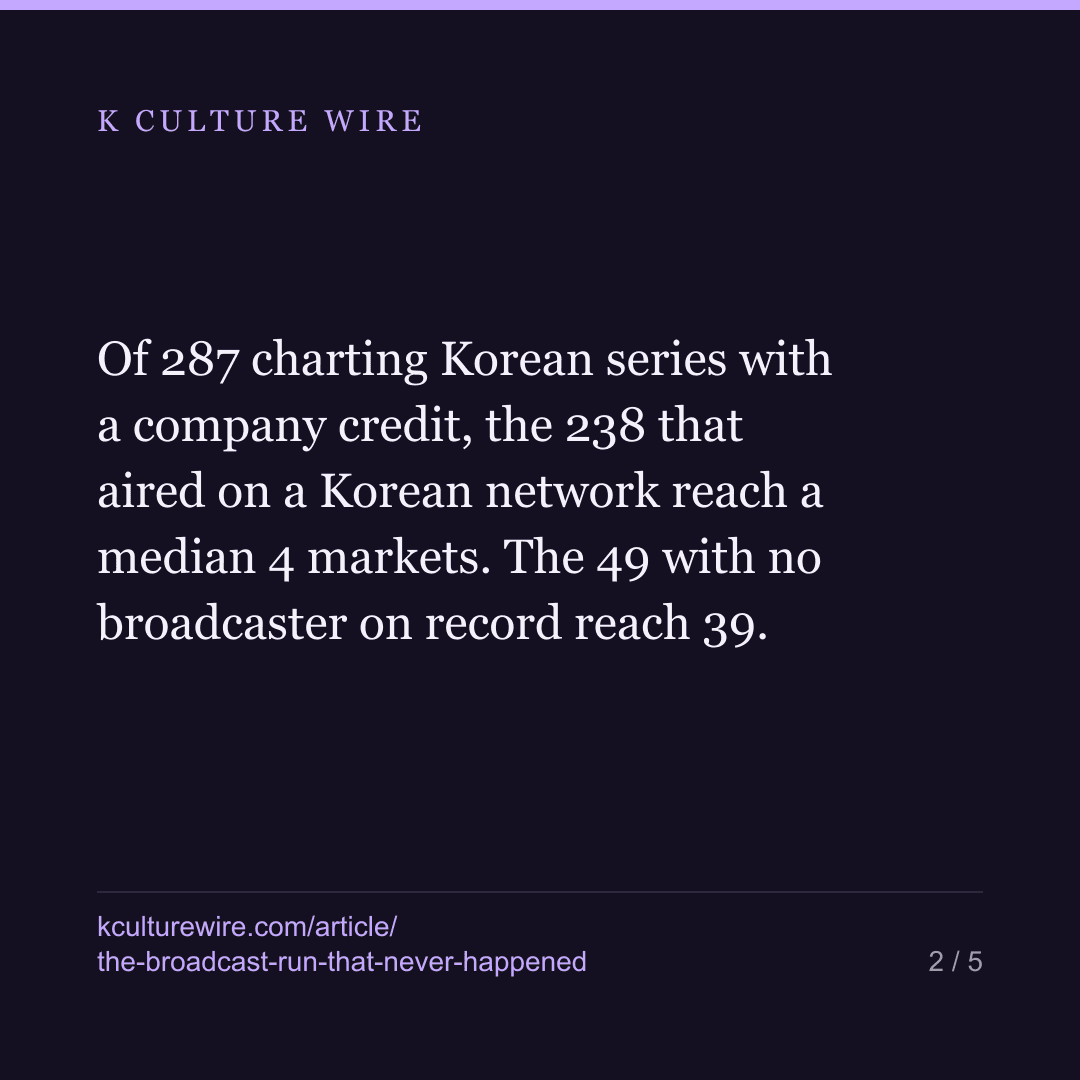
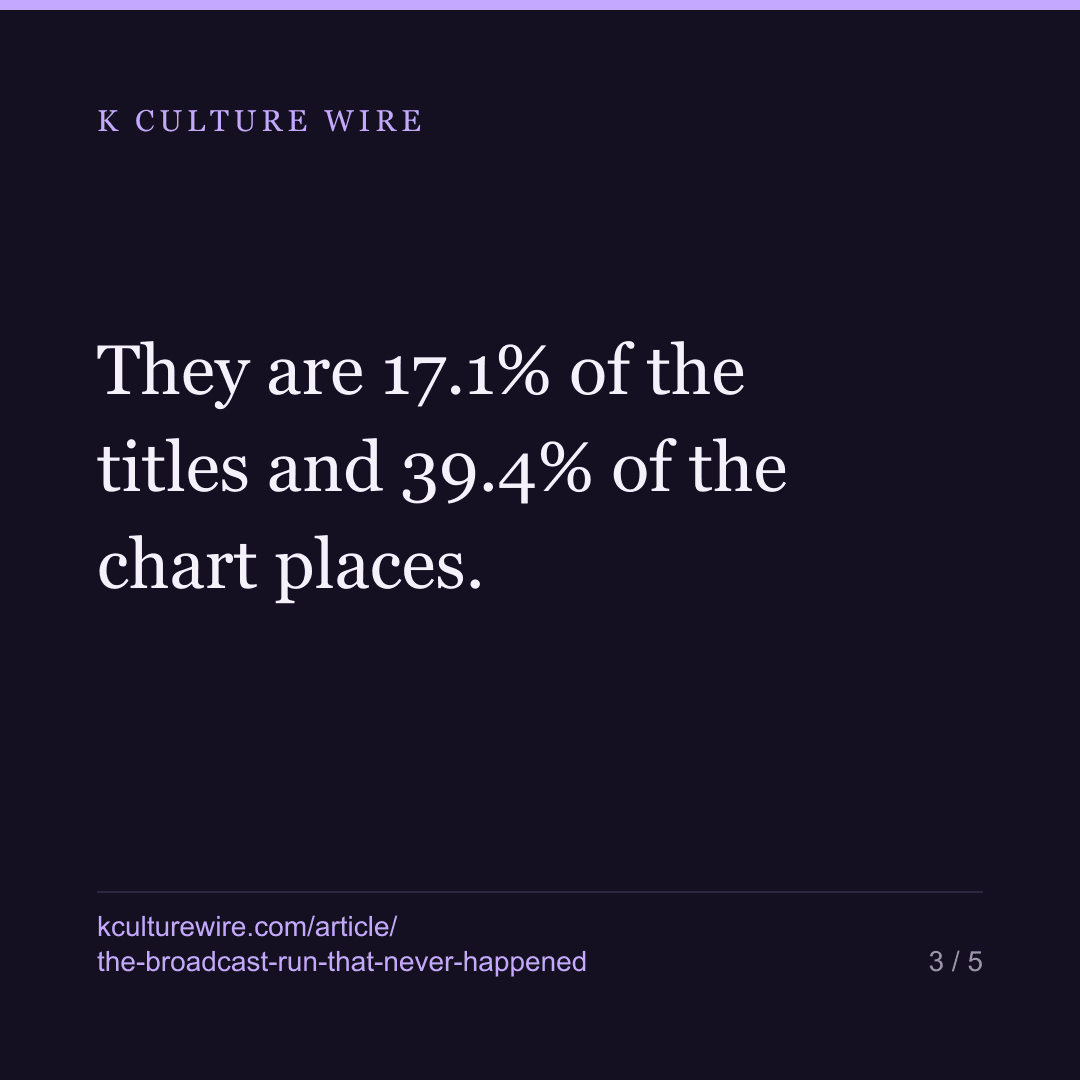
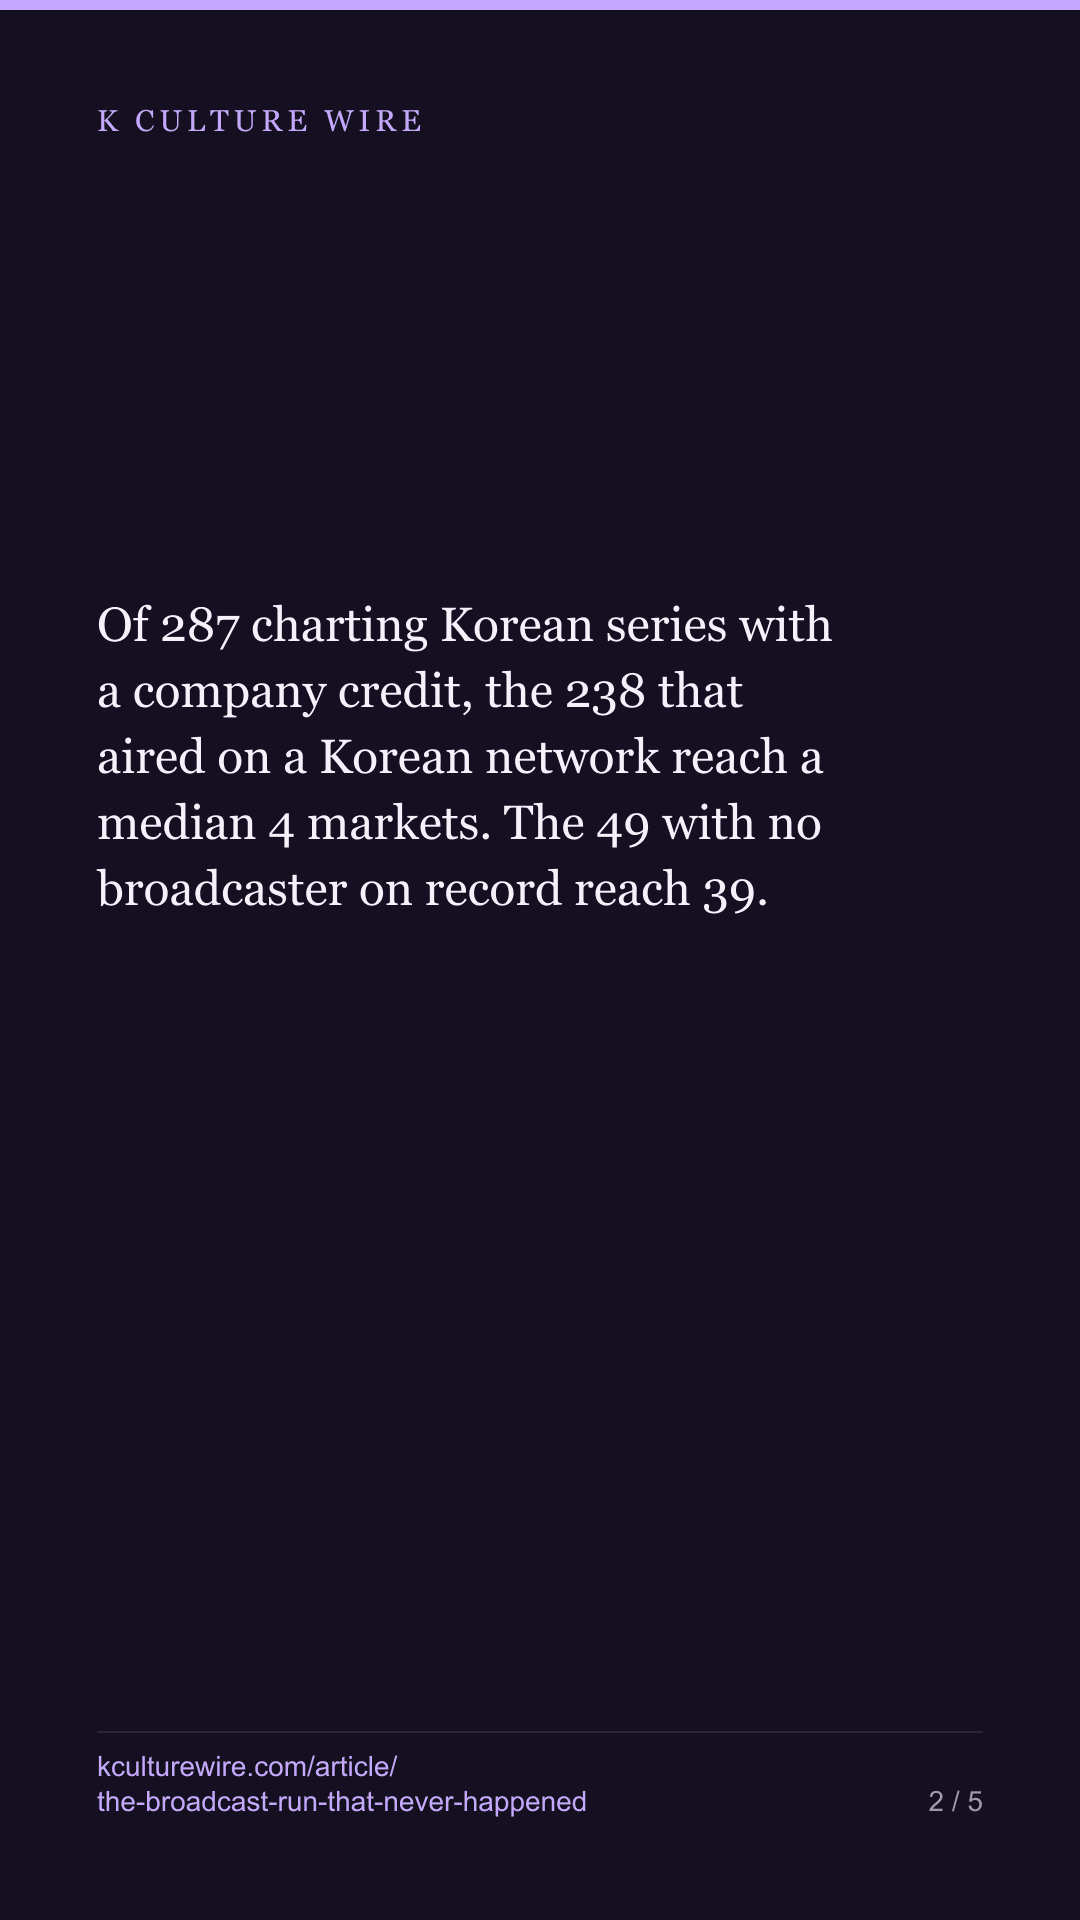
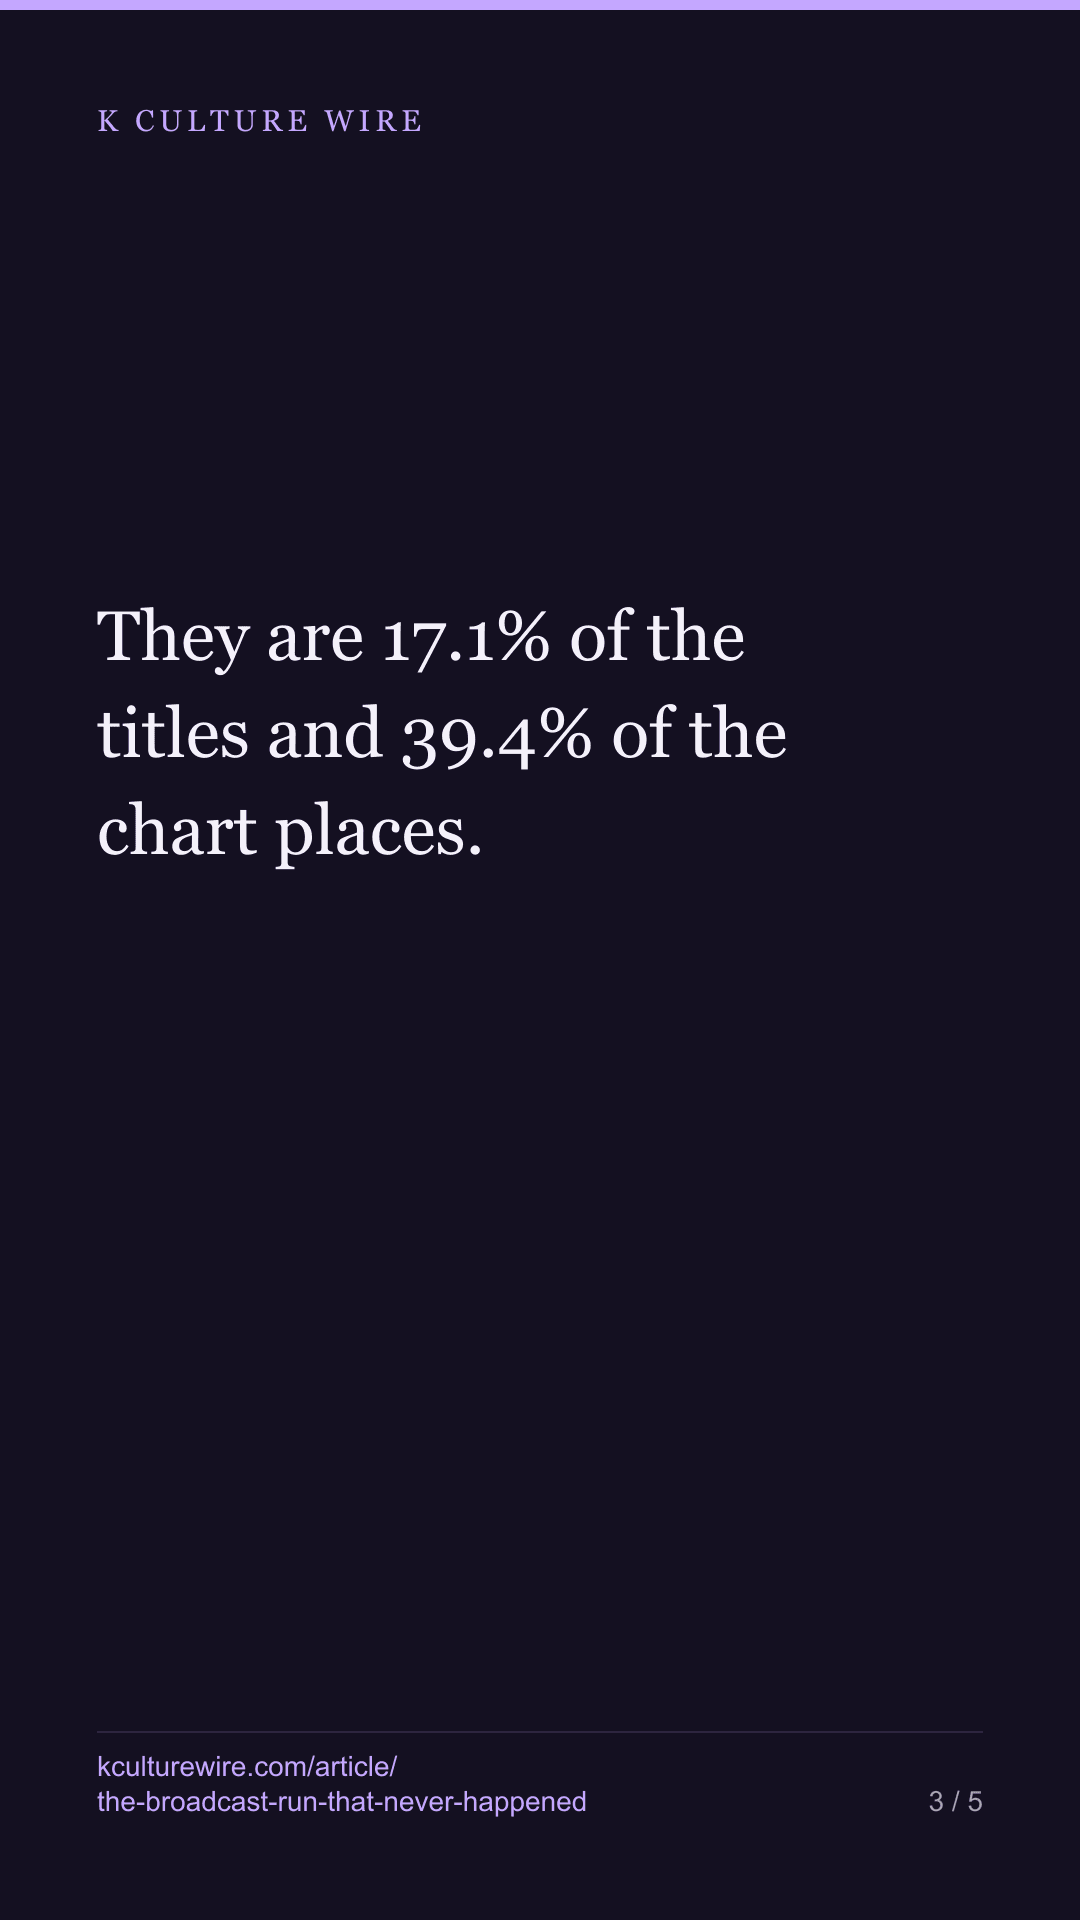
Of 287 charting Korean series with a company credit, the 238 that aired on a Korean network reach a median 4 markets. The 49 with no broadcaster on record reach 39. They are 17.1% of the titles and 39.4% of the chart places.
The table this is written from: /two-pipelines
There are two ways a Korean series ends up in a Netflix top 10. It aired on a Korean television network — SBS, tvN, KBS, MBC — and was licensed on afterwards. Or it never had a broadcast run at all, and streaming was the only place it ever played.
We had the credits to split the charting series on that line, so we did. The two halves do not behave like the same business.
Four markets, or thirty-nine
| Aired on a Korean network | No broadcaster on record | |
|---|---|---|
| Series | 238 | 49 |
| Markets reached, median | 4 | 39 |
| Chart places held, median | 12 | 83 |
| Charted in exactly one market | 79 | 1 |
| Reached 20 markets or more | 45 | 37 |
The median series that aired in Korea first reached four countries. The median series that did not reached thirty-nine. Seventy-nine of the network series charted in one country and never travelled anywhere else; one of the forty-nine did.
That is not a small difference at the edges. It is a different distribution.
The network route is not the losing one
The obvious misreading is that broadcast is finished and streaming won. The numbers say something narrower and more useful.
The 238 network series hold 14,847 chart places — 60.6% of everything Korean series took across 93 markets. The 49 hold 9,668. There are nearly five times as many network series, each travelling much less far, and between them they still account for the larger share of the chart.
Two businesses, both working, with different shapes. One puts a great many titles into a few markets each. The other puts a few titles into most of the world.
What we are actually measuring
We are reading “Wikidata records no first broadcaster” as “it never aired on a Korean network”. That is a proxy and we want to be plain about it.
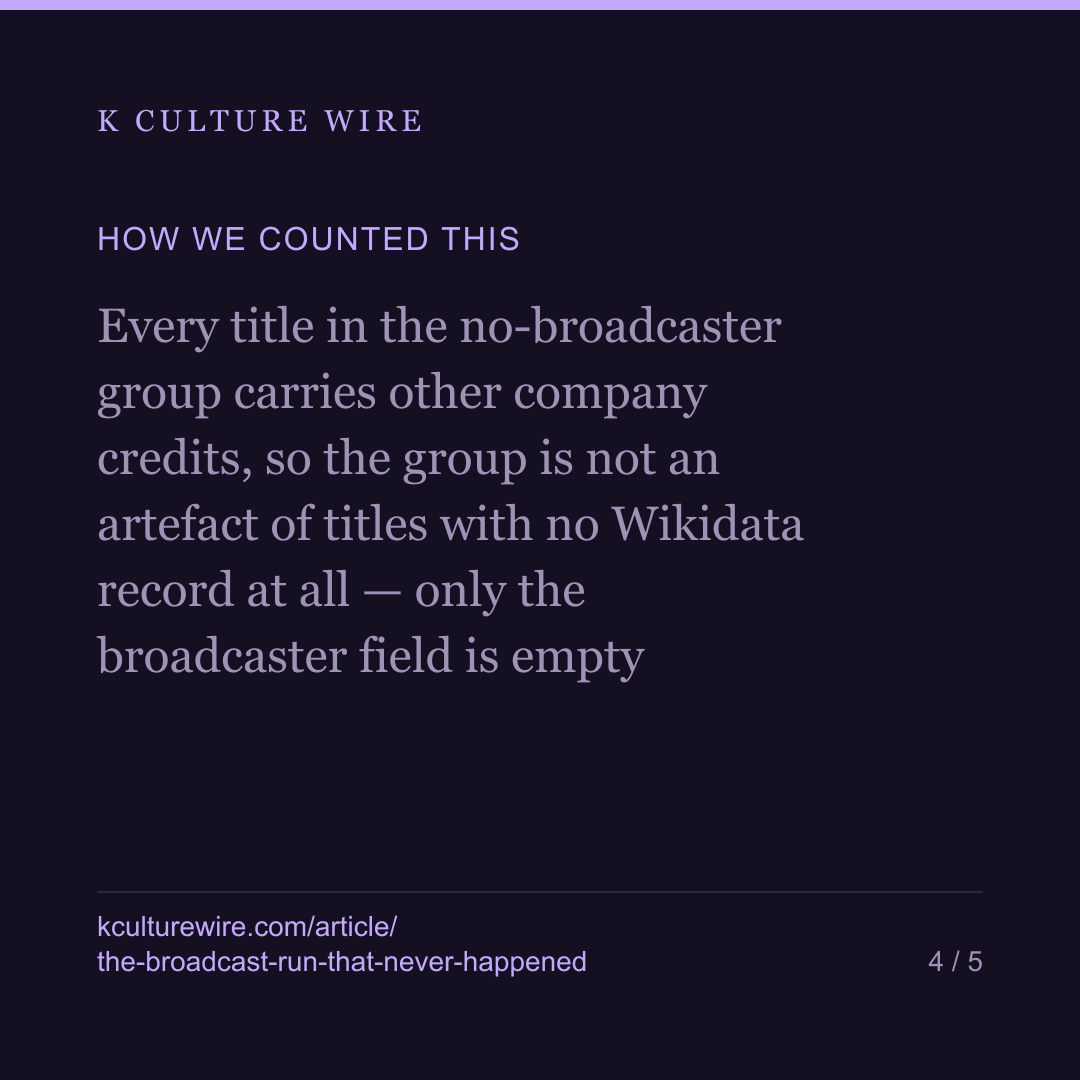
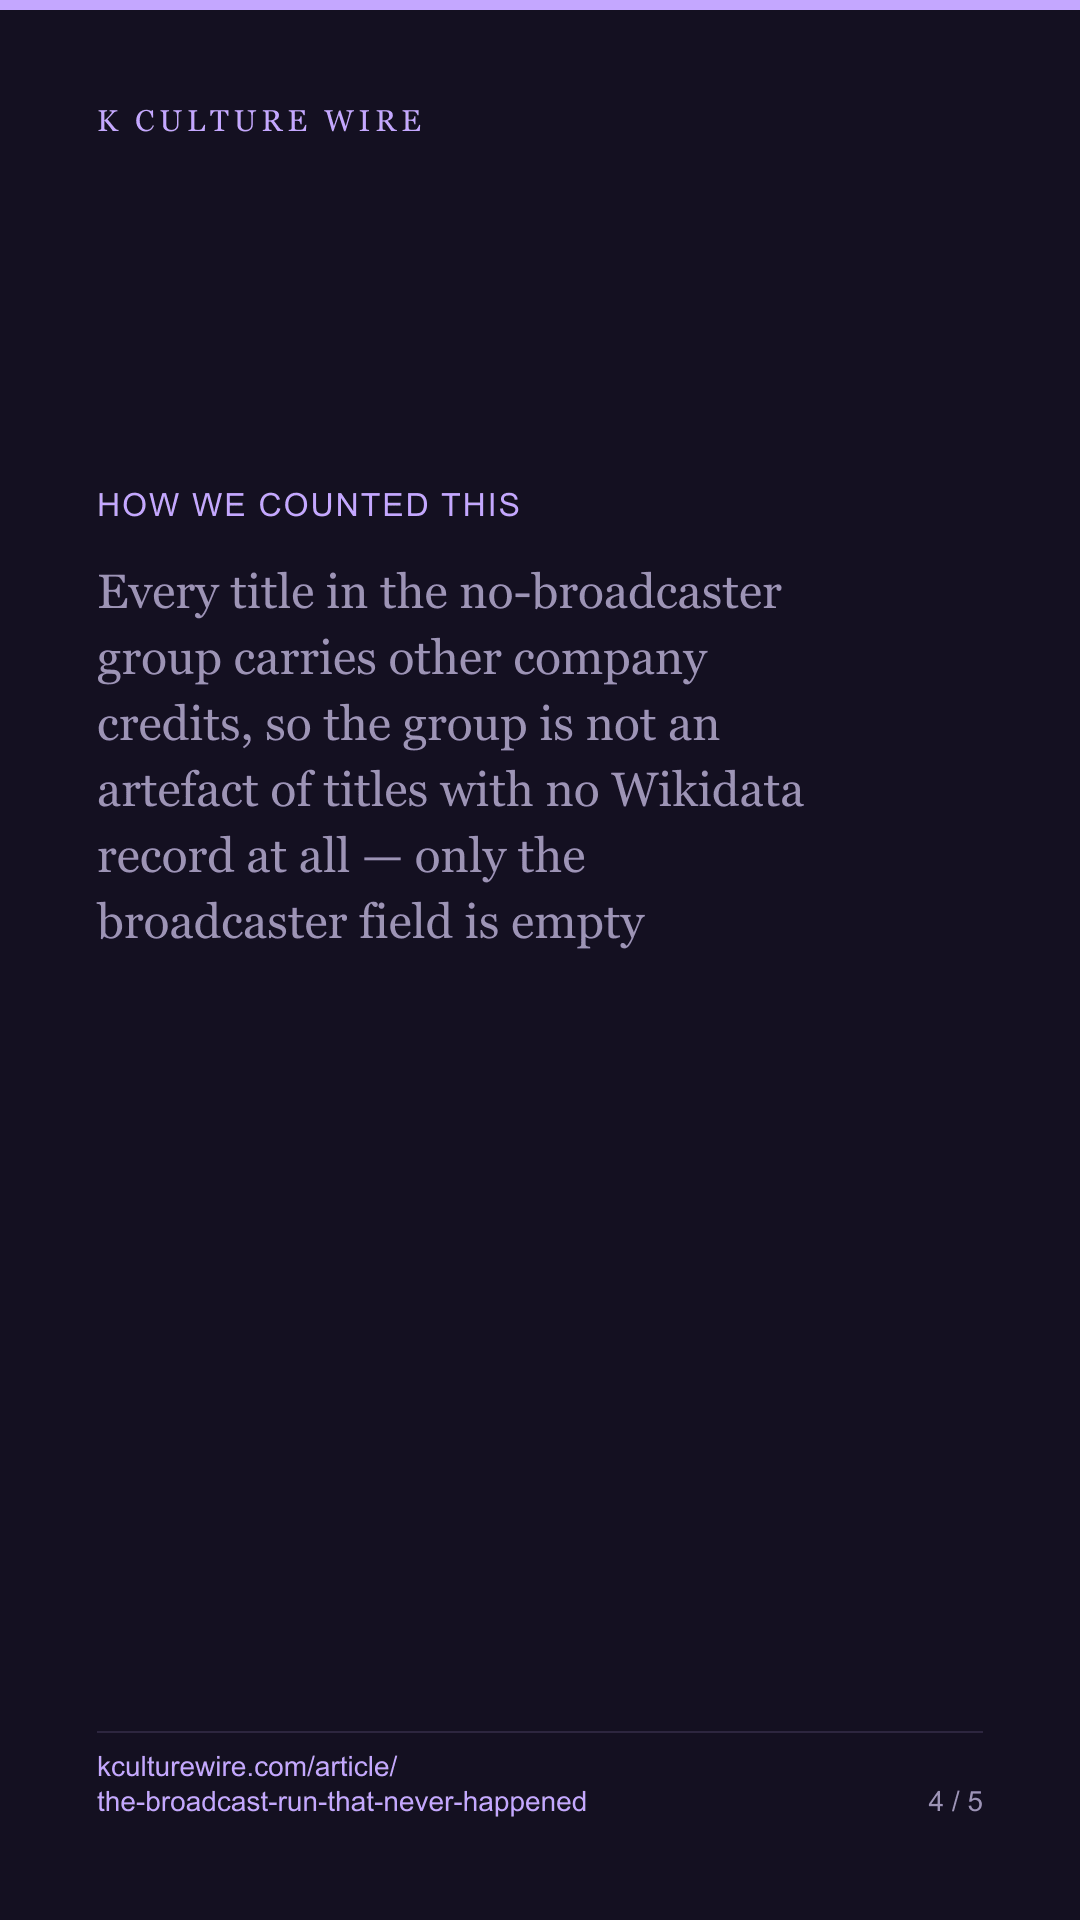
Two things support it. Every title in that group carries other company credits — production companies, distributors — so the record is not blank; only the broadcaster field is. And the group is recognisable on sight. These are the ones that reached 60 markets or more, alphabetically:
All of Us Are Dead, Bloodhounds, Gyeongseong Creature, Hellbound, If Wishes Could Kill, Mask Girl, Mercy For None, Money Heist: Korea - Joint Economic Area, Oasis, Squid Game, The 8 Show, The Art of Sarah, The Glory, The Trauma Code: Heroes on Call, The WONDERfools.
That is the made-for-streaming slate, and it is why we are willing to use the proxy. It is also why we are printing the list rather than describing it: anyone who thinks the proxy is wrong can see exactly what it caught.
Films go the other way
Run the same split on films and the direction reverses — 3 markets for those with a broadcaster credit against 1 for those without, on much smaller medians either way.
So this is a fact about Korean series, not a fact about streaming, and we are not going to write it as one. A film’s broadcast history is a weaker signal in any case: films reach television after cinemas, if they reach it at all, and a missing broadcaster says less.
What this cannot tell you
It cannot tell you why. A streamer that promotes its own commissions in every market on the same day would produce exactly this shape. So would a genuine difference in what the two pipelines choose to make. Netflix publishes neither its promotion budgets nor its commissioning decisions, so we can describe two footprints and not explain them, and anyone who tells you which mechanism is at work is telling you something this data does not hold.
It also rests on the 77.2% of charting Korean series that carry any company credit at all — 287 of 372. A series whose credits Wikidata does not hold is absent from this comparison rather than counted as either kind.
Why it matters to anyone buying
Because “a Korean series” is not one product. If you are looking at a title with a Korean broadcast run behind it, the base case from five years of charts is a handful of markets, most likely nearby ones. If you are looking at one made for streaming, the base case is most of the world. Those two cases justify very different prices, and a single average across both would misprice both.
The full table, the number-one rates, the film comparison and the coverage limit on all of it: the two pipelines. The company-level view — how far a catalogue travels as it grows — is at catalogue reach.
Where these numbers come from
Sources
- Netflix — Tudum weekly Top 10 country lists, 2021-07-04 to 2026-07-26, used to count the markets and places each series reached · https://www.netflix.com/tudum/top10
- Wikidata — Original broadcaster (P449), production company (P272) and distributor (P750) on Korean titles, retrieved by item number rather than by name · https://query.wikidata.org
What we checked
- Every title in the no-broadcaster group carries other company credits, so the group is not an artefact of titles with no Wikidata record at all — only the broadcaster field is empty
- The same split was run on films, where the direction reverses, so the finding is reported as a fact about series rather than about streaming
- Chart places are reported beside medians, because the network group holds the larger share of them and a median alone would hide that
- The list of no-broadcaster titles reaching 60 markets or more is printed in full and alphabetically, so the proxy can be judged rather than taken on trust
What we left out, and why
- Any claim about why the two groups differ. A streamer promoting its own titles everywhere at once would produce this shape, and so would a difference in what each pipeline commissions; Netflix publishes neither
- The 85 charting Korean series with no company credit in Wikidata at all. They are absent from this comparison, not counted as either kind
The data behind this
Written from the same data
Take this away — 10 cards
The figures in this article, as images. Free to repost with the address on them.

If you work in this business
Everything on this page is measured from the same weekly Netflix lists, per market and per title. We publish the pages free; what we sell is the same measurement cut to one company's catalogue — including the figures behind /two-pipelines.
What a company sheet contains, and what it cannot tell you →