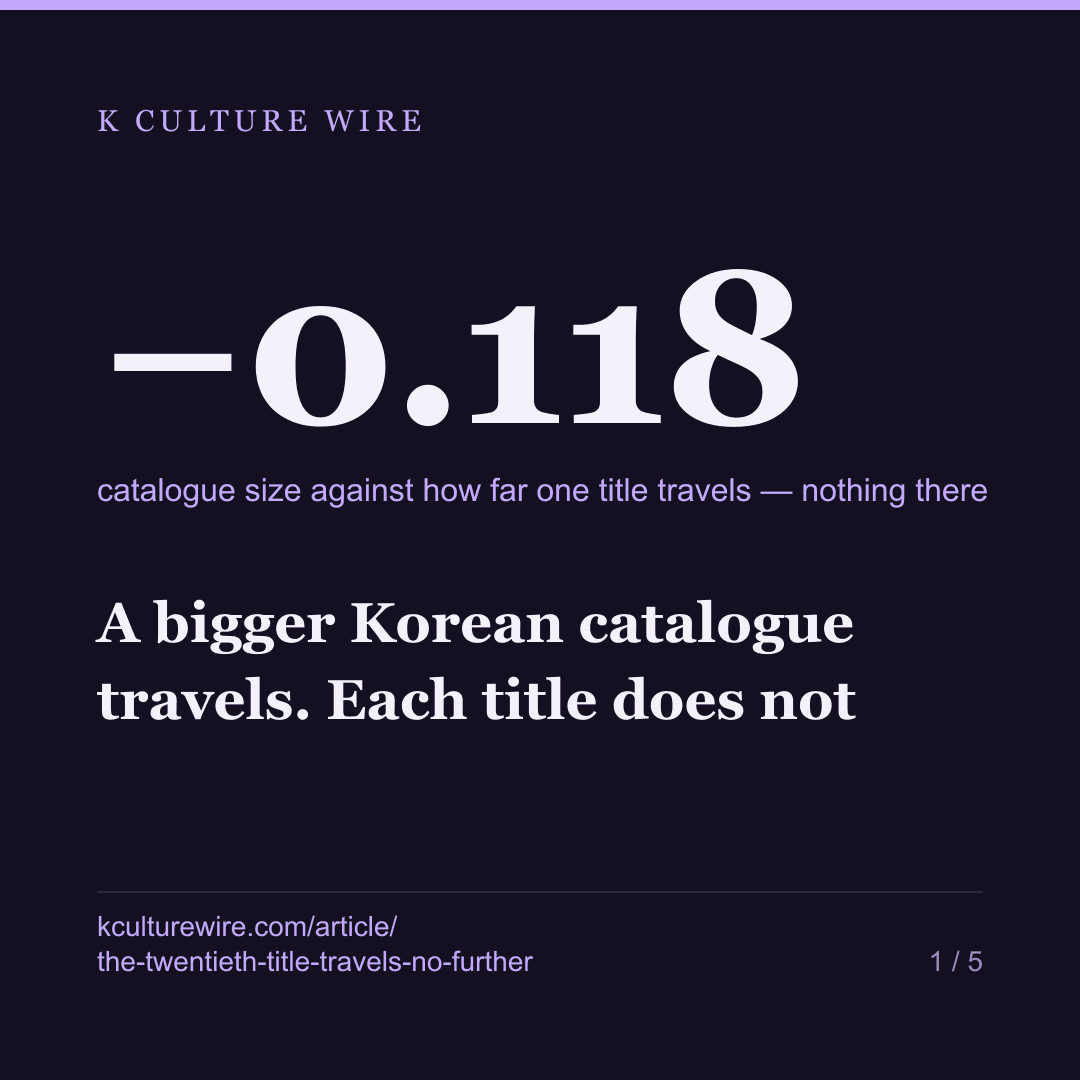
A bigger Korean catalogue travels. Each title does not
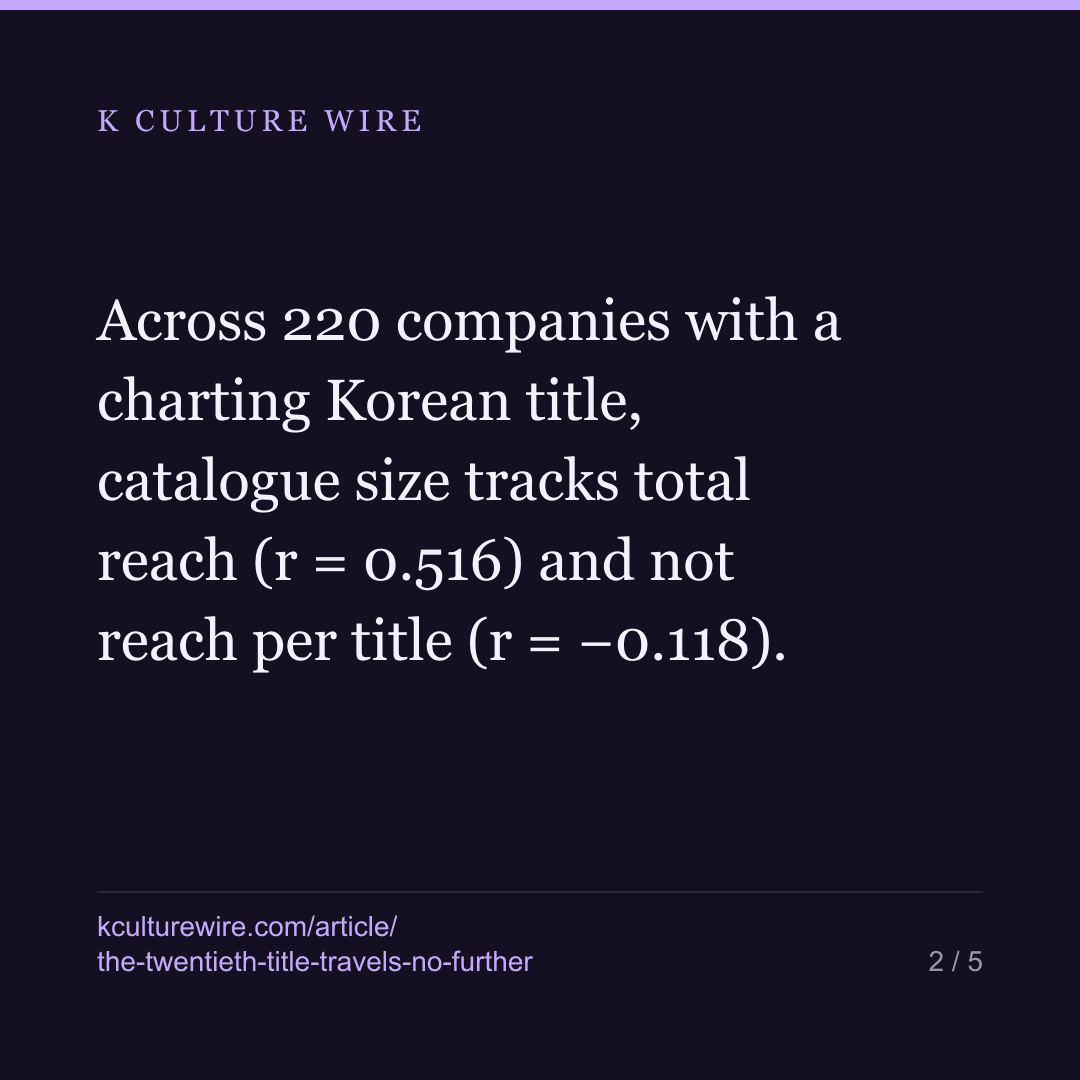
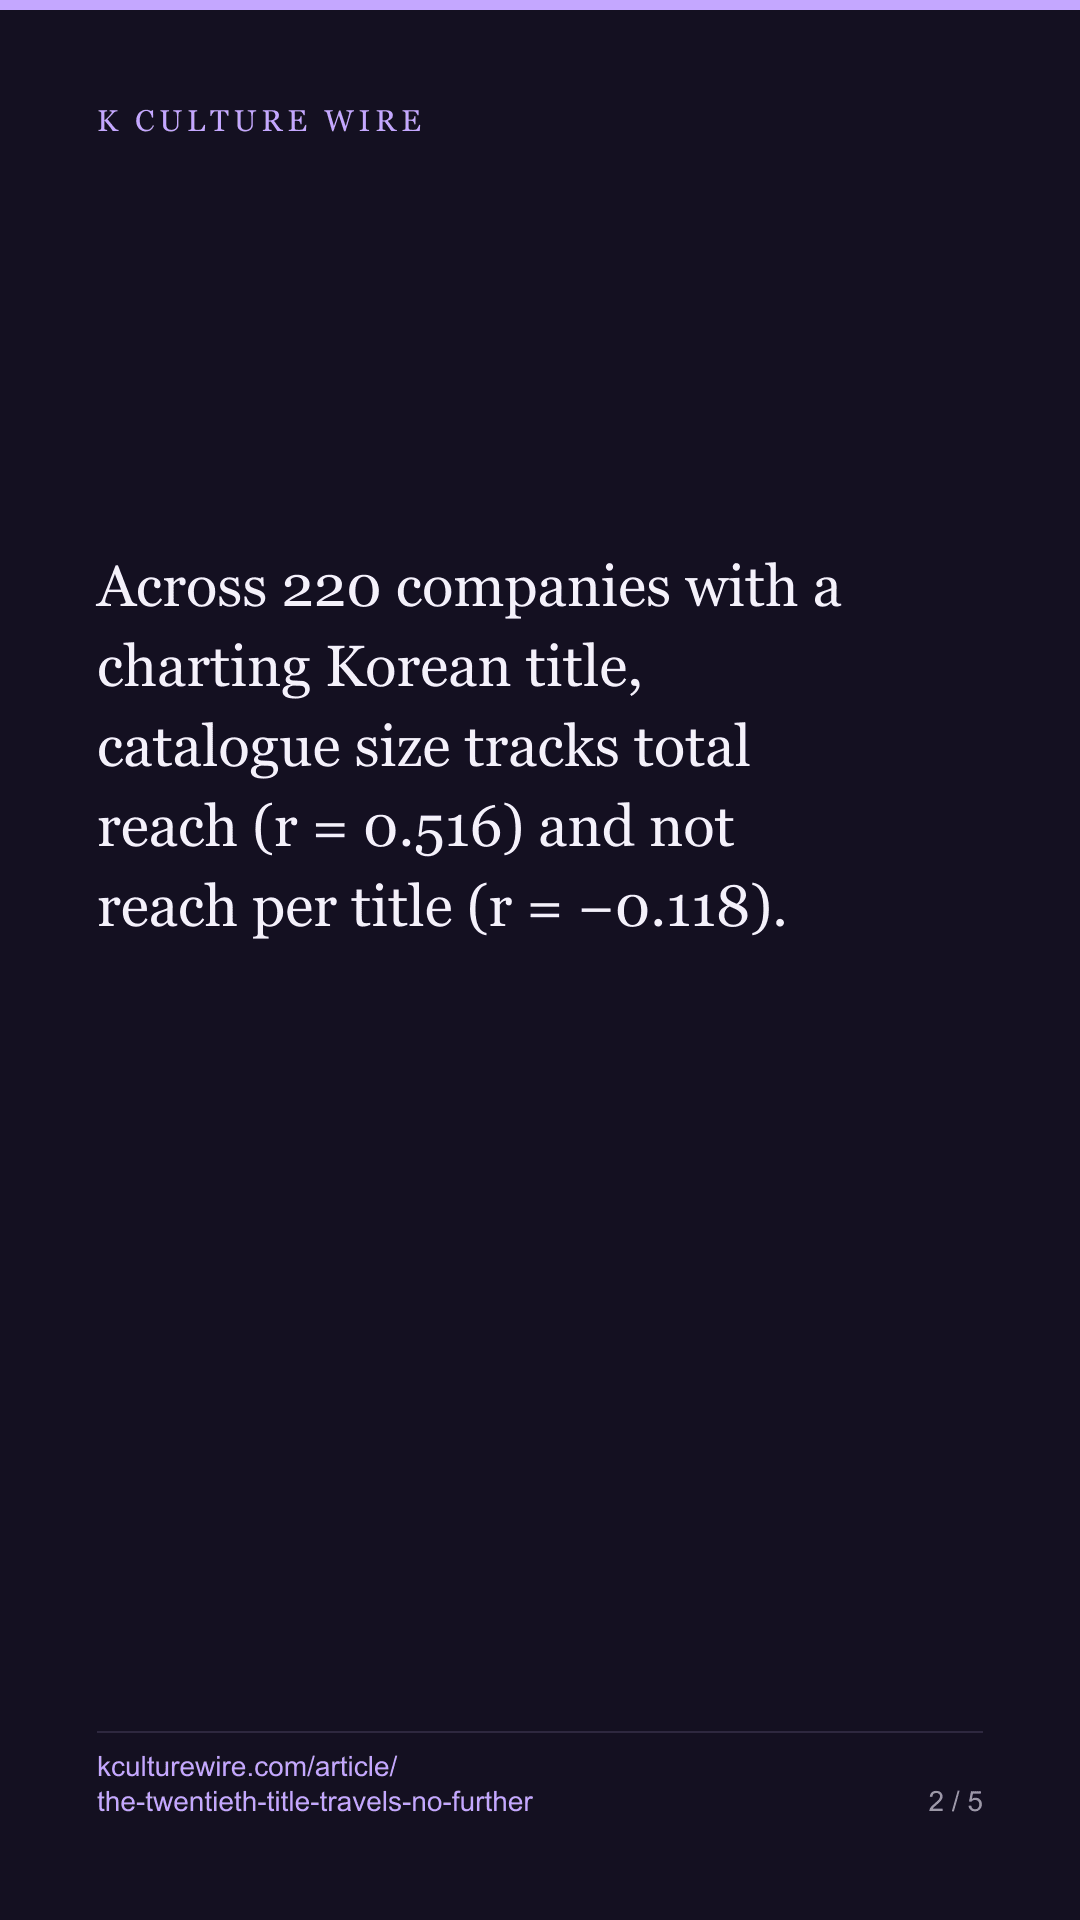
Across 220 companies with a charting Korean title, catalogue size tracks total reach (r = 0.516) and not reach per title (r = −0.118). Firms with 20 or more titles get 11.1 markets from the median title; firms with two get 13.5.
The table this is written from: /catalogue-reach
We sell a page called a title’s journey: where a Korean title went, market by market. The obvious question from anyone buying it is whether they need it. If a company knows it has twenty charting titles, can it work out how far they travel without looking?
It cannot. That turns out to be the finding.
Two numbers that behave differently
Take the 220 companies with at least one Korean title that reached a Netflix country top 10, and measure two things about each: how many markets its titles reached between them, and how many markets the average one of its titles reached on its own.
| Catalogue size against… | Correlation |
|---|---|
| Total markets the catalogue reached | 0.516 |
| Markets per title | −0.118 |
The first is close to unavoidable. Put more titles into more charts and the union of the countries you have touched gets larger; it would be strange if it did not.
The second is the one worth stopping at. Across the 106 companies with two or more charting titles, knowing how big a catalogue is tells you essentially nothing about how far any single title in it goes — and the faint lean it does have points down, not up.
The table it comes from
| Charting titles | Companies | Markets per title (median) | Markets per title (mean) | Total markets (median) |
|---|---|---|---|---|
| 2 titles | 31 | 13.5 | 18 | 23 |
| 3–4 titles | 35 | 9.7 | 14.6 | 23 |
| 5–9 titles | 21 | 8.3 | 11.8 | 35 |
| 10–19 titles | 7 | 10.1 | 17.7 | 61 |
| 20 or more | 12 | 11.1 | 11.7 | 81 |
Read down the last column and a catalogue is clearly working: 19.5 markets to 73. Read down the median per-title column and nothing is happening at all. A company with twenty-plus charting titles gets 13 markets out of its middle title. A company with two gets 10.8.
Where the median and the mean disagree
The two per-title columns move in different directions, and that gap says something the medians alone do not. The mean falls steadily — 17.8 down to 12.1 — while the median stays flat.
That is what a thinning tail looks like. Among the small companies there are a few whose one or two charting titles travelled unusually far, and in a group of 28 those outliers drag the mean upward hard. Among the eleven largest catalogues, no single title is big enough relative to the rest to do that.
A big catalogue is not a catalogue of big titles. It is a catalogue with fewer surprises in it.
The one-title companies, and why they are not in the bands
There are 114 companies here with exactly one charting title — more than half of everybody. Their median title reached 2 markets. Thirty-nine of them reached exactly one market. One of them reached 87.
It is tempting to put that 2 next to the 13.5 above and conclude that a second title is worth seven markets. We are not going to, and the reason matters more than the number.
A company only appears in this table once something of its own has charted. A company with two charting titles has therefore already done something the one-title companies have not, and we cannot tell how much of the gap is the second title and how much is which companies got to have one. So the flat line starts at two, and the 111 sit outside it with their own row.
Our own grades say the same thing by accident
We grade companies by how much of their catalogue we can see. Grade A companies hold 25 charting titles at the median against 6 for grade B, and reach 72 markets against 35.
Per title, grade A is at 10.7 and grade B is at 8.3.
The grades measure how much of a company is visible to us. They do not measure how far it travels, and it is worth saying so plainly on a page where the temptation to treat our own A as a quality mark would be very easy to give in to.
What this cannot tell you
Reach counts countries, not people. A title that charted for a single week in 40 markets and a title that led 40 markets for a year both count as 40 here, and we have not tried to weight them, because Netflix does not publish enough weeks of hours to do it honestly.
Nor does any of this explain why a catalogue travels. Budget, cast, release timing, the shape of the licensing deal — none of it is in this data, and a company that reads a low per-title number as a verdict on its work is reading something we did not measure.
And every figure above rests on the 63.3% of Korean titles that carry a company credit at all: 598 of the 945 we hold. A company whose titles sit in the missing 36.7% is absent from this table, not small in it.
Why we bothered
Because the answer decides whether our own product is worth anything. If per-title reach rose with catalogue size, a company could estimate its journey from its size and would not need the page. It does not rise. The distance a title travels has to be looked up, one title at a time.
The full table, both charts, the grade breakdown and the coverage limit on all of it: does a bigger catalogue travel further. The companion piece — how few companies fill half of what charts — is at who makes it.
Where these numbers come from
Sources
- Netflix — Tudum weekly Top 10 country lists, 2021-07-04 to 2026-07-26, used to count the markets each title reached · https://www.netflix.com/tudum/top10
- Wikidata — Production company (P272), original broadcaster (P449) and distributor (P750) on Korean titles, retrieved by item number rather than by name · https://query.wikidata.org
What we checked
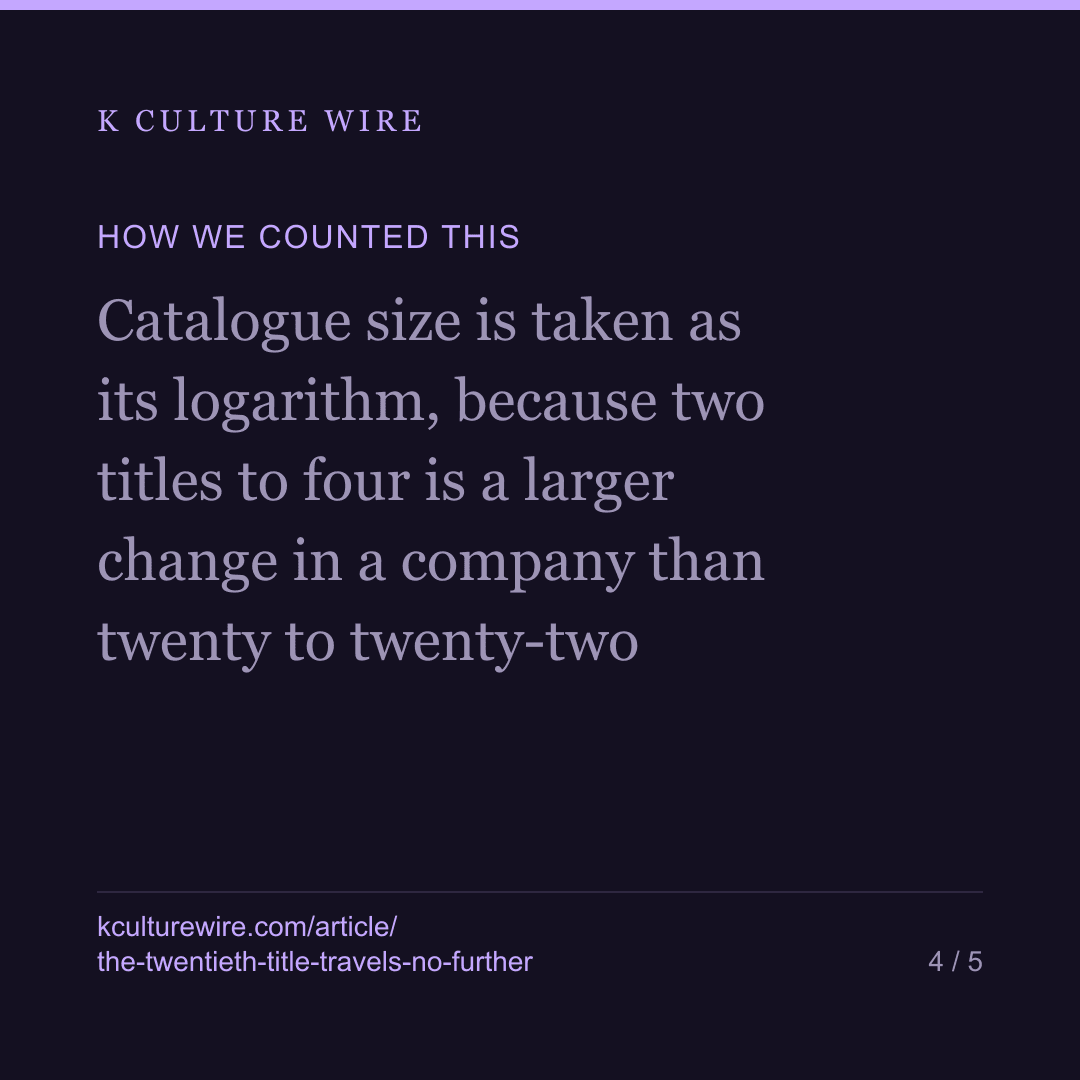
- Catalogue size is taken as its logarithm, because two titles to four is a larger change in a company than twenty to twenty-two
- Median and mean per-title reach are both reported, because they disagree, and the disagreement is itself one of the findings
- Companies with exactly one charting title are held out of the bands, because a company only enters this table once something of its own has charted and the step from one to two is entangled with which companies get to take it
- Every figure is measured on the 59.4% of titles that carry a company credit at all, and that share is printed beside the result rather than in a footnote
The data behind this
Written from the same data
Take this away — 10 cards
The figures in this article, as images. Free to repost with the address on them.





If you work in this business
Everything on this page is measured from the same weekly Netflix lists, per market and per title. We publish the pages free; what we sell is the same measurement cut to one company's catalogue — including the figures behind /catalogue-reach.
What a company sheet contains, and what it cannot tell you →