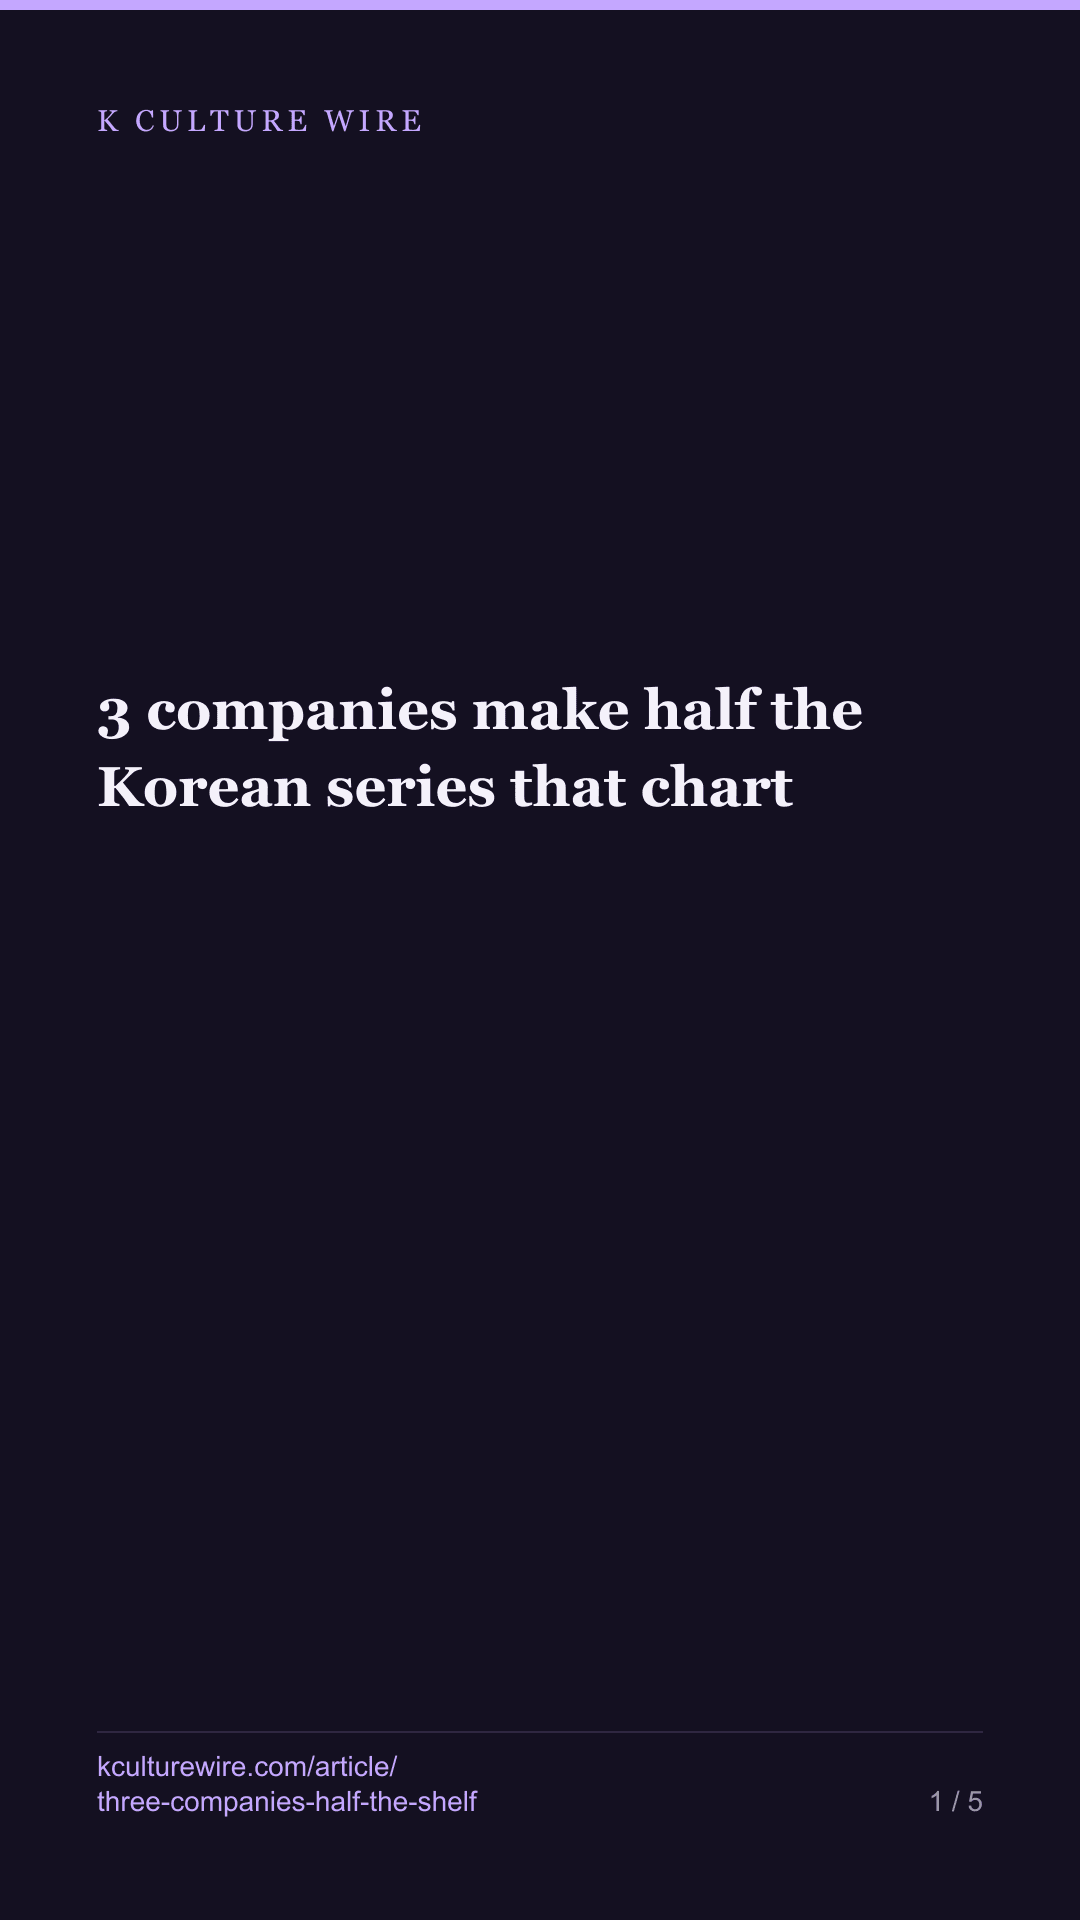
3 companies make half the Korean series that chart
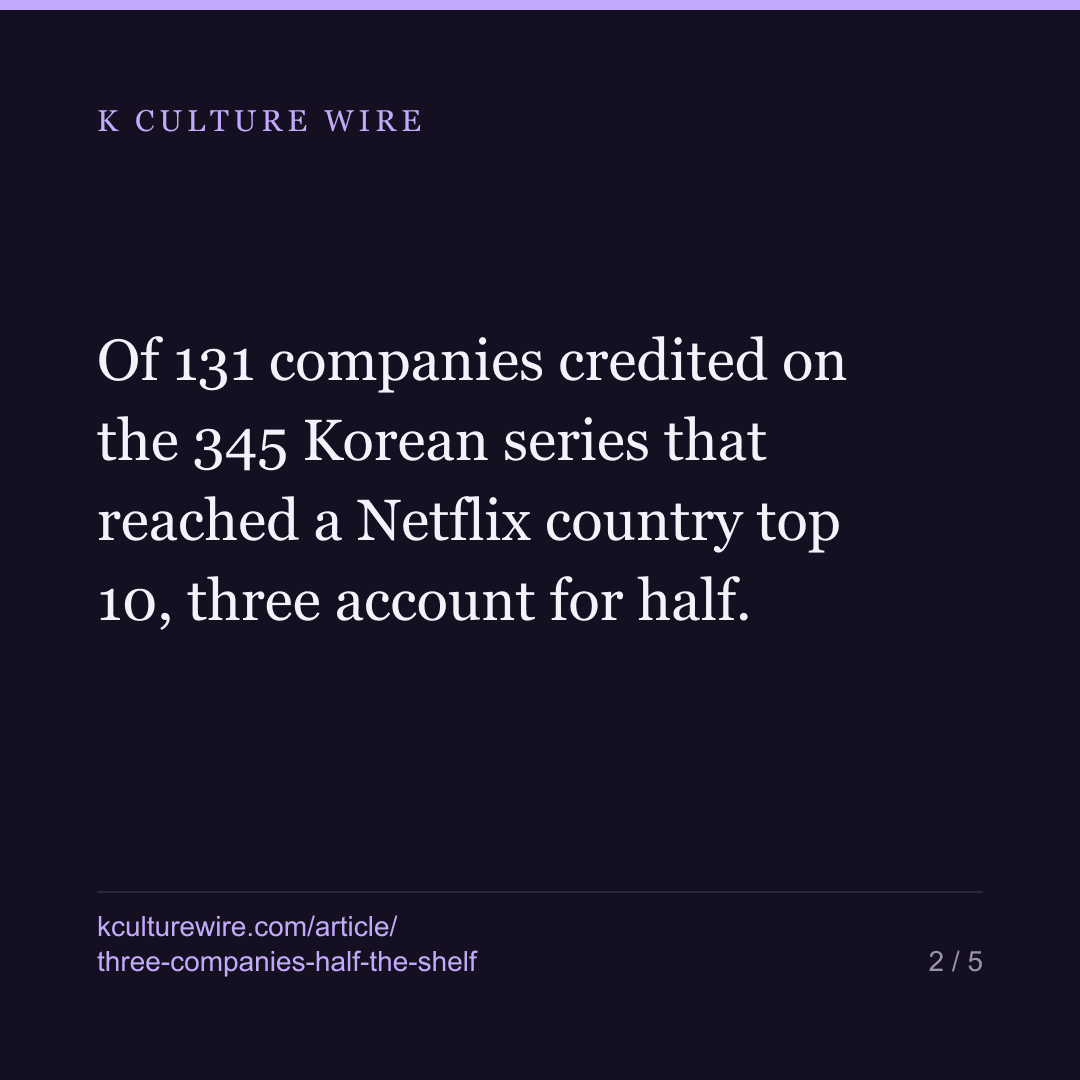
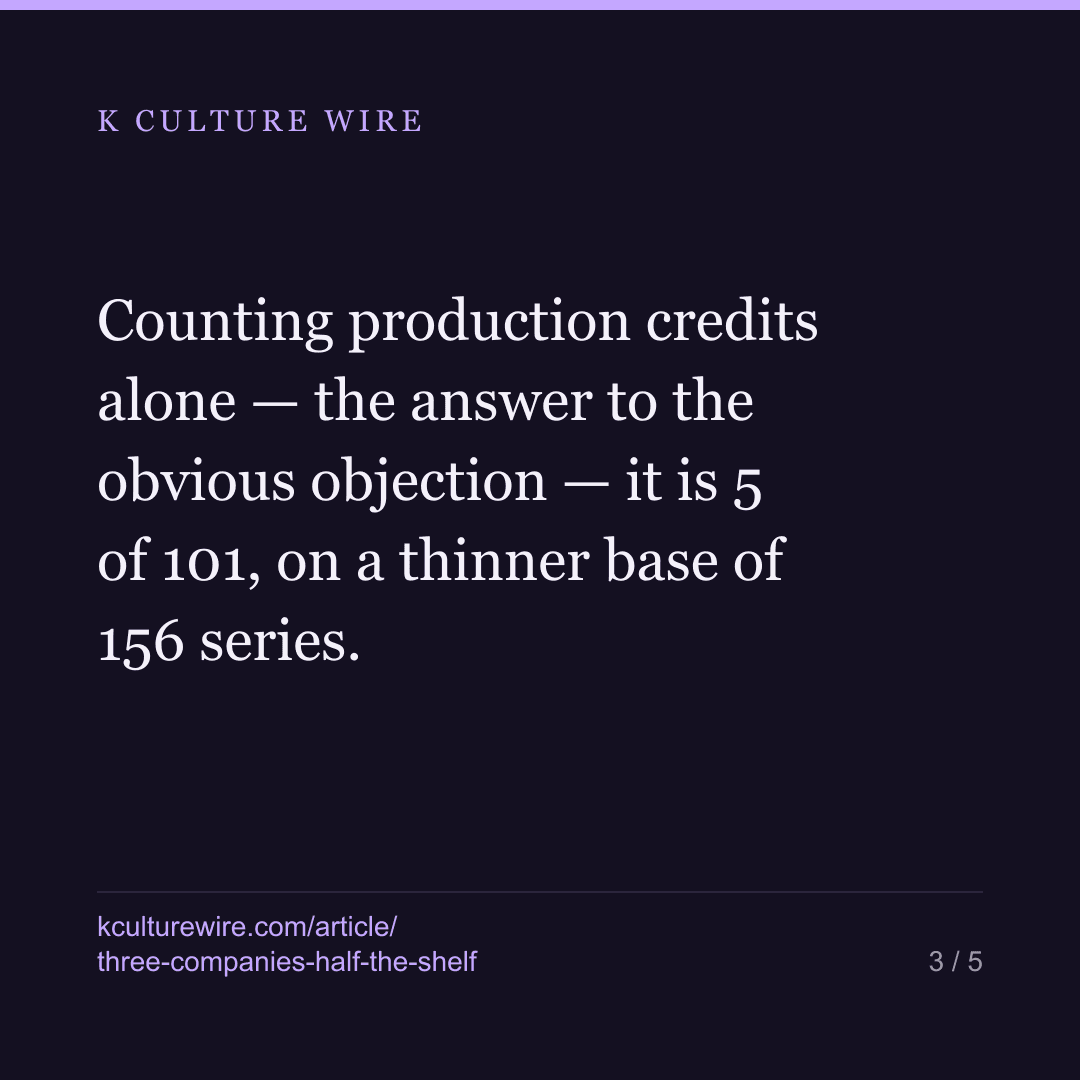
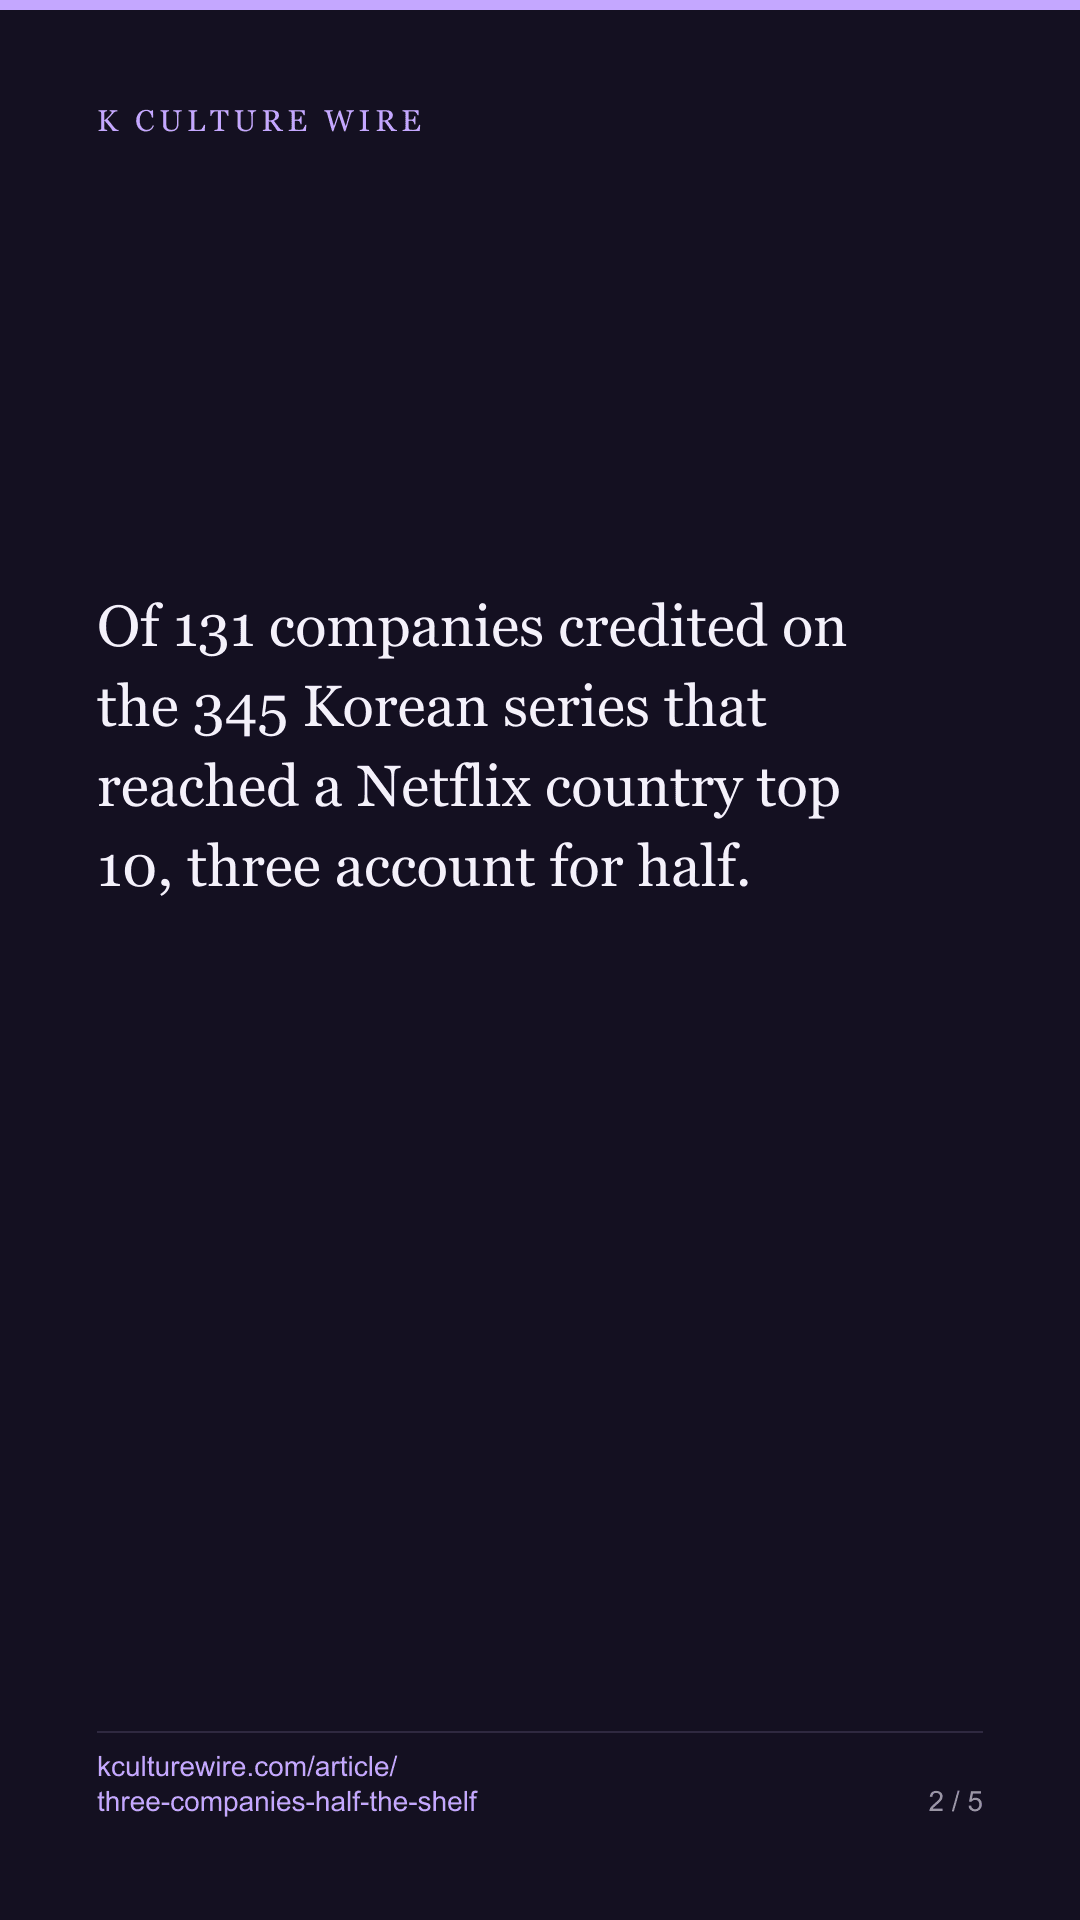
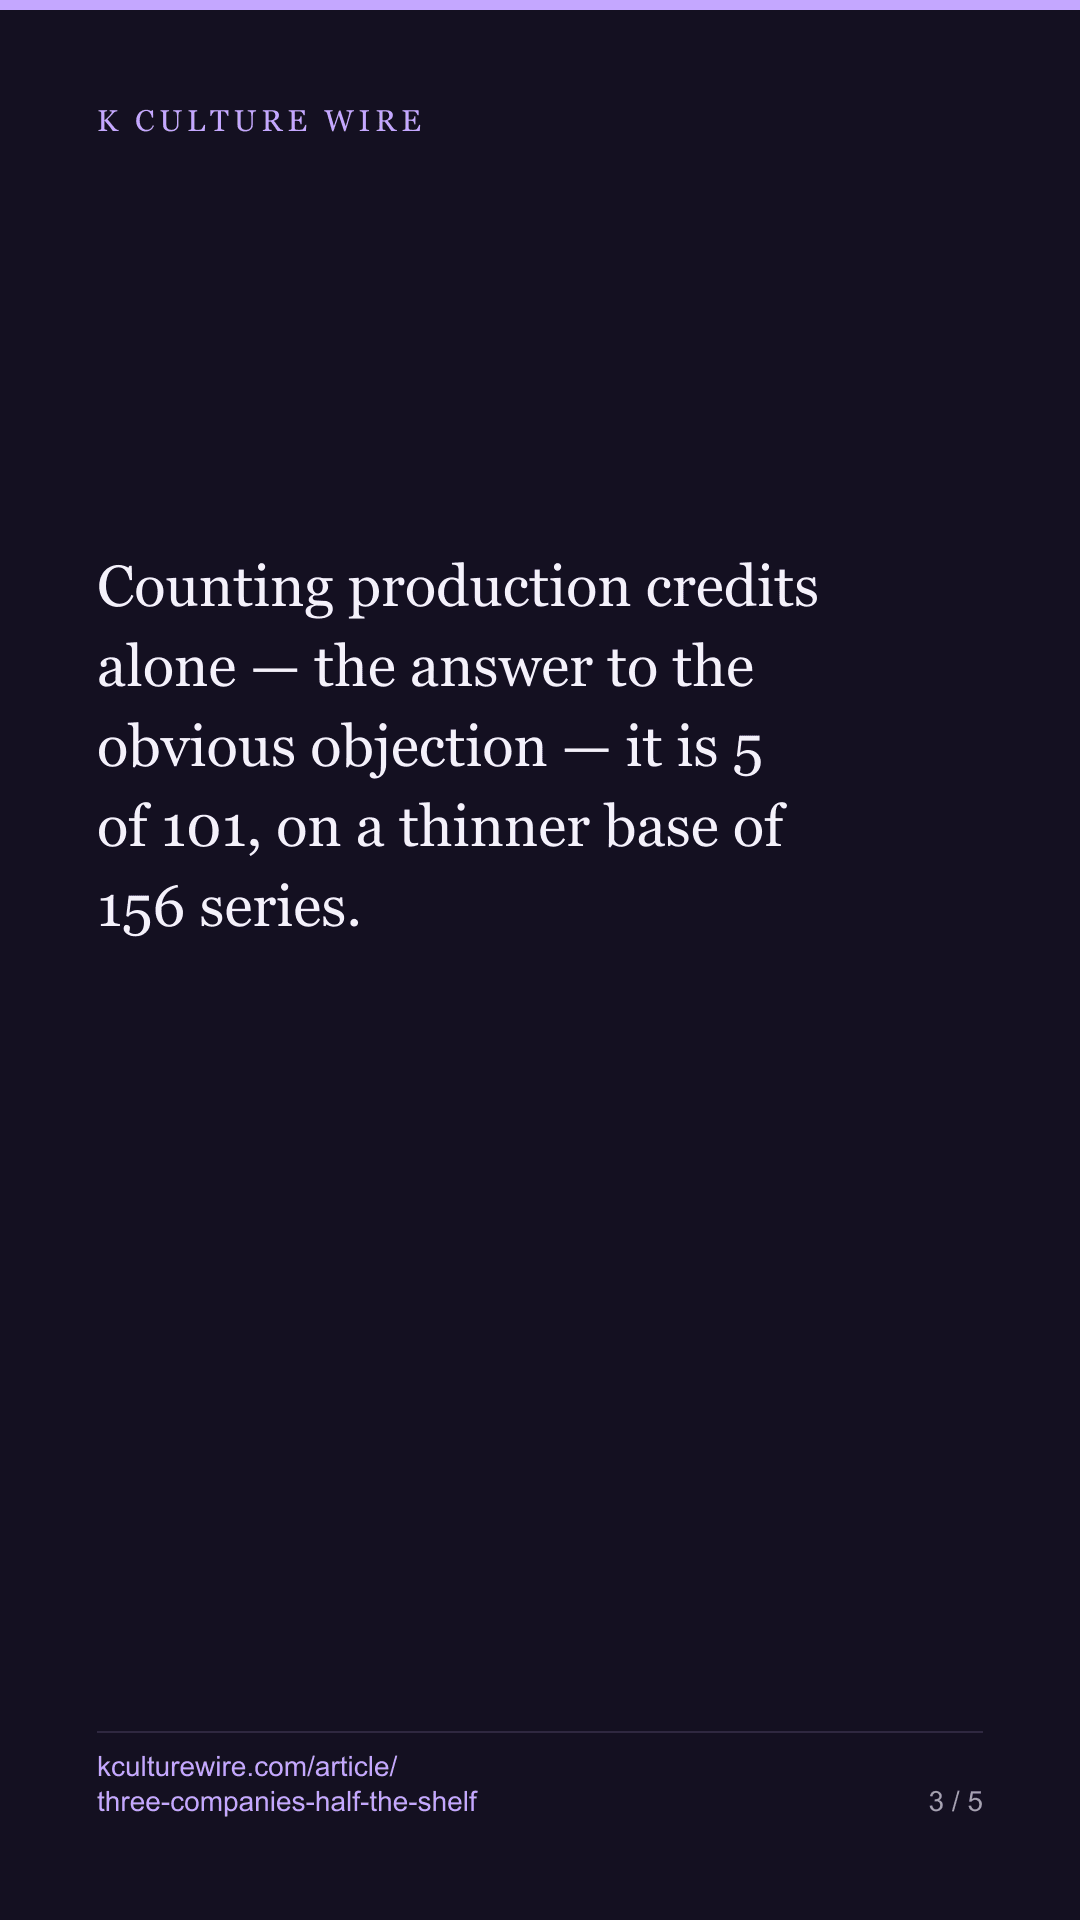
Of 131 companies credited on the 345 Korean series that reached a Netflix country top 10, three account for half. Counting production credits alone — the answer to the obvious objection — it is 5 of 101, on a thinner base of 156 series.
The table this is written from: /who-makes-it
We already publish how few titles fill half of a country’s Korean chart — seven in the United States, 52 in Vietnam. This is the same ruler pointed at the other end of the pipe.
Of the 131 companies credited on the 345 Korean series that reached a Netflix country top 10 between 2021 and 2026, three account for half of them.
| Credit counted | Companies | Series they cover | Companies for half |
|---|---|---|---|
| Any credit | 131 | 345 (92.2%) | 3 |
| Production company | 101 | 156 (41.7%) | 5 |
| First broadcaster | 28 | 303 (81%) | 3 |
| Distributor | 25 | 139 (37.2%) | 4 |
The objection, which is a good one
A network airs everything it airs. Counting first-broadcaster credits will look concentrated no matter what the industry looks like — 28 broadcasters cover 291 series between them, and that is close to a definition rather than a finding.
So the row that matters is production company: firms Wikidata records as having made the series. Counting only those, 5 companies of 101 still account for half. The objection sharpens the number rather than dissolving it.
That row also rests on the thinnest base in the table. Production credits are attached to 156 series, 41.7% of the 374 that charted. It is at once the most meaningful cut and the least complete one, and both of those are true.
The other end of the same fact
| Series credited to the company | Companies |
|---|---|
| 1 series | 59 |
| 2–4 | 52 |
| 5 or more | 20 |
59 of the 129 companies appear on exactly one charting series. A narrow top and a crowded bottom are not two findings; they are one distribution described from either side.
Why films are not in this table
Companies attach to 92.2% of the series and to 44.5% of the films. Measuring concentration on a half-empty list does not produce a cautious answer — it produces a wrong one, because the companies missing from the data look like small companies rather than like missing data.
So films are left out rather than half-counted. There are 568 of them in our holdings and only 253 carry a company at all. Fixing that needs a source Wikidata does not have; the Korean Film Council’s own database is the obvious one.
What we are not saying
Not that these are the biggest companies, or the best ones. The names on the table behind this piece are in alphabetical order and there is no size column, because the question was how few it takes and not who is on top. Not that companies inside one corporate group are one company — we did not confirm the ownership tree, and merging on a guess would move the answer. And not that this is a census of Korean production: a company whose series never reached a top 10 is simply absent.
The full table, all four credit types, and the coverage figures that limit each of them: who makes it. The market-side ruler this borrows from is at catalogue depth — and note that one counts titles while this counts companies, so the two numbers sit side by side without being comparable.
What changed on 3 September 2026
Recounted against a rebuilt title list. The answer to the question in the headline did not move — three companies still account for half the Korean series that chart — but every figure around it did, by one or two:
| Was | Now | |
|---|---|---|
| Companies credited | 129 | 131 |
| Series they are credited on | 332 | 345 |
| Coverage of series | 92% | 92.2% |
| Production credits alone | 5 of 99, on 151 series | 5 of 101, on 156 series |
| Films in our holdings | 570 | 568 |
| Films with a company attached | 44.4% | 44.5% |
The summary line and the opening paragraph had also been left at 129 companies and 332 series while the table beside them read 131 and 345 — the table was right. A check now reads all of these out of the counted file on each build.
Where these numbers come from
Sources
- Wikidata — Production company (P272), original broadcaster (P449) and distributor (P750) on Korean titles, retrieved by item number rather than by name · https://query.wikidata.org
- Netflix — Tudum weekly Top 10 country lists, 2021-07-04 to 2026-07-26, used to decide which titles charted · https://www.netflix.com/tudum/top10
What we checked
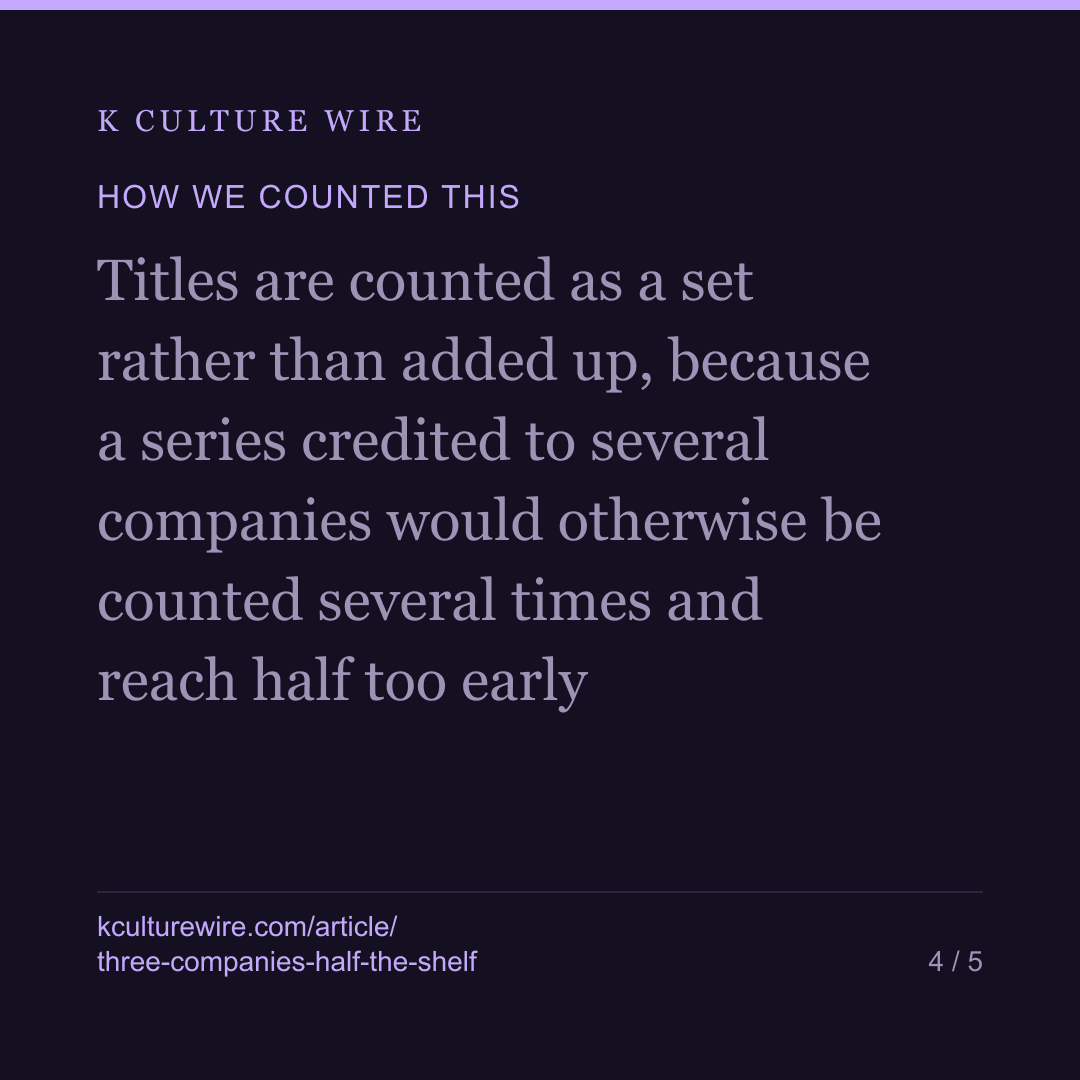
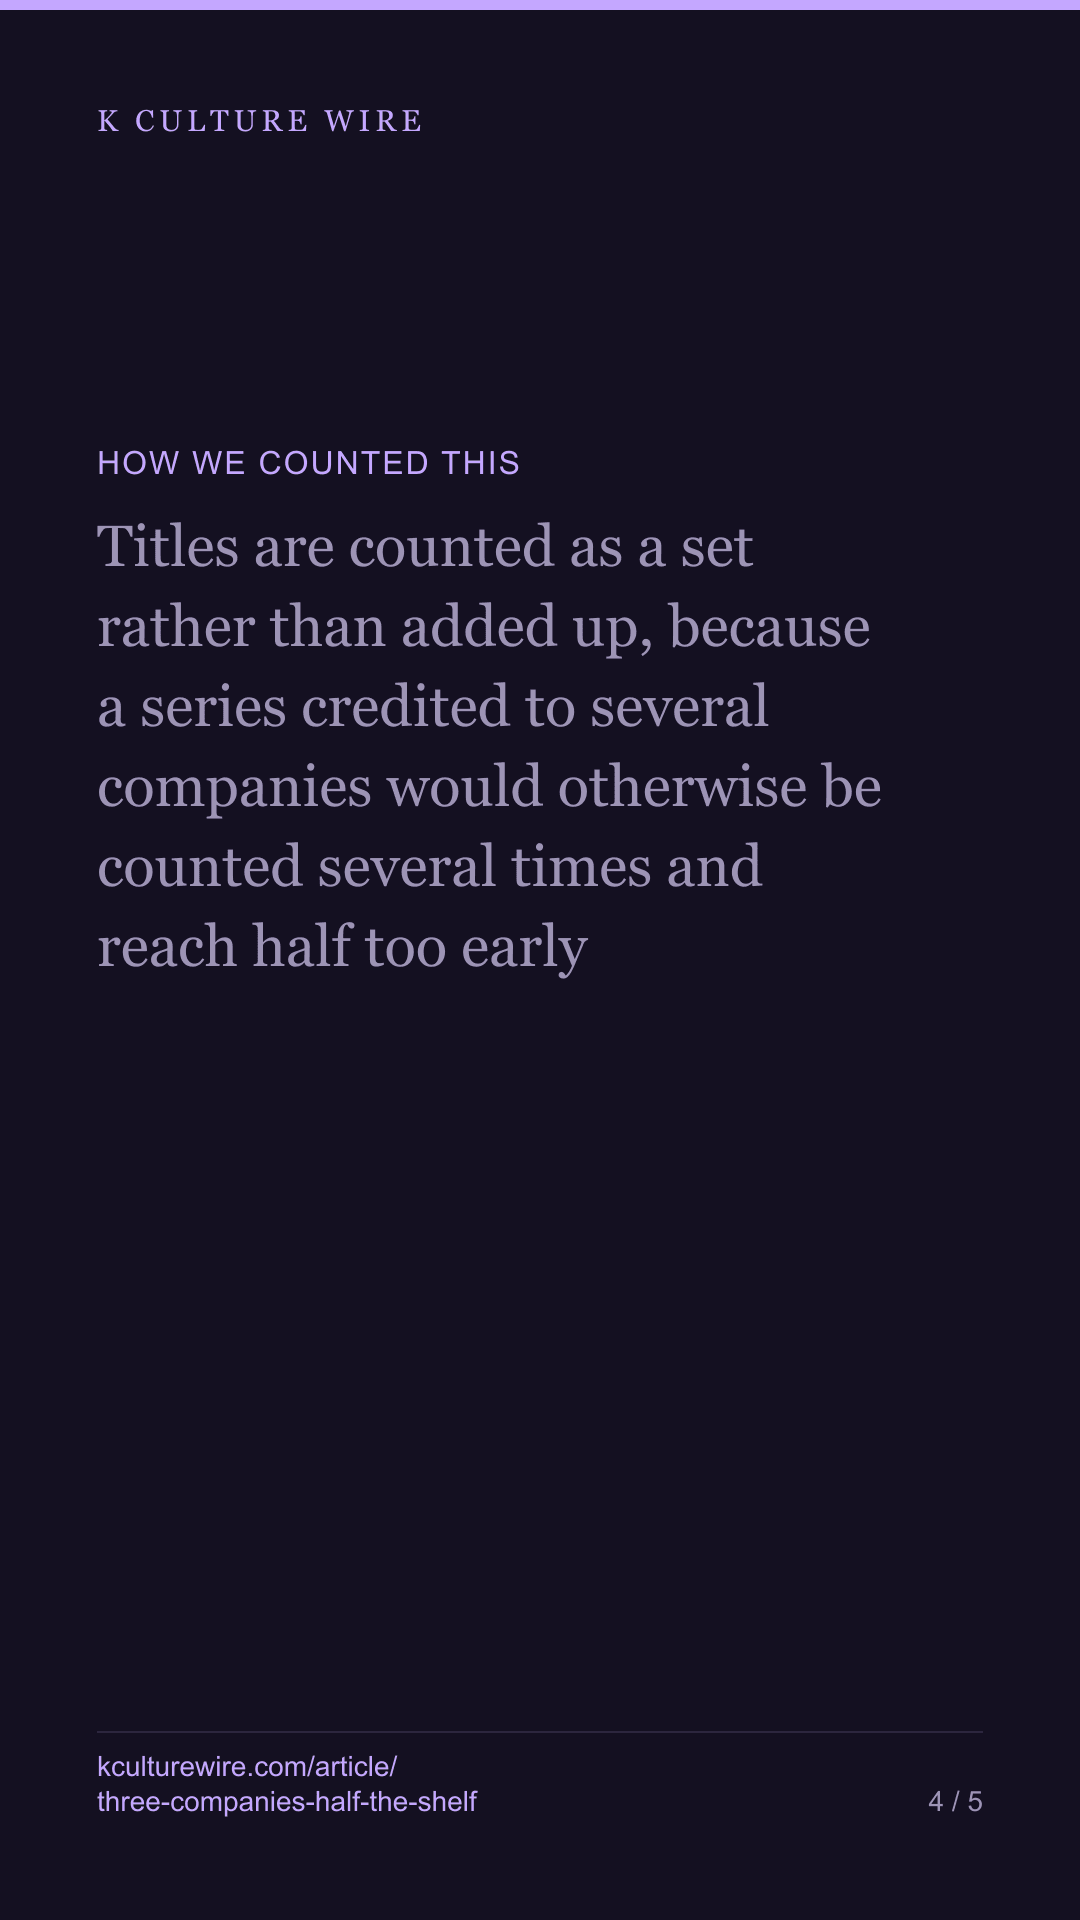
- Titles are counted as a set rather than added up, because a series credited to several companies would otherwise be counted several times and reach half too early
- Every figure is repeated for production, broadcaster and distributor credits separately, so the objection that networks cover everything by definition is answered inside the table rather than argued around
- Films are excluded and the coverage figures for both formats are printed, because companies attach to 92.2% of series and 44.5% of films
- The collector refuses to write its file unless the companies covering half are under a tenth of all companies, since the claim is that the top is narrow
What we left out, and why
- Any ranking of companies. The names are printed alphabetically and the piece reports how few it takes, not who is largest
- Corporate ownership. Companies inside one group are listed separately because we did not confirm the tree, and merging on a guess would change the answer
- Budget or creative share. A Wikidata credit records that a company is attached, not how much of the work it held
- Any census claim. Only titles that reached a country top 10 are here, so a company whose series never charted is absent
The data behind this
Written from the same data
Take this away — 10 cards
The figures in this article, as images. Free to repost with the address on them.
If you work in this business
Everything on this page is measured from the same weekly Netflix lists, per market and per title. We publish the pages free; what we sell is the same measurement cut to one company's catalogue — including the figures behind /who-makes-it.
What a company sheet contains, and what it cannot tell you →