A Korean title charts in all 6 countries, or in 1
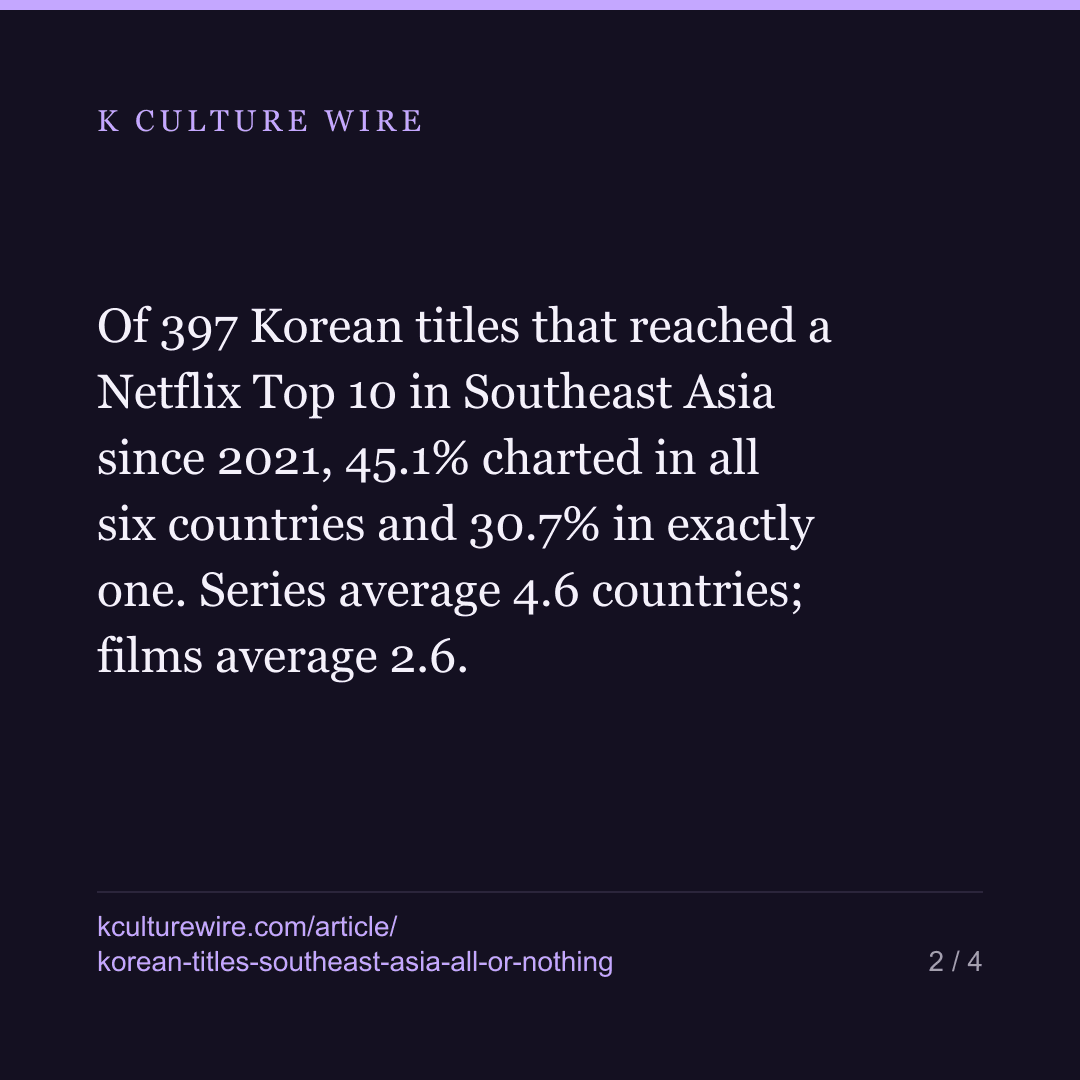
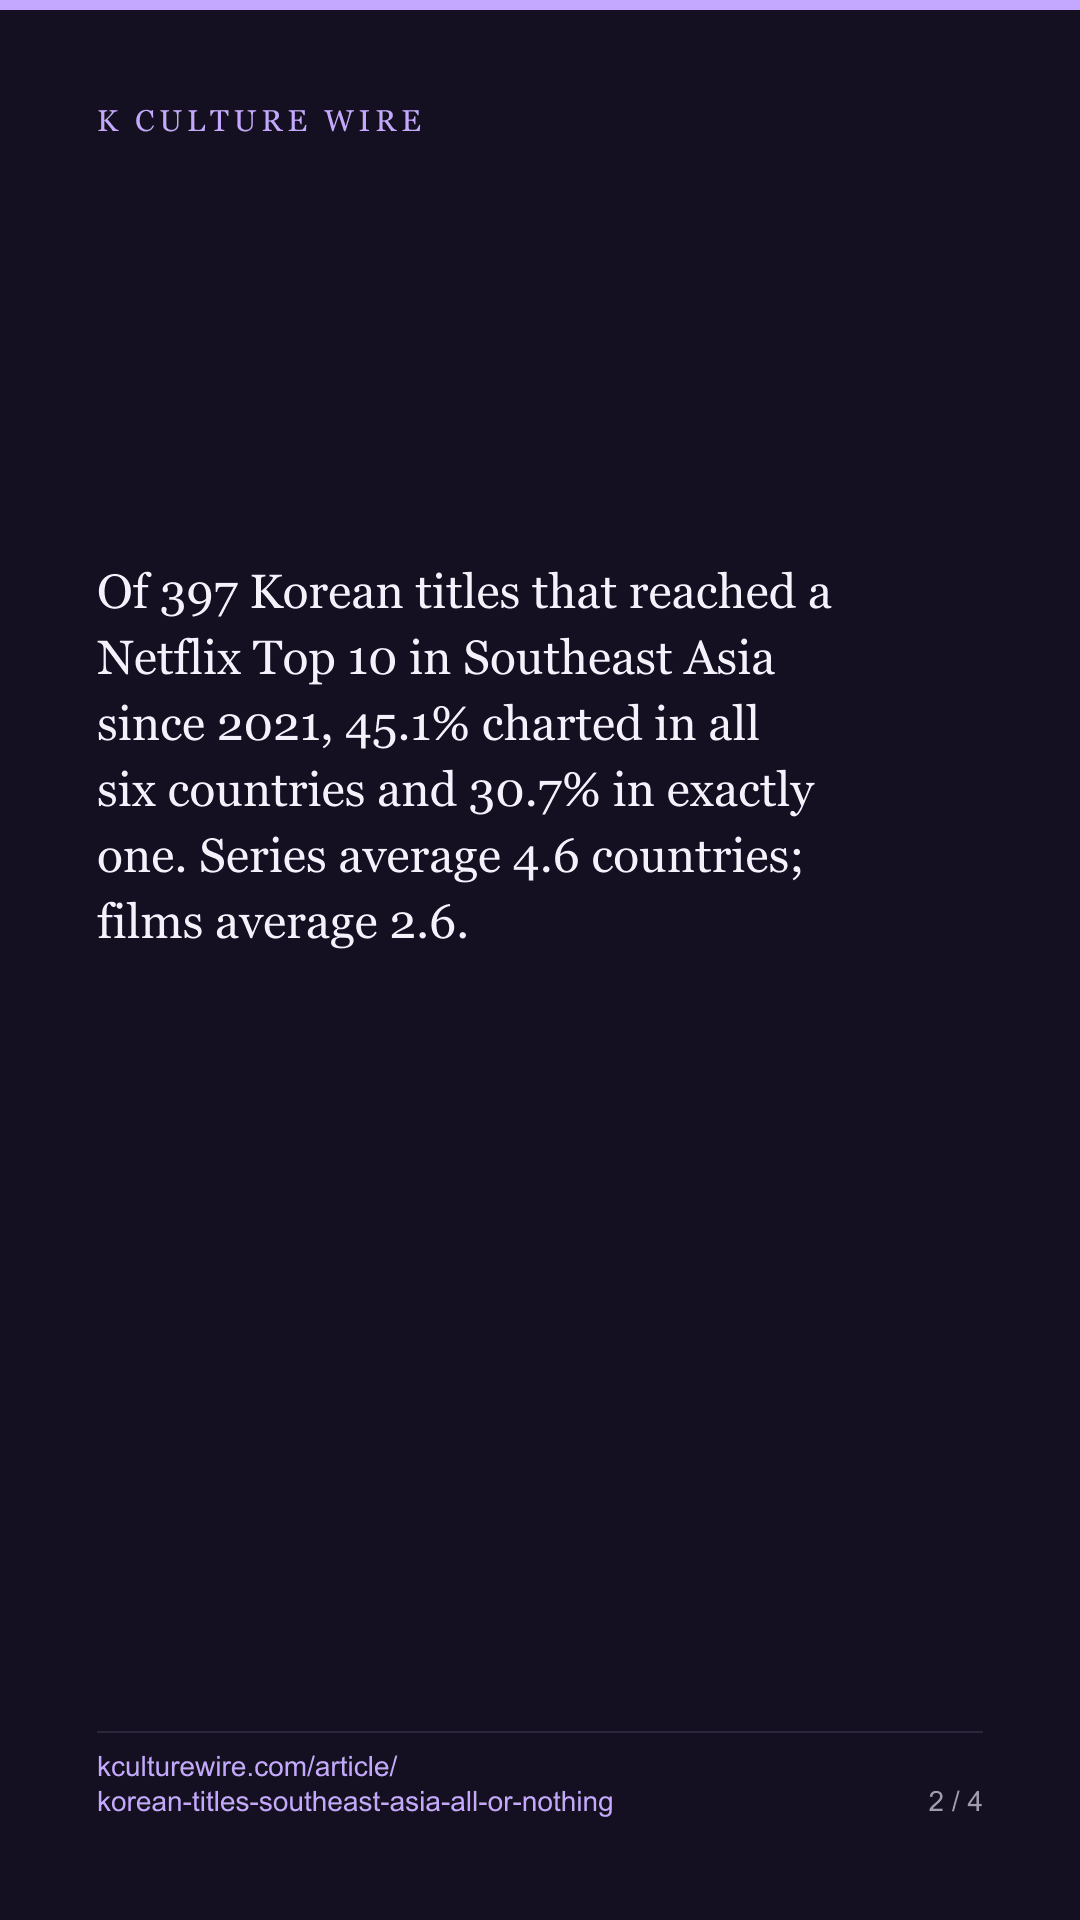
Of 397 Korean titles that reached a Netflix Top 10 in Southeast Asia since 2021, 45.1% charted in all six countries and 30.7% in exactly one. Series average 4.6 countries; films average 2.6.
The table this is written from: /reach
Southeast Asia is the largest audience for Korean film and television outside Korea itself, and Netflix publishes a weekly Top 10 for six of its markets. Over 265 consecutive weeks — from July 2021 to July 2026 — 397 Korean titles have appeared on at least one of those six lists.
Sort them by how many of the six countries they reached and the distribution is not a curve. It is two piles.
| Charted in | Titles | Share |
|---|---|---|
| All 6 countries | 179 | 45.1% |
| 5 | 19 | 4.8% |
| 4 | 22 | 5.5% |
| 3 | 22 | 5.5% |
| 2 | 33 | 8.3% |
| Exactly 1 | 122 | 30.7% |
Nearly three-quarters of everything sits at one end or the other. The four middle buckets — titles that travelled to some of the region but not most of it — hold 24.2% between them.
What the two piles look like
The titles that reach all six do not just reach further, they last longer once there: 8.4 weeks on average against 2.8 for the single-country titles. Whatever carries a title across the region also keeps it on the chart when it arrives.
At the top of the six-country pile the runs are long by any standard — Alchemy of Souls 45 weeks, Vincenzo 35, Hometown Cha-Cha-Cha 34, Squid Game 29.
Series travel. Films mostly do not.
Split the 397 by type and the two piles are largely two formats.
| Titles | Average countries | Average weeks | Reached #1 somewhere | |
|---|---|---|---|---|
| Series | 237 | 4.62 | 7.6 | 101 |
| Films | 160 | 2.61 | 2.8 | 48 |
A Korean series that charts in Southeast Asia reaches, on average, nearly five of the six markets. A Korean film reaches barely more than two and a half.
Part of that is mechanical and we should say so: a film is one sitting and a series is sixteen episodes, so a series holds a chart slot for longer almost by construction. But the country count is not a runtime artefact. Reaching Indonesia and not Thailand is a separate event from staying on a chart for six weeks, and on that measure the gap is nearly two markets.
The useful version of this
“Korean content is popular in Southeast Asia” is true and tells you nothing about any particular title. What the chart data says is narrower and more usable: a Korean title released into this region has roughly a 45% chance of behaving as a regional release and a 31% chance of being a single-market event, with relatively little chance of the middle outcome that intuition expects.
And 149 of the 397 — 37.5% — reached number one somewhere in the region at least once. Charting at all in Southeast Asia is hard; charting at the very top, for the titles that get there, is common.
All-or-nothing abroad. At home the split is different again. Read the 140 that never charted in Korea →
Where these numbers come from
Sources
- Netflix — Top 10 weekly country lists (Tudum) for Singapore, Malaysia, the Philippines, Thailand, Indonesia and Vietnam, 265 weeks from 2021-07-04 to 2026-07-26 · https://www.netflix.com/tudum/top10
- Wikidata — Country of origin (P495 = Q884) used to identify Korean titles in the weekly country lists, with titles Netflix classes on its English-language global charts excluded · https://www.wikidata.org
What we checked
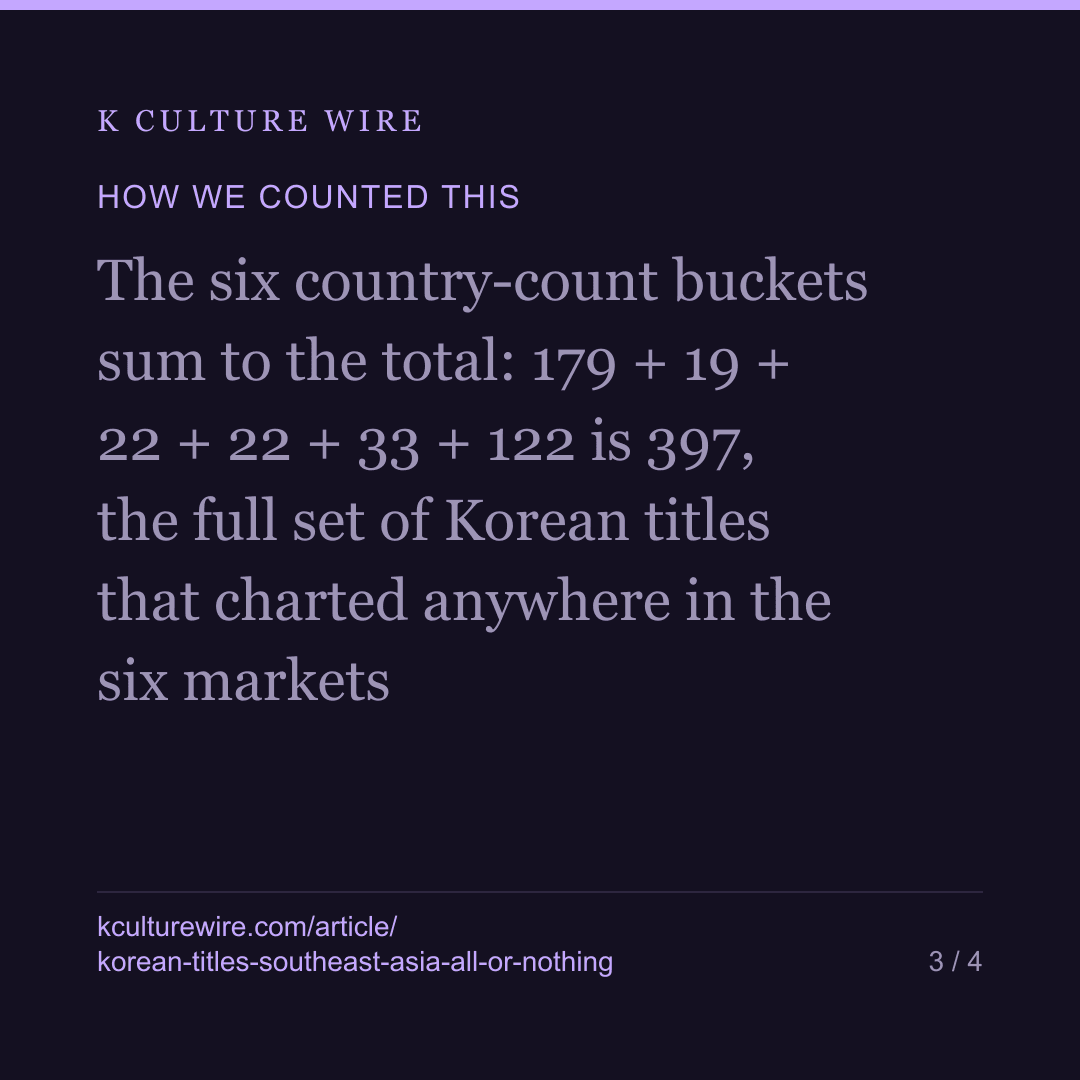
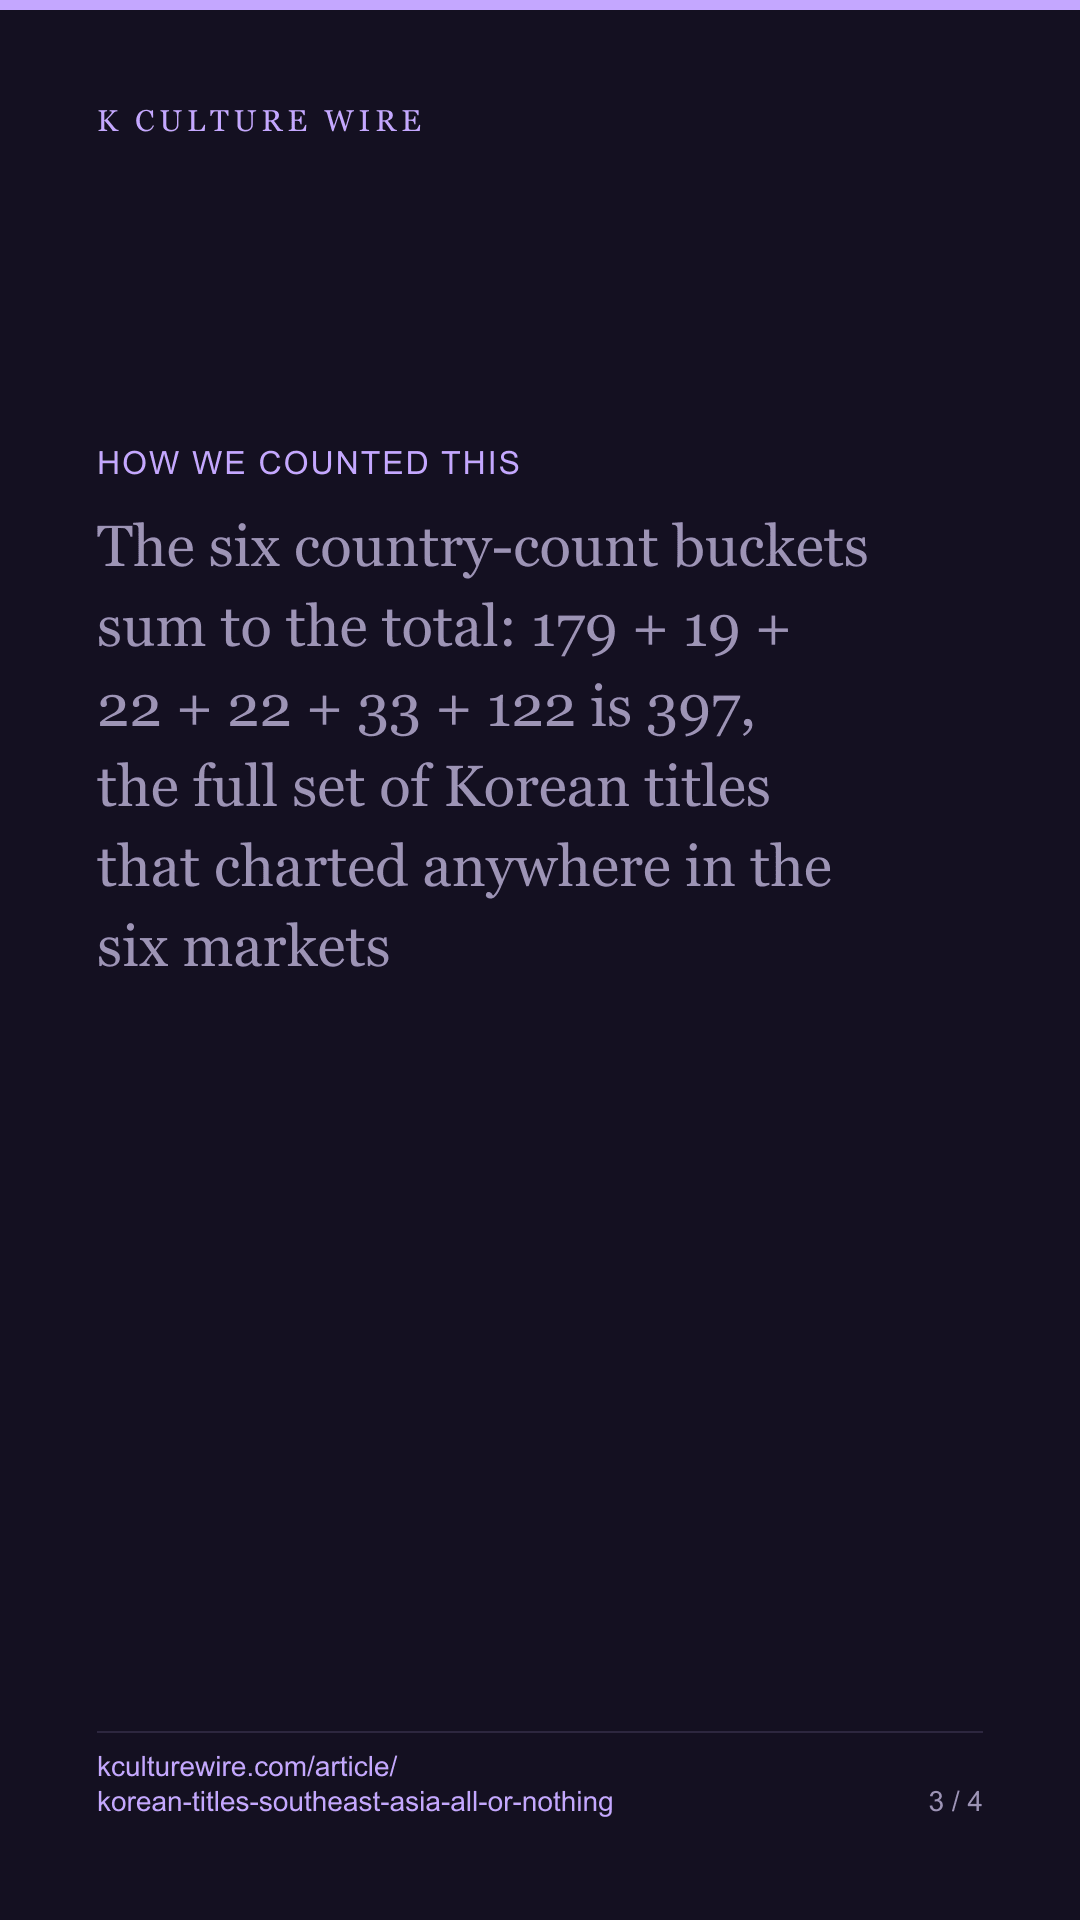
- The six country-count buckets sum to the total: 179 + 19 + 22 + 22 + 33 + 122 is 397, the full set of Korean titles that charted anywhere in the six markets
- Country count is how many of the six a title charted in at any point across the 265 weeks, not simultaneously. A title that hit Vietnam in 2022 and Thailand in 2024 counts as two
- The series-versus-film split uses the source's own type field. Series: 237 titles, 4.62 countries and 7.6 weeks on average. Films: 160 titles, 2.61 countries and 2.8 weeks
- 149 of the 397 — 37.5% — reached number one in at least one of the six countries at least once
What we left out, and why
- Anything below each country's top ten. Netflix publishes ten rows per country per week, so a title watched steadily without breaking into that ten does not appear here at all. The bimodal shape describes chart entry, not viewing
- Hours viewed. Netflix publishes hours for its global chart but not for country lists, so nothing here measures how much any of these titles were actually watched in Southeast Asia
- The rest of Southeast Asia. Six markets are covered because Netflix publishes lists for them; Cambodia, Laos, Myanmar and Brunei are not in this data and nothing here describes them
- Any runtime adjustment. A film occupies a chart slot for a fortnight in a way a sixteen-episode series does not, and part of the series-versus-film gap in weeks is that mechanical difference rather than appetite
- Why any title travelled. Release timing, dubbing and subtitle availability, and Netflix's own promotion all move these outcomes and none of them are in the published lists
The data behind this
Written from the same data
Take this away — 8 cards
The figures in this article, as images. Free to repost with the address on them.

If you work in this business
Everything on this page is measured from the same weekly Netflix lists, per market and per title. We publish the pages free; what we sell is the same measurement cut to one company's catalogue — including the figures behind /reach and /titles.
What a company sheet contains, and what it cannot tell you →