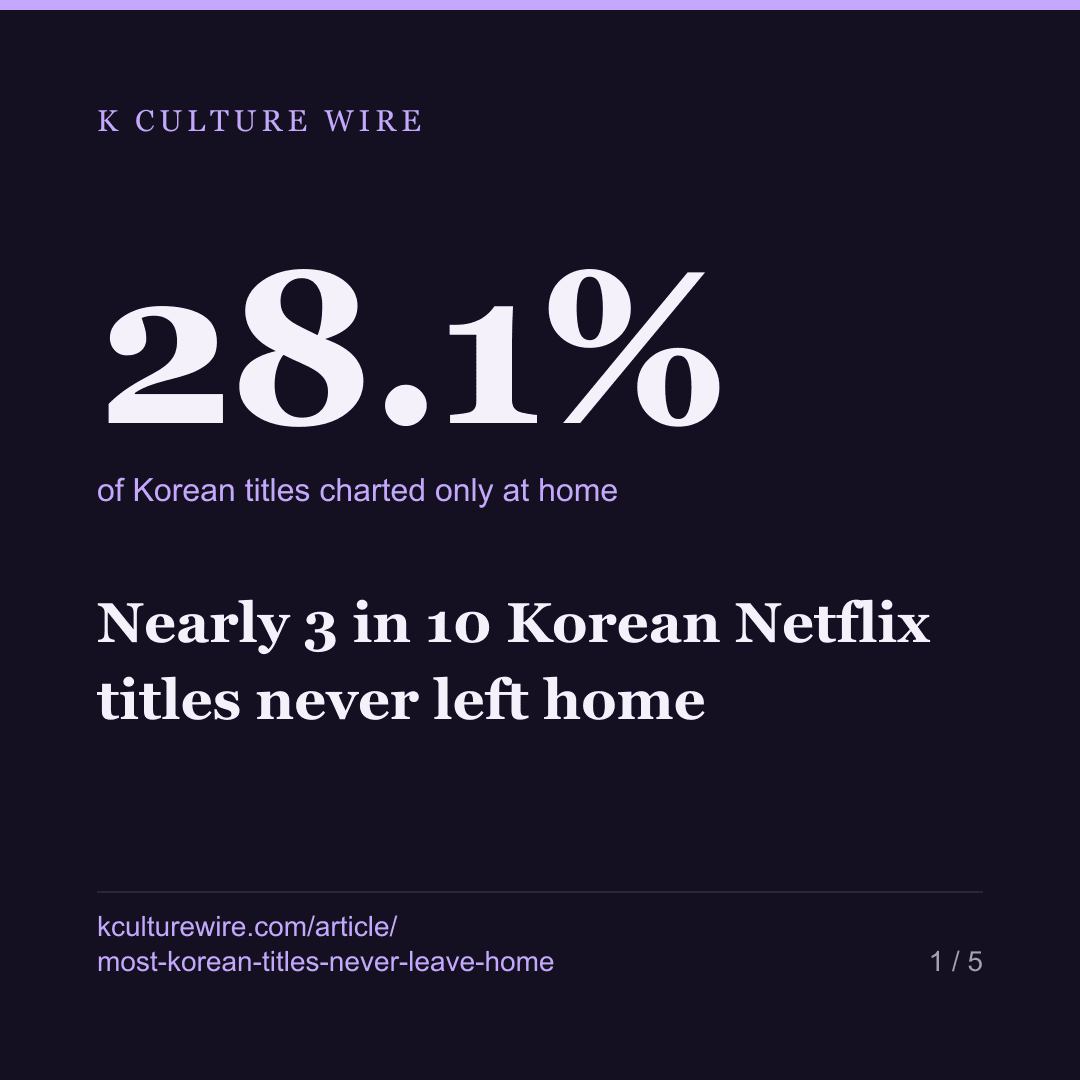
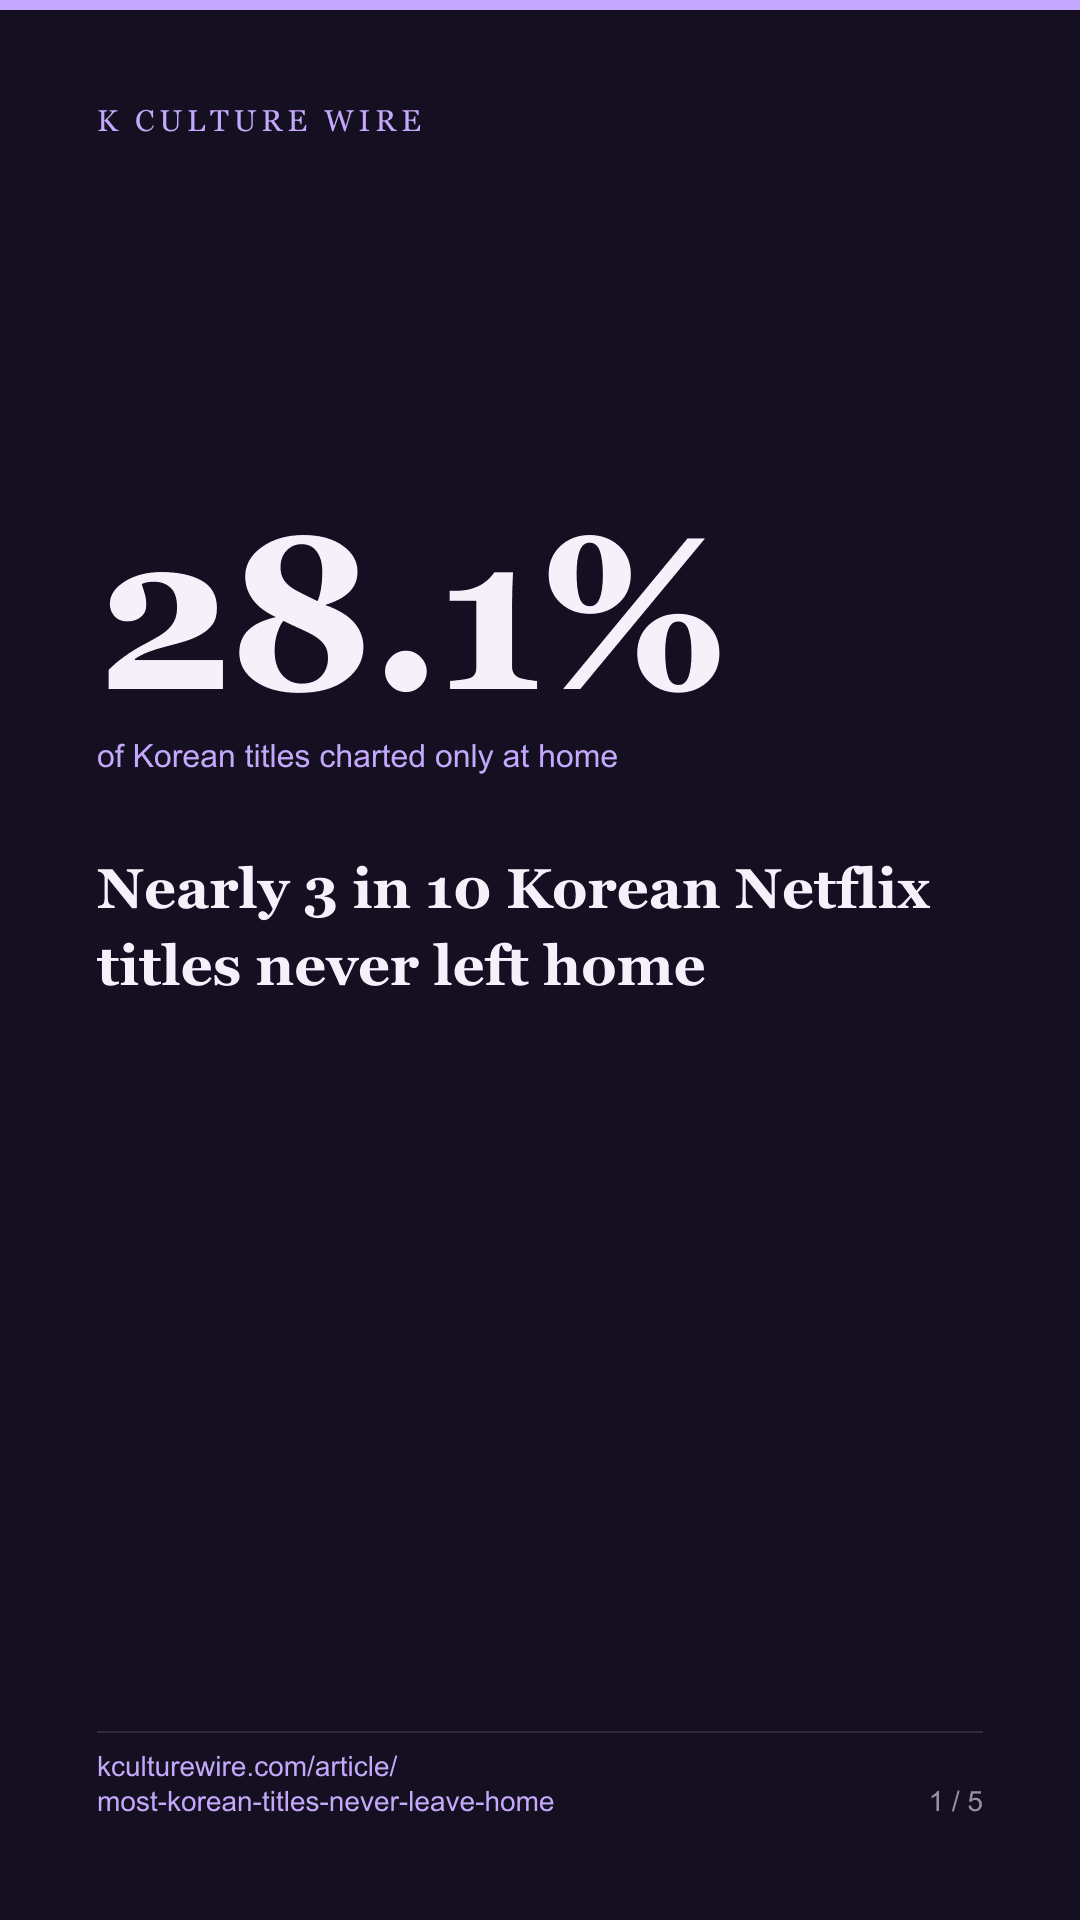
Nearly 3 in 10 Korean Netflix titles never left home
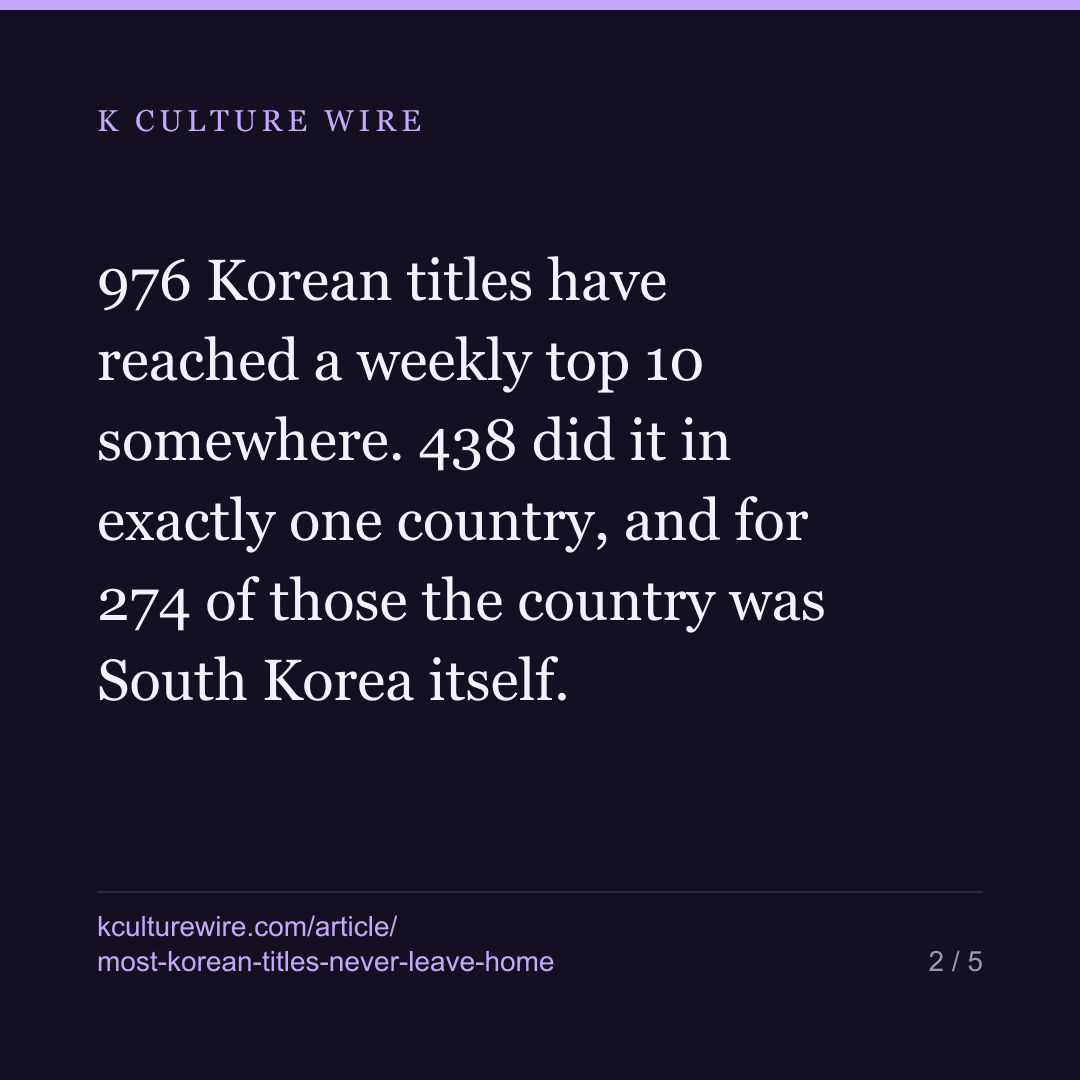
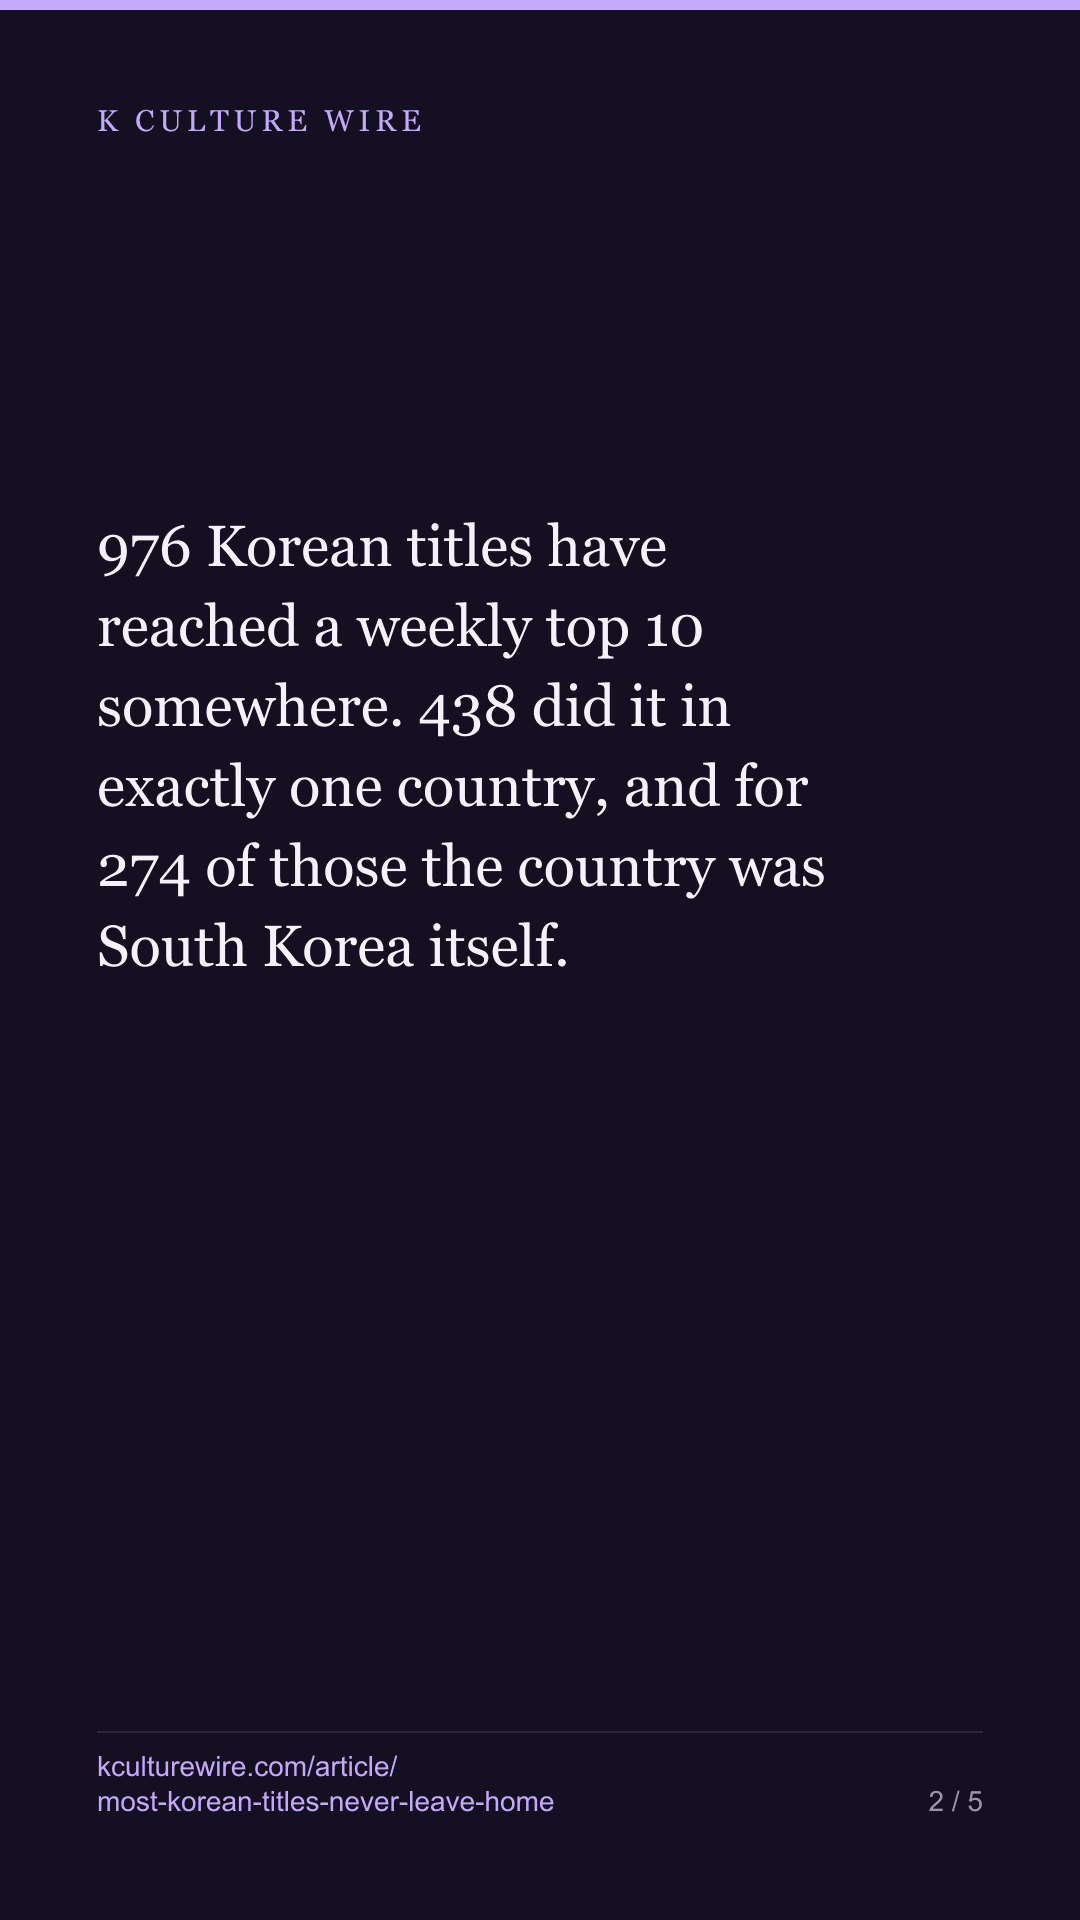
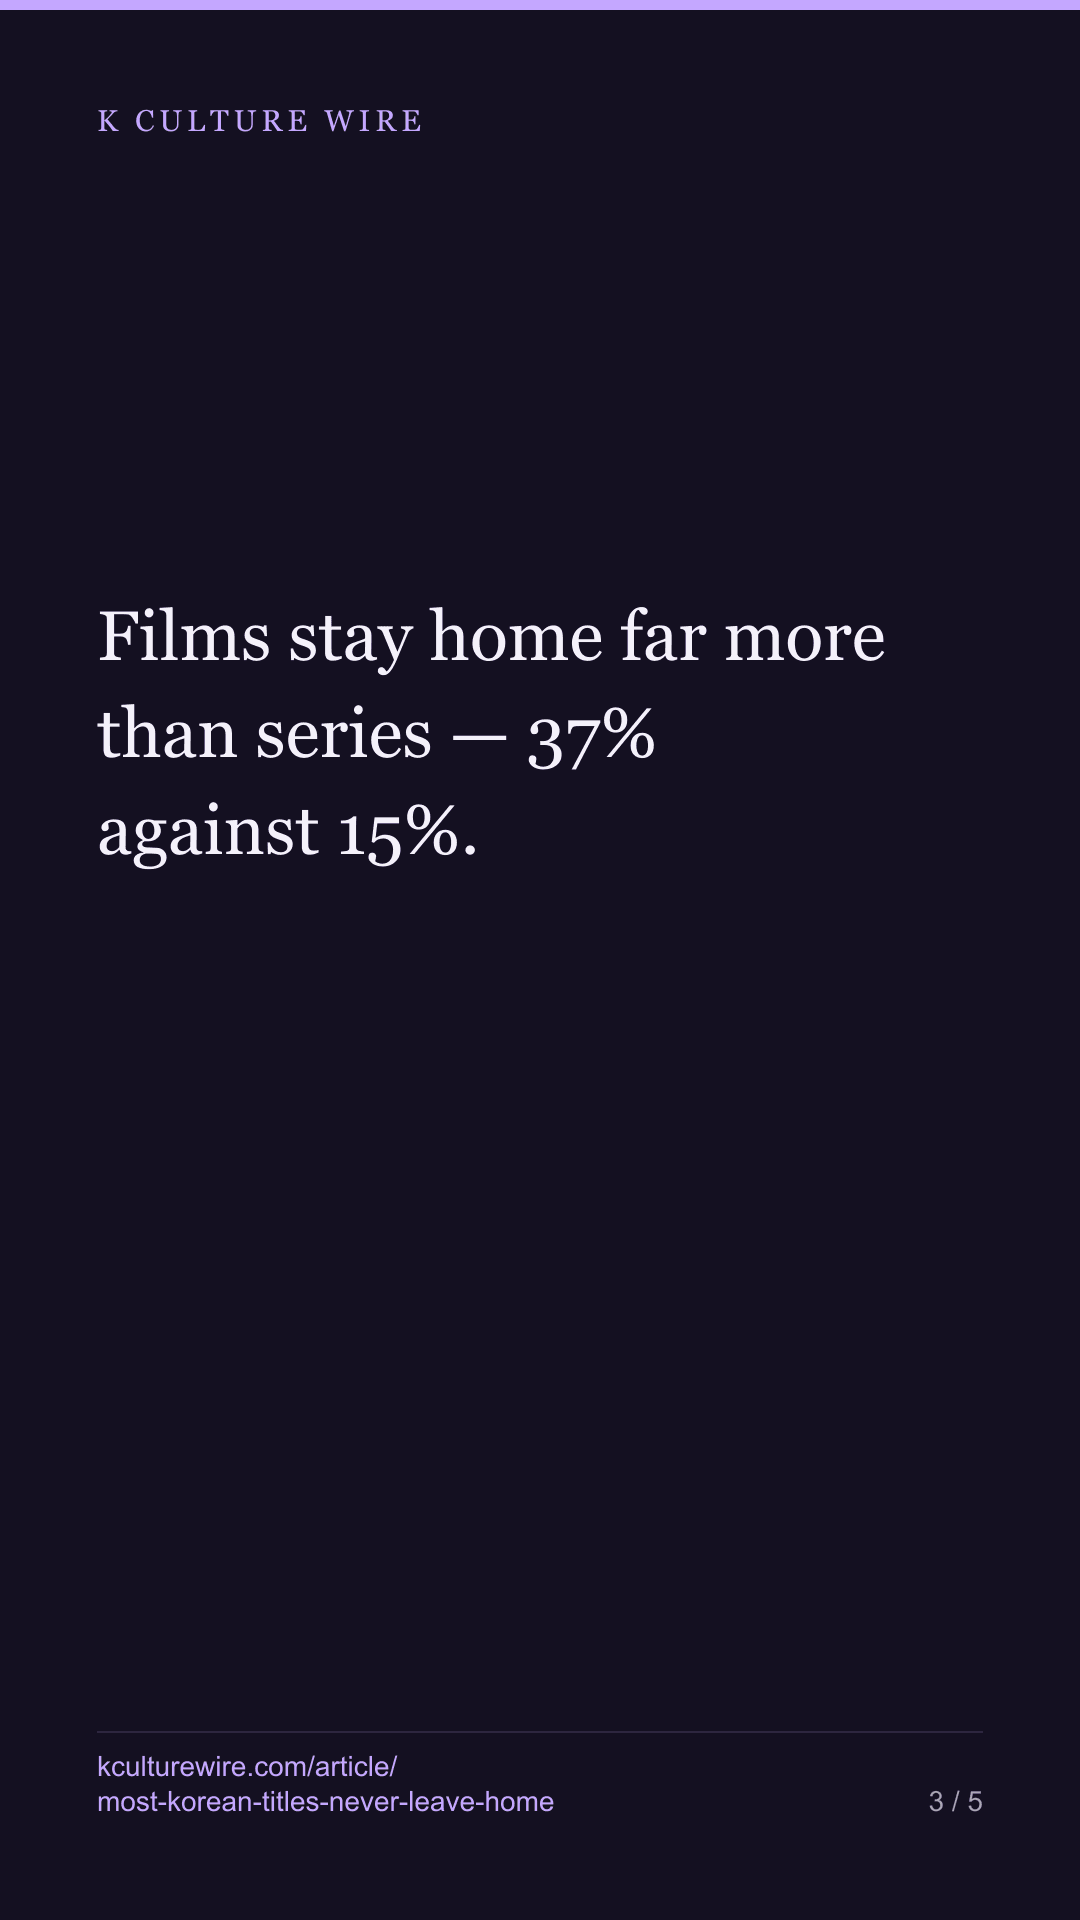
976 Korean titles have reached a weekly top 10 somewhere. 438 did it in exactly one country, and for 274 of those the country was South Korea itself. Films stay home far more than series — 37% against 15%.
The table this is written from: /titles
976 Korean titles have reached a Netflix weekly top 10 somewhere since July 2021. 438 of them — 44.9% — did it in exactly one country. For 274, that country was South Korea itself.
That is 28.1% of every Korean title on these lists: it charted at home and in none of the other 92 markets Netflix publishes a list for.
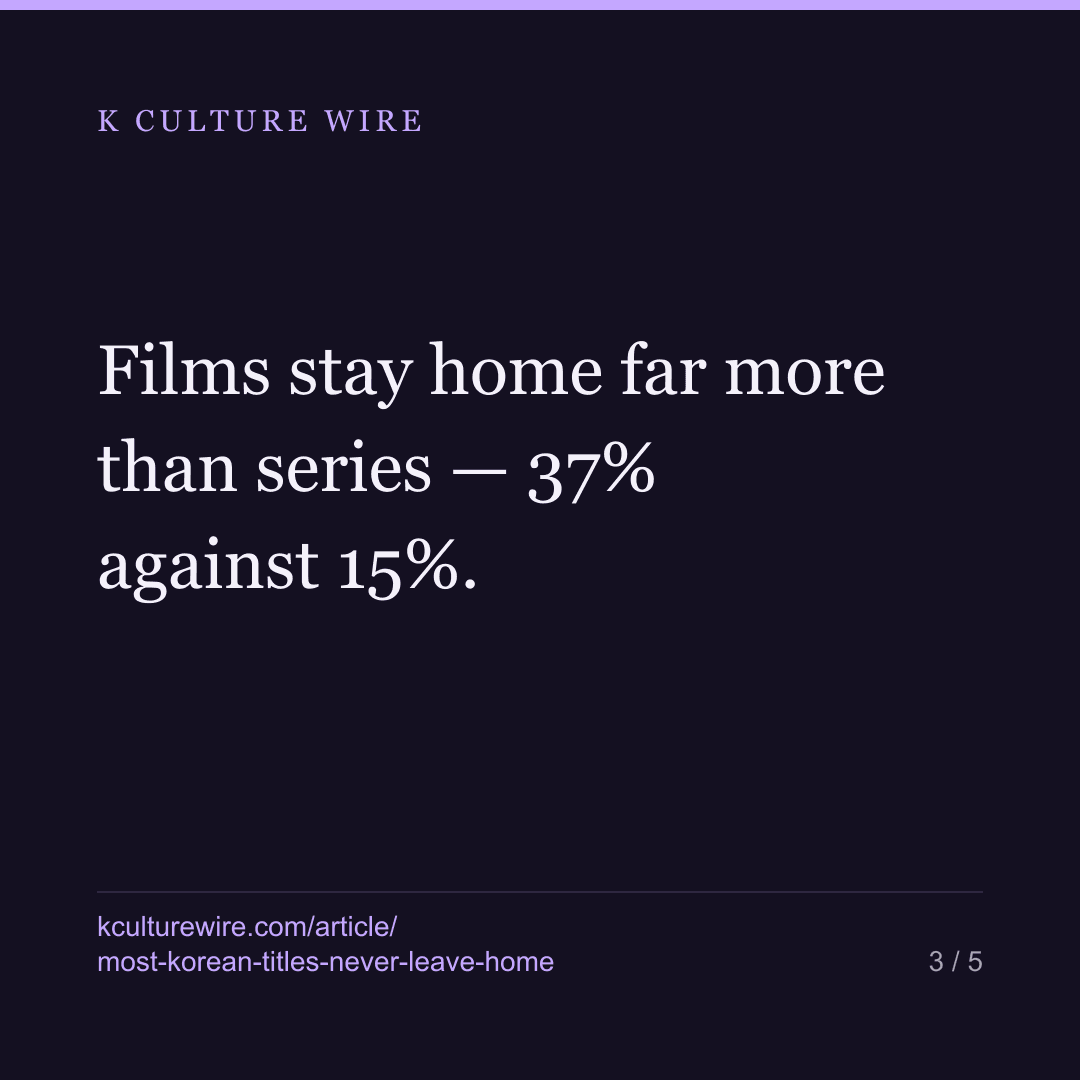
Films stay home. Series travel.
| Titles | Charted in one country | Only in South Korea | |
|---|---|---|---|
| Films | 578 | 321 (56%) | 215 (37%) |
| Series | 398 | 117 (29%) | 59 (15%) |
More than a third of Korean films that reach any top 10 reach only the Korean one. For series it is one in seven. This is a different cut of a gap we have measured before — Korean series reach about three times as many countries as Korean films — but the shape here is starker, because it counts the titles that went nowhere at all rather than comparing averages.
What staying home looks like
The two ends of this catalogue sit very far apart.
- I am Solo — a Korean reality series — held a top 10 place for 111 weeks, 112 chart places, every one of them in South Korea. It never appeared in another country’s top 10.
- Squid Game charted in 93 of 93 markets across 60 weeks.
Both are on the same lists. One of them is what “K-content went global” describes; the other ran for more than two years without leaving the country.
Most home-only titles are not like I am Solo. Their median run is 2 weeks and 2 chart places, and 61 of the 274 lasted exactly one week. Titles that did reach more than one country ran a median of 6 weeks across a median of 8 countries.
The share has roughly doubled — and here is why that number is readable
Grouped by the year a title first charted anywhere, the home-only share rises:
| First charted | Titles | Only in Korea | Share |
|---|---|---|---|
| 2021 | 177 | 30 | 17% |
| 2022 | 218 | 47 | 22% |
| 2023 | 202 | 60 | 30% |
| 2024 | 157 | 61 | 39% |
| 2025 | 135 | 36 | 27% |
| 2026 | 87 | 40 | 46% |
The obvious objection is that recent titles have had less time to travel. A title that first charted in 2021 has had five years; one from 2026 has had months. That alone could produce a rising line.
So we measured how long travelling actually takes. Of the 538 titles that reached more than one country, 333 — 62% — were in two countries in the same week. 74% reached their second country within four weeks, 84% within twenty-six.
Travel, when it happens, happens almost immediately. Dropping every title whose first chart week is inside the last six months leaves 906 titles with at least half a year of exposure, and the pattern is the same: 17% (2021), 22%, 30%, 39% (2024), 27% (2025), and 26.6% across the whole mature set.
⚠ The line is not straight. 2025 falls back to 27% after 2024’s 39%, and the 2026 figure rests on 87 titles in a part-year — 17 of them once the six-month filter is applied. What we can say is that the share roughly doubled between 2021 and 2024 and has not returned to its 2021 level. We cannot say it is still rising.
What this does not say
Charting in one country is not the same as being available in one country. Netflix publishes chart lists, not catalogues. A title absent from a country’s top 10 may still have been on Netflix there and simply never reached the top ten. We hold the chart lists and we do not guess the difference — so read every figure here as “did not chart elsewhere”, never as “was not released elsewhere”.
182 of the 274 home-only titles have fewer than six weekly rows in these files. This site does not publish an individual page for a title below that threshold, because a page built on two rows would say more than the data can support. They are counted here, where the group is the subject, and they are the reason the median run is two weeks.
Netflix also publishes no viewing figures in the per-country files, so nothing here measures how many people watched. A chart place is a rank, not an audience.
Every title in this count has its own row on the titles page, and how far each one travelled is broken out by market on the reach page.
Where these numbers come from
Sources
- Netflix — Top 10 weekly lists (Tudum), per-country, 268 weeks from 2021-07-04 to 2026-08-16, 93 markets · https://www.netflix.com/tudum/top10
- Wikidata — Country of origin (P495 = Q884) and instance-of, to identify Korean titles and split film from series · https://query.wikidata.org
What we checked
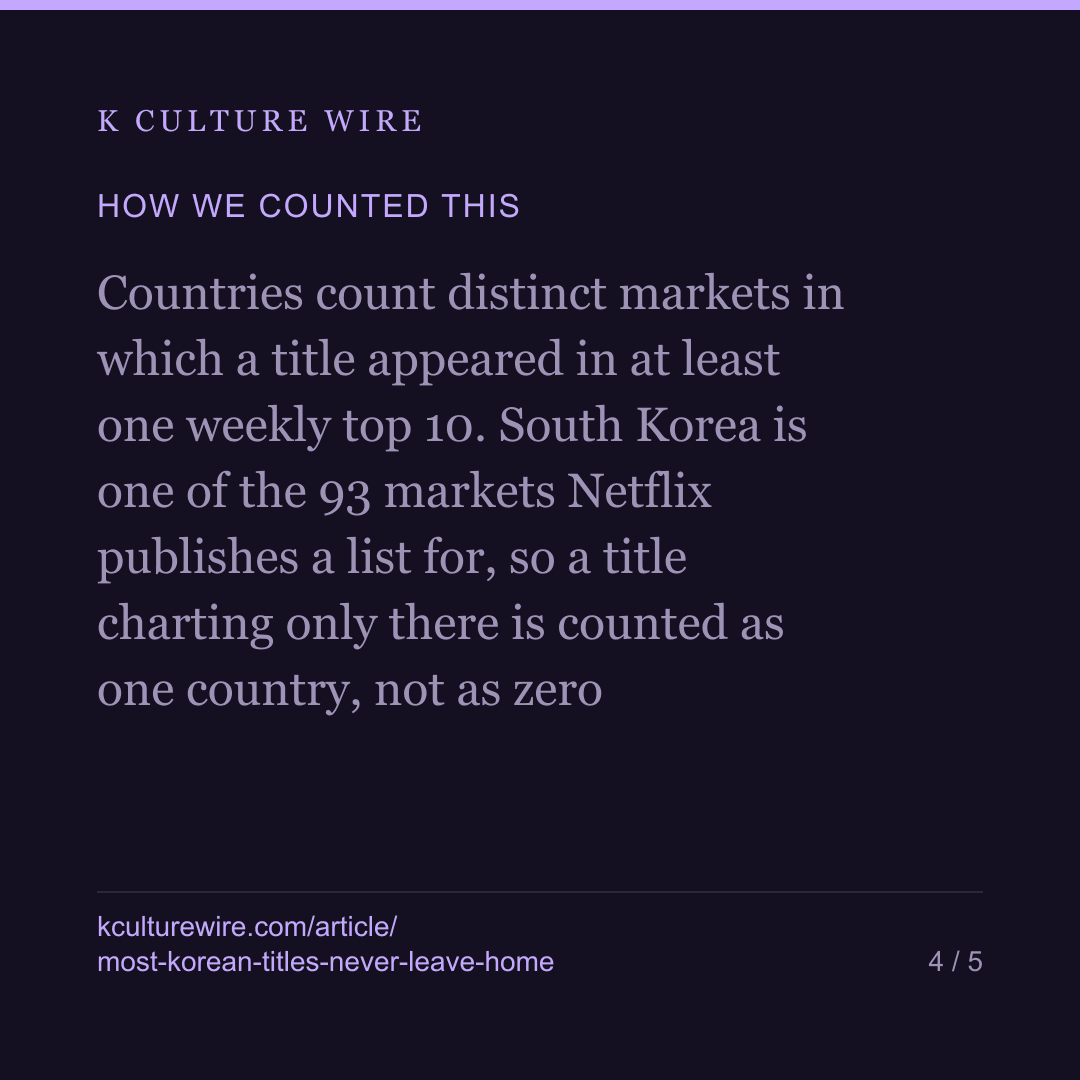
- Countries count distinct markets in which a title appeared in at least one weekly top 10. South Korea is one of the 93 markets Netflix publishes a list for, so a title charting only there is counted as one country, not as zero
- The year a title is filed under is the year of its first chart appearance anywhere, not its release year. Netflix publishes no release date in these files
- These figures were re-derived independently from Netflix's raw country file (499,180 rows) rather than from our own aggregate: that pass returns 433 one-country titles and 271 Korea-only against the 438 and 274 published here. The gap is our check matching titles on exact name, which resolves 973 of the 976 titles, not a difference in the count
- Travel speed is measured per title as the gap between the earliest first-week across its markets and the second-earliest. It is the check that decides whether the year-by-year figures can be read at all
The data behind this
Written from the same data
Take this away — 10 cards
The figures in this article, as images. Free to repost with the address on them.

If you work in this business
Everything on this page is measured from the same weekly Netflix lists, per market and per title. We publish the pages free; what we sell is the same measurement cut to one company's catalogue — including the figures behind /titles and /by-country and /reach.
What a company sheet contains, and what it cannot tell you →
What do you make of this?
We counted it. What it means is yours to decide.