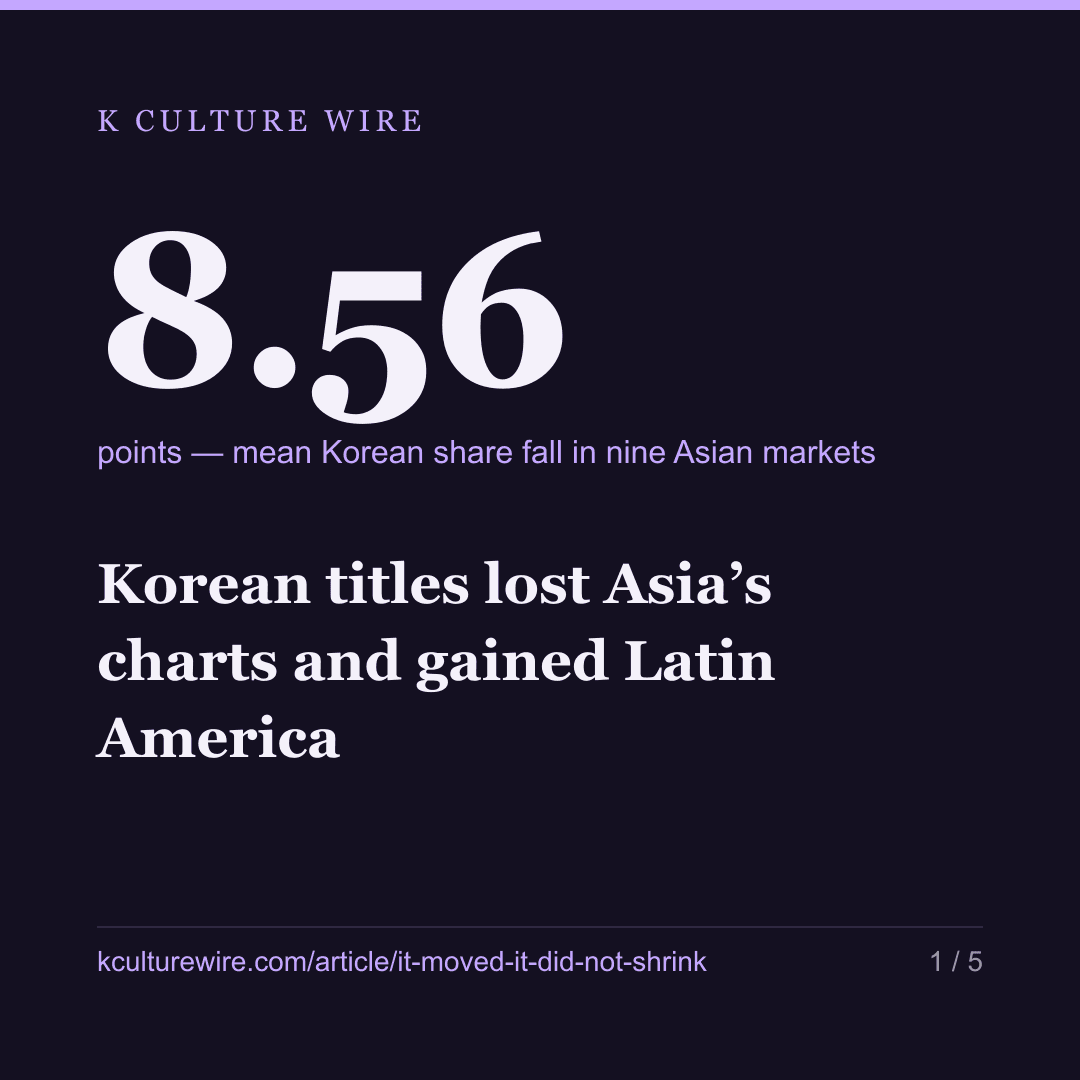
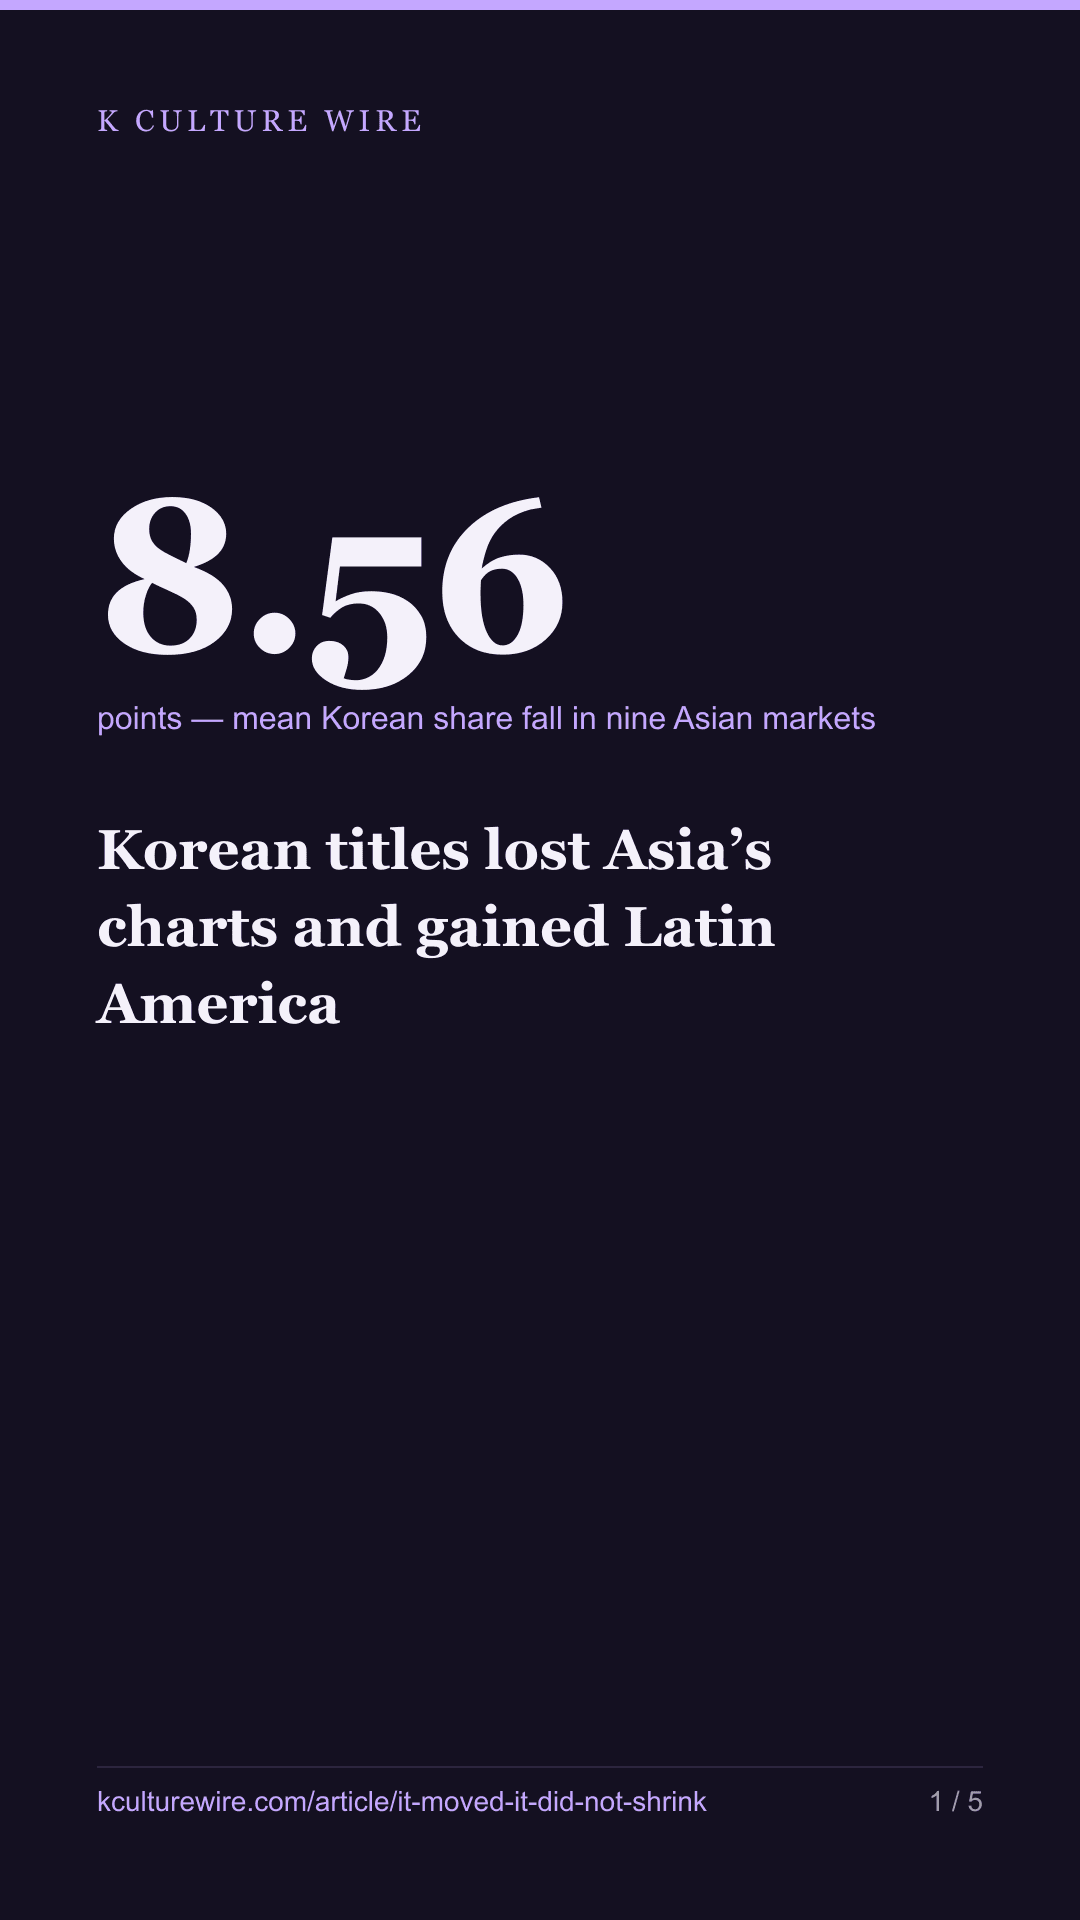
Korean titles lost Asia’s charts and gained Latin America
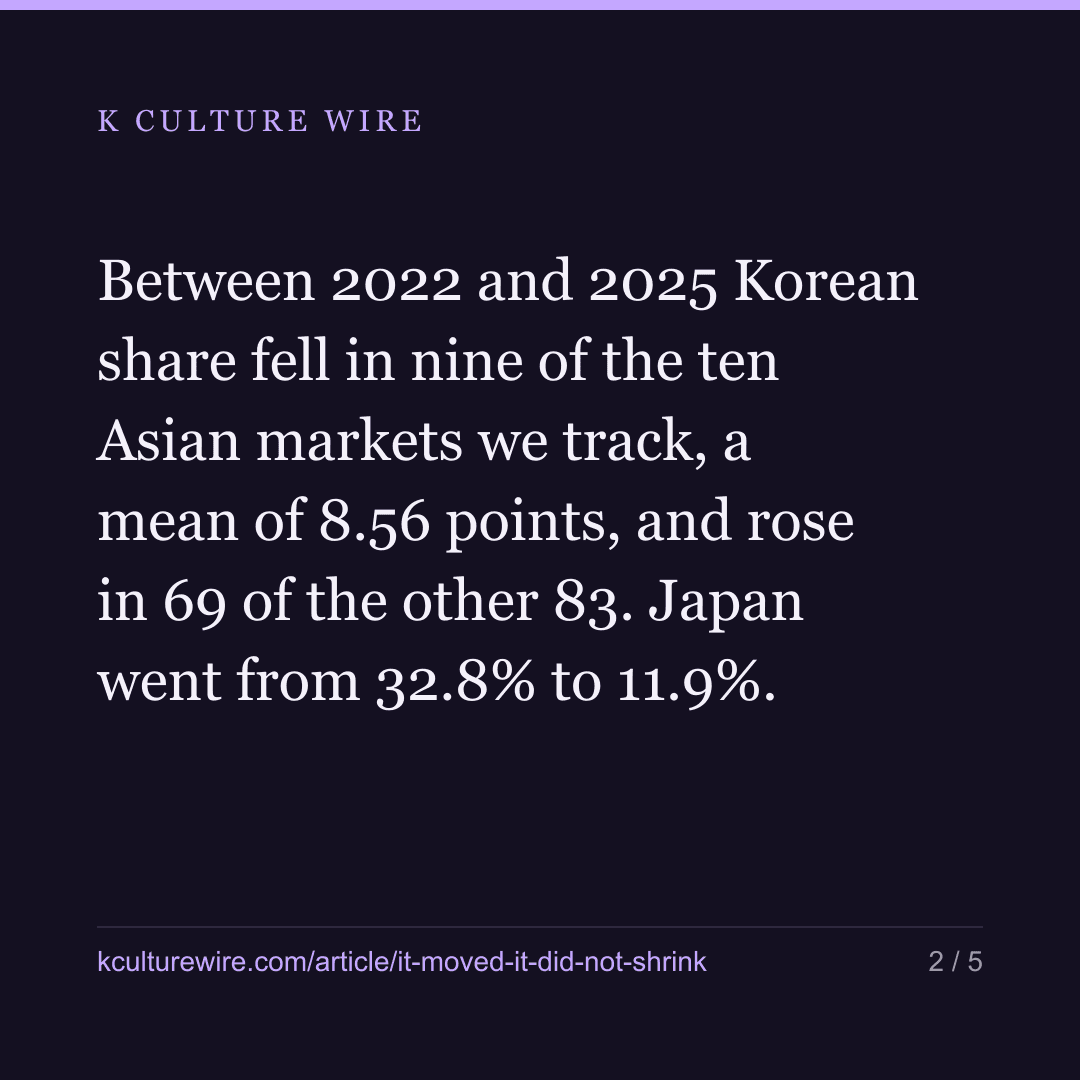
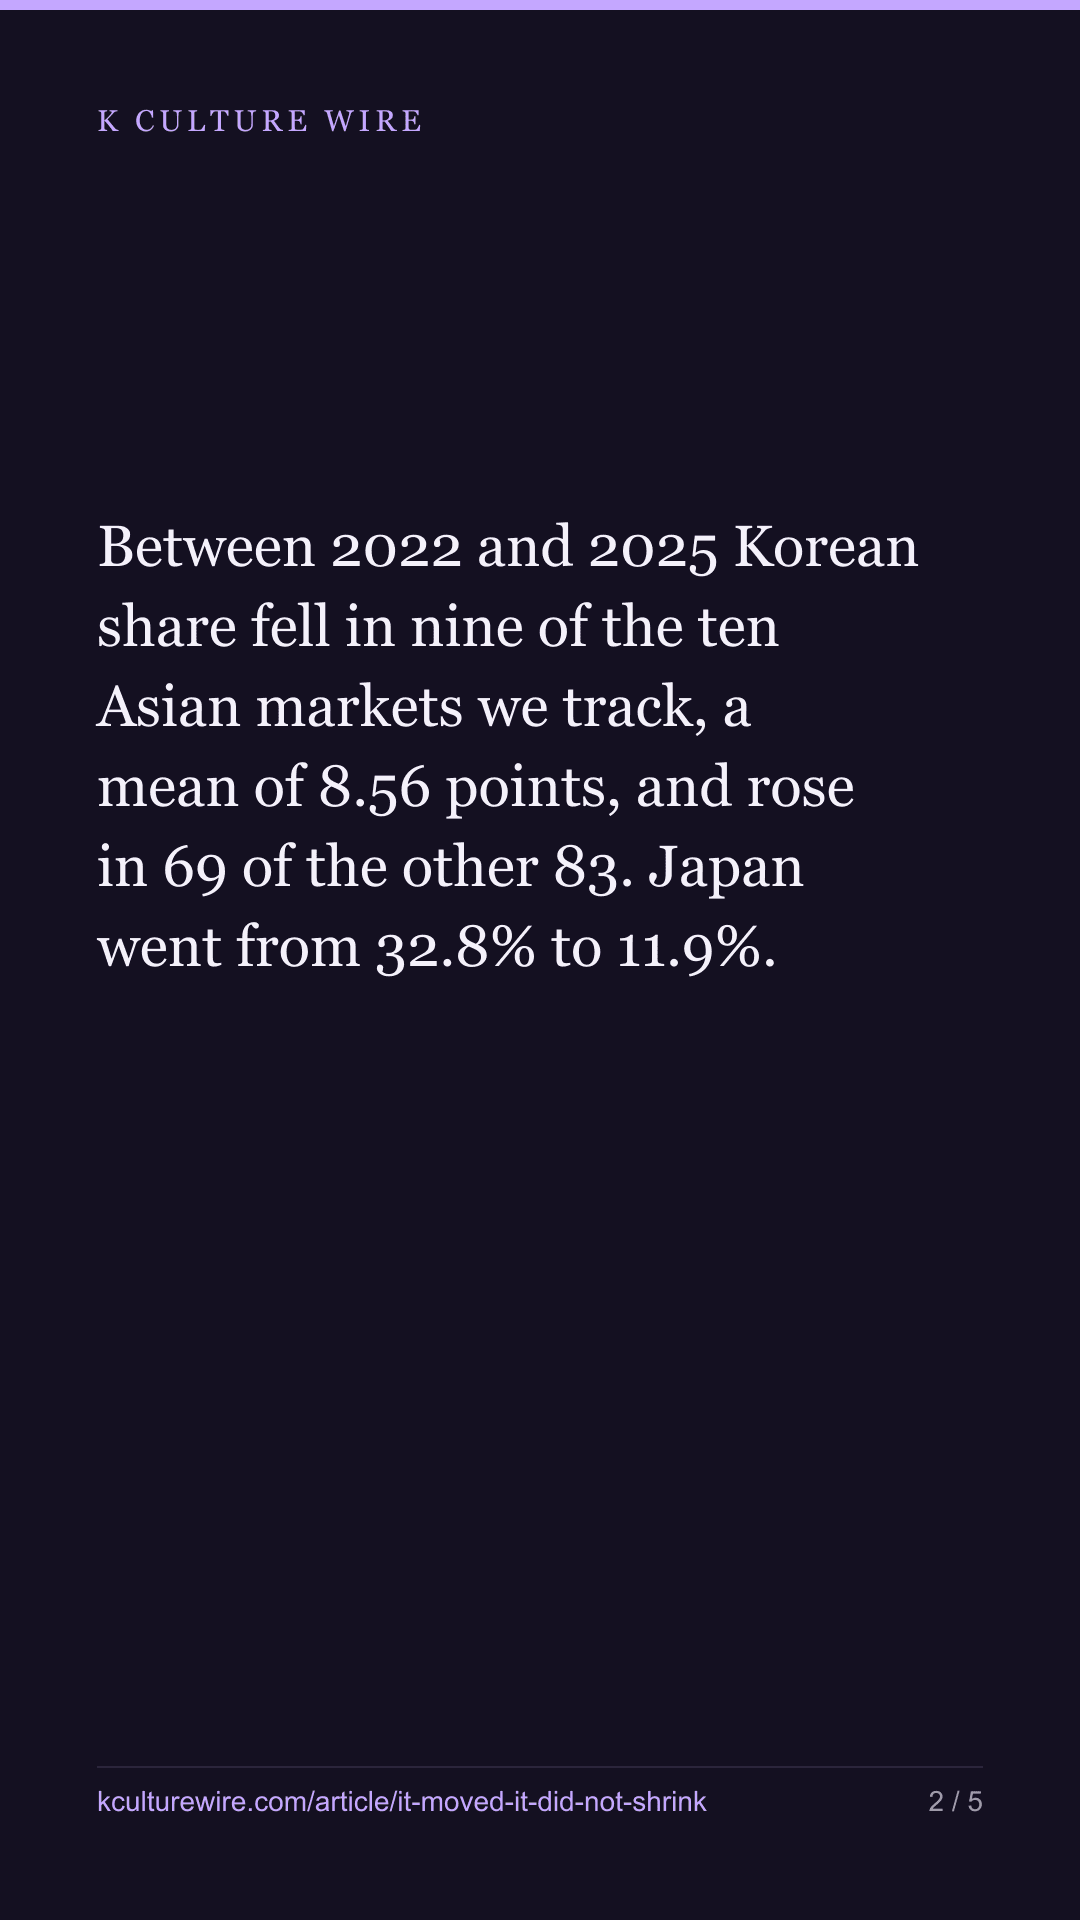
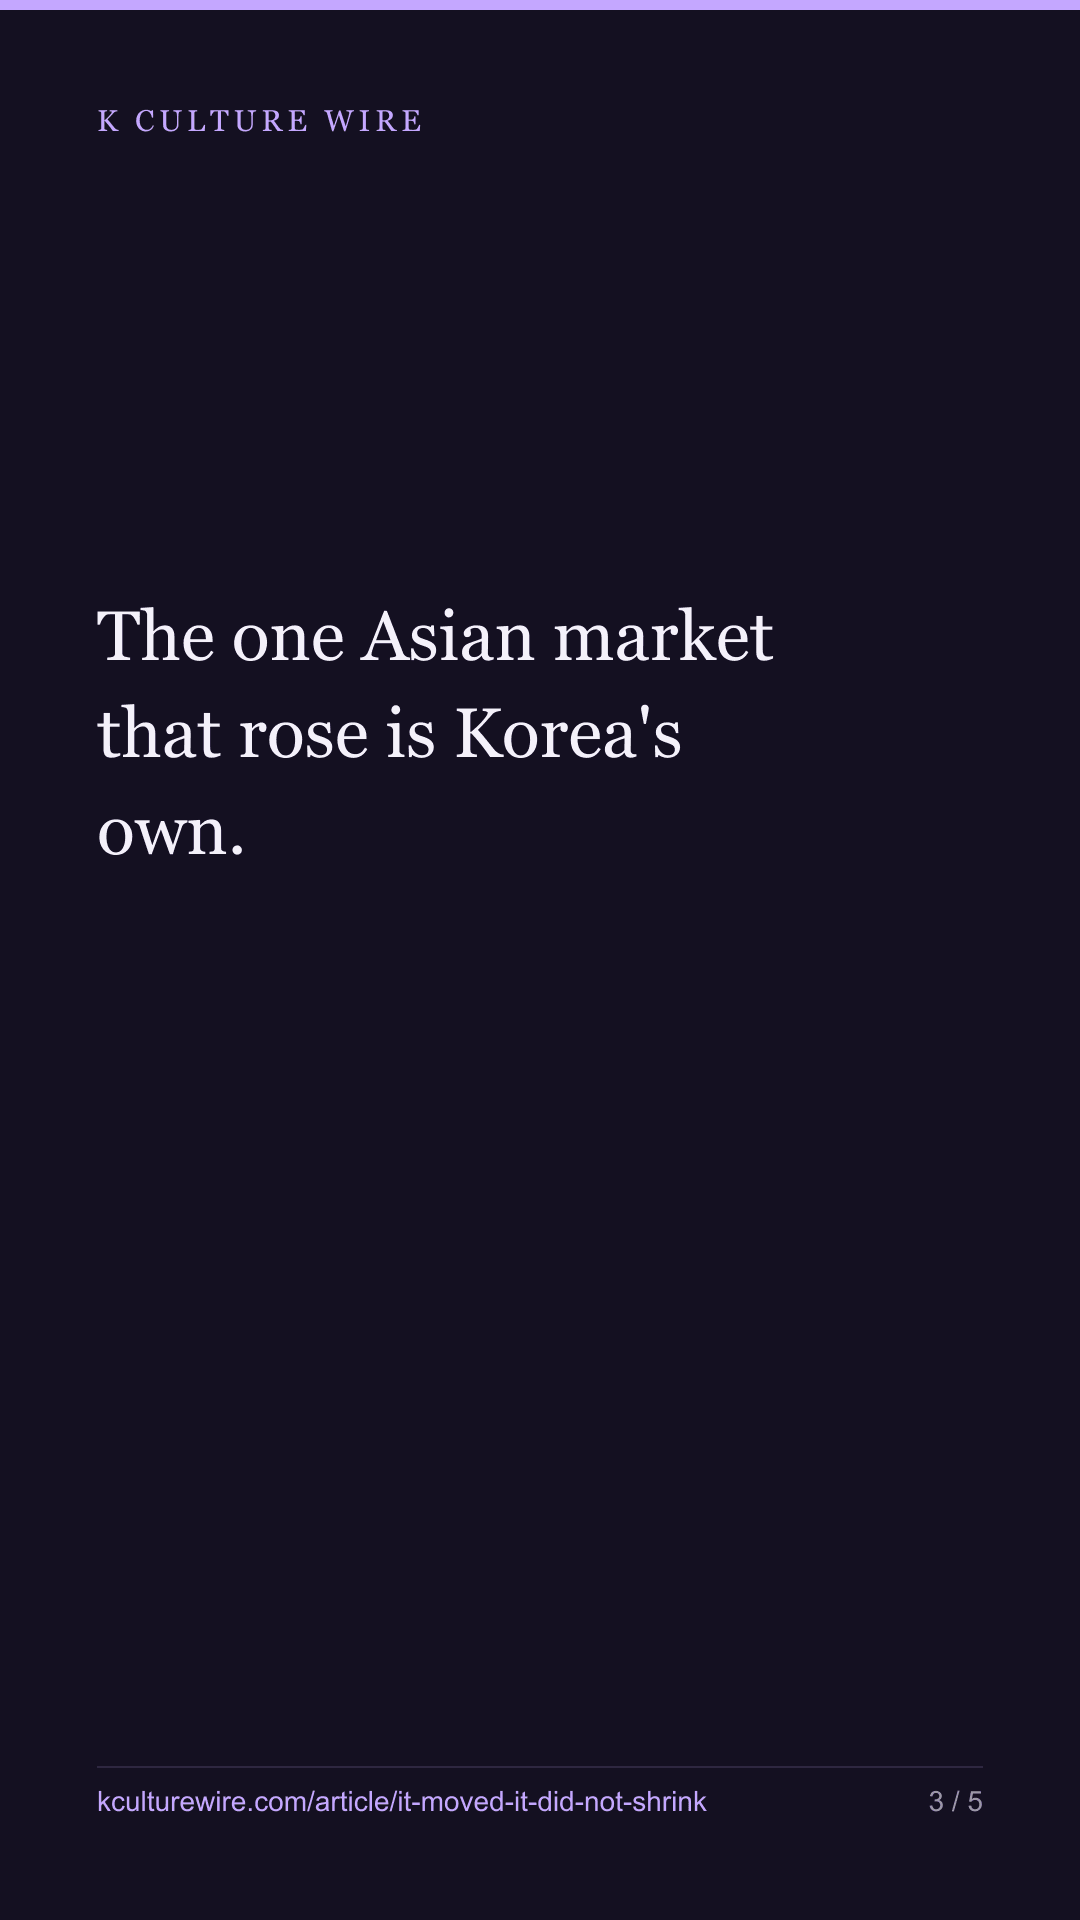
Between 2022 and 2025 Korean share fell in nine of the ten Asian markets we track, a mean of 8.56 points, and rose in 69 of the other 83. Japan went from 32.8% to 11.9%. The one Asian market that rose is Korea's own.
The table this is written from: /where-it-moved
Korean titles held about 7.7% of the world’s Netflix top 10 places across five years, and that number barely moved. It is the kind of flat line that gets read as “nothing happened”.
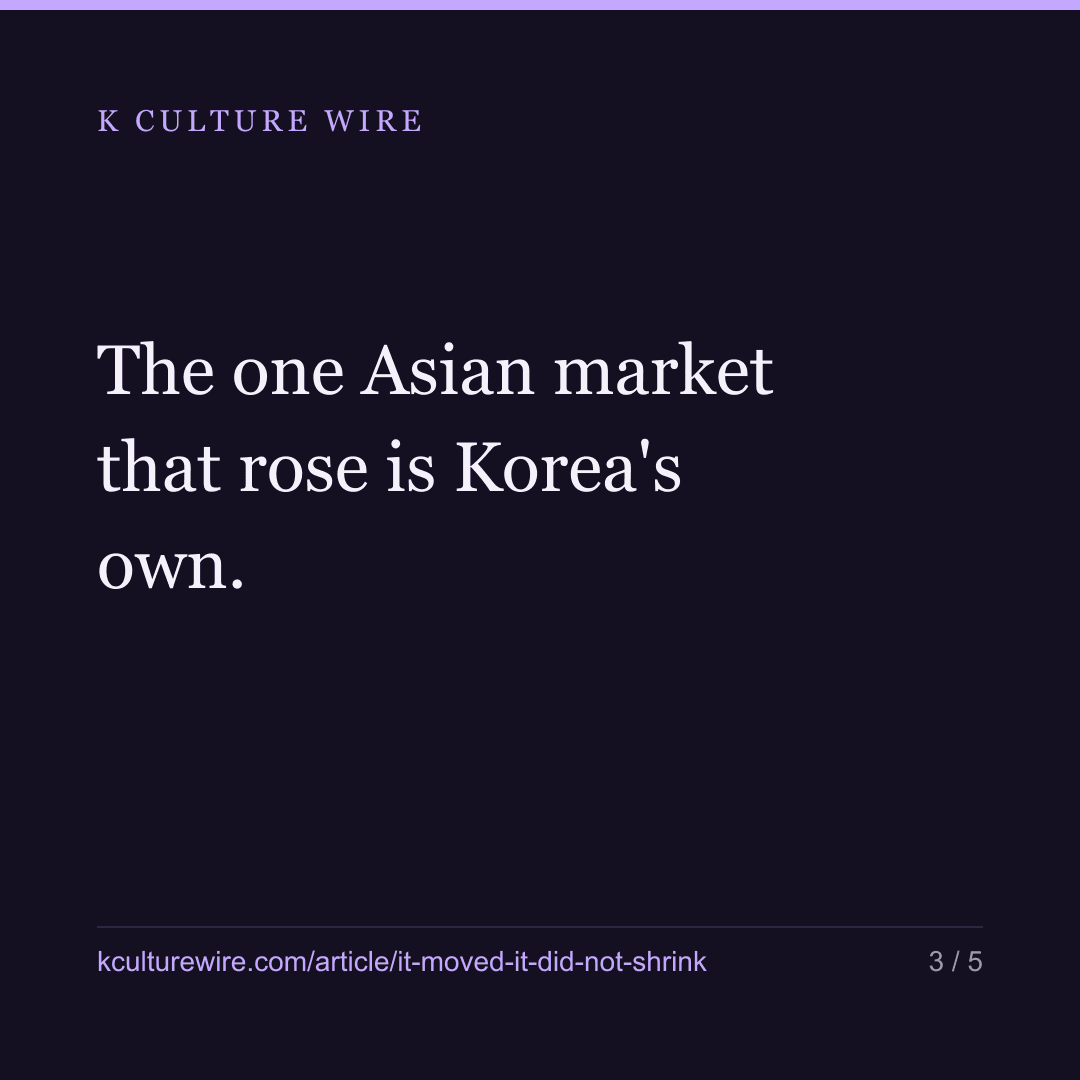
Underneath it, almost everything happened. Comparing two whole years — 2022 against 2025, 52 weeks each, 93 markets — Korean share fell in nine of the ten Asian markets we track and rose in 69 of the other 83. The single Asian market where it rose is South Korea itself, from 51.2% to 53.3%.
Two groups, opposite directions
| Markets | Mean change | Markets that rose | |
|---|---|---|---|
| The ten Asian markets | 10 | −8.56p | 1 |
| Everywhere else | 83 | +1.84p | 69 |
One Asian market went up, and it is Korea itself: 51.2% of its own chart in 2022, 53.3% in 2025. The other nine all fell. That the only riser is the home market is the shape of the finding, not an exception to it.
Where it left
| Market | 2022 | 2025 | Change | Korean places | Different titles |
|---|---|---|---|---|---|
| Japan | 32.8% | 11.9% | −20.9p | 341 → 124 | 63 → 41 |
| Thailand | 30.8% | 20.3% | −10.5p | 320 → 211 | 67 → 55 |
| Malaysia | 31.4% | 21.5% | −9.9p | 327 → 224 | 61 → 51 |
| Vietnam | 34.4% | 25.8% | −8.6p | 358 → 268 | 68 → 53 |
| Singapore | 27.8% | 19.2% | −8.6p | 289 → 200 | 60 → 52 |
| Hong Kong | 27.9% | 19.4% | −8.5p | 290 → 202 | 64 → 47 |
| Indonesia | 34.3% | 26.7% | −7.6p | 357 → 278 | 69 → 55 |
| Philippines | 27.9% | 20.6% | −7.3p | 290 → 214 | 71 → 51 |
Japan is the steepest fall anywhere on this site. A third of the chart down to a ninth of it. And the two columns on the right move together: 339 Korean places became 116, and the number of different Korean titles charting fell from 63 to 41. That is not one franchise ending. It is a shelf getting shorter.
Where it went
| Market | 2022 | 2025 | Change | Korean places | Different titles |
|---|---|---|---|---|---|
| Nicaragua | 5.4% | 12.3% | +6.9p | 56 → 128 | 18 → 29 |
| Guatemala | 4.1% | 10.9% | +6.8p | 43 → 113 | 14 → 27 |
| Venezuela | 3.6% | 10.3% | +6.7p | 37 → 107 | 12 → 30 |
| Ecuador | 5.1% | 11.2% | +6.1p | 53 → 116 | 18 → 26 |
| Honduras | 6.3% | 12.1% | +5.8p | 66 → 126 | 19 → 31 |
| Colombia | 4.2% | 9.9% | +5.7p | 44 → 103 | 15 → 25 |
| El Salvador | 6% | 11.5% | +5.5p | 62 → 120 | 16 → 29 |
| Peru | 9.8% | 15% | +5.2p | 102 → 156 | 24 → 35 |
Every one of the eight largest gains is in Latin America.
The obvious objection is that these are small bases: going from 4% to 10% is easier than holding 33%. True, and worth saying. But the right-hand column answers the version of that objection that matters — the number of different Korean titles charting roughly doubled in each of them. Venezuela went from 13 Korean titles to 31. This is not one hit repeated; it is a catalogue arriving.
What a share cannot tell you
A share is a ratio, and a ratio can fall two ways. Korean titles may have charted less, or other titles may have pushed them out. A chart position cannot separate those, which is why the place counts and title counts sit beside every share on the table behind this piece.
What we can say is that in Japan both numbers fell together, and in Venezuela both rose together. A pure crowding-out story would move the share without moving the count of distinct Korean titles. That is not what either end looks like.
The flat line was two moving lines
The five-year world figure of 7.7% is correct, and on its own it is close to useless for anyone deciding where to sell. It is the sum of a region losing roughly ten points and eighty-three markets gaining one and a bit — which is a different business in each direction.
All 93 markets, alphabetically, with places and title counts beside every share: where it moved. The five-year figure it sits inside is at world share.
What this does not say: why. Netflix may have commissioned differently, released differently, or audiences may have moved. Chart positions record what held a place, not what caused it — and one place in Guatemala’s top 10 and one in Japan’s are one place each here, which is not the same number of people.
What changed on 3 September 2026
Every market figure here was recounted, and one sentence had to go.
This piece said Korean share fell in every Asian market we track. It did not: it rose in South Korea itself, from 51.2% to 53.3%. Nine of the ten fell. The claim was true when we published it and stopped being true when the panel was rebuilt, and the collector that builds this data is written to refuse the file if any Asian market other than Korea rises — so the guard did its job and the sentence above it did not follow.
| Was | Now | |
|---|---|---|
| Asian markets where share fell | 10 of 10 | 9 of 10 |
| Mean change, the ten Asian markets | −9.68p | −8.56p |
| Markets outside Asia where share rose | 68 of 83 | 69 of 83 |
| Japan | 32.6% → 11.2% | 32.8% → 11.9% |
| Japan, distinct Korean titles | 62 → 38 | 63 → 41 |
Both tables are now generated from the counted file rather than typed, so their rows cannot drift out of order or out of date separately from the summary. The shape of the finding is unchanged: Korean share fell steeply across Asia and rose across most of the rest of the world, and this piece still does not say why — a share can fall because Korean titles took fewer places or because other titles took more, and these counts cannot separate the two.
Where these numbers come from
Sources
- Netflix — Tudum weekly Top 10 country lists — 2022 and 2025 compared, 52 weeks each, 93 markets · https://www.netflix.com/tudum/top10
- Wikidata — Country of origin (P495 = Q884) and item numbers, used to decide which chart titles are Korean · https://query.wikidata.org
What we checked
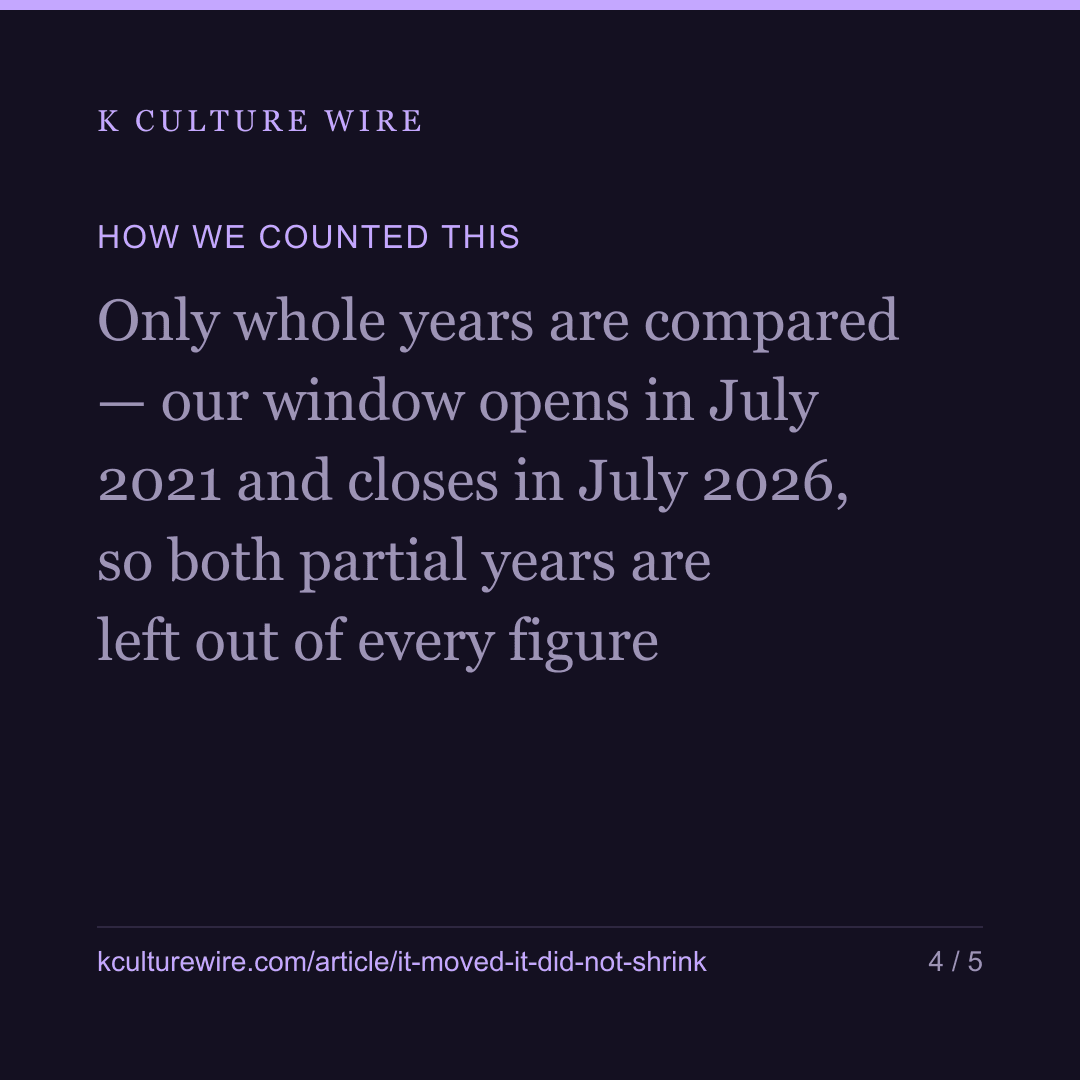
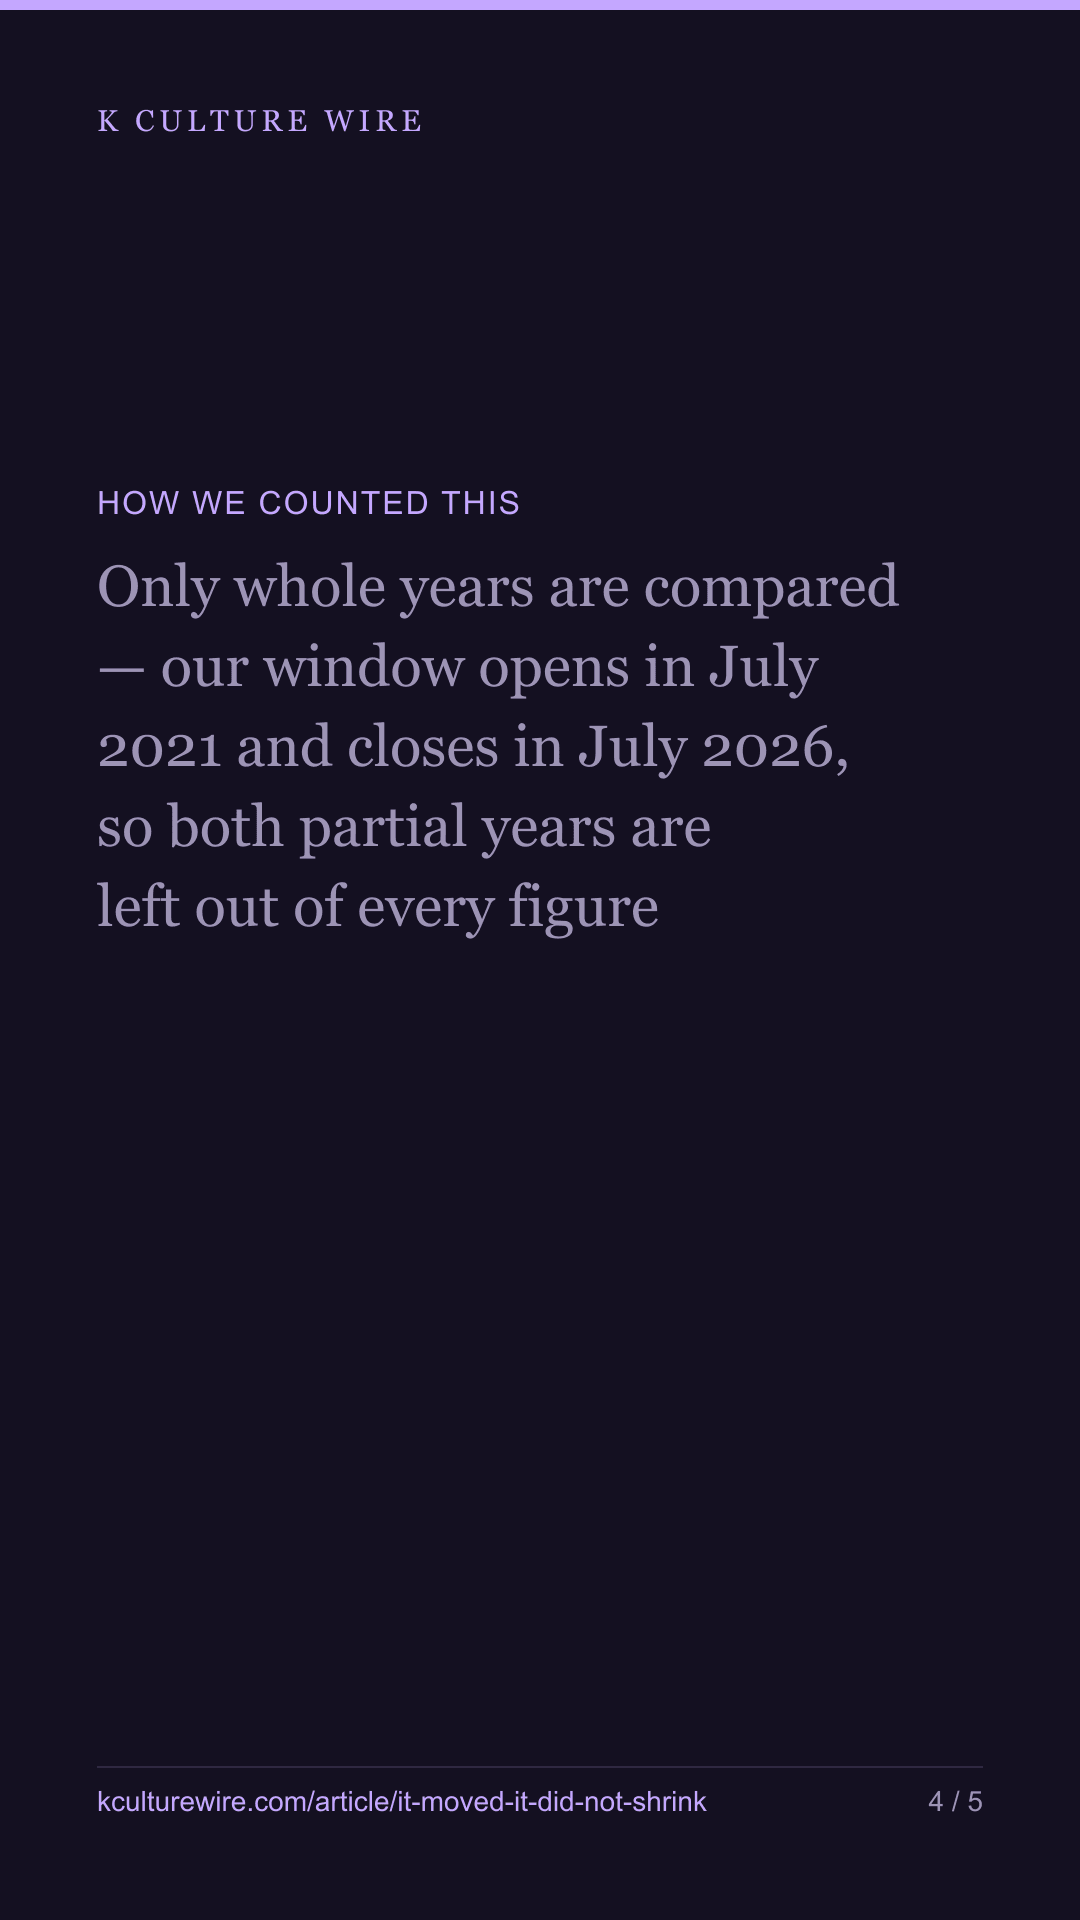
- Only whole years are compared — our window opens in July 2021 and closes in July 2026, so both partial years are left out of every figure
- Slots per year are counted from the weeks actually present rather than assumed, because 2023 has 53 weeks and a fixed number would have silently mis-stated one year
- Every share is printed beside its raw place count and its distinct-title count, so a reader can see whether a falling share came with fewer Korean titles or the same titles losing ground
- The collector refuses to write its file if any Asian market other than Korea itself rose, or if the mean change outside Asia is not positive — the claim would then be untrue and the piece would have to be rewritten. Korea is allowed to rise, and does: its own share went from 51.2% to 53.3%
What we left out, and why
- Any word for why. Chart positions cannot tell us whether Netflix commissioned less, released differently, or audiences moved
- Viewing. A top 10 is a rank list; a title outside it is invisible here at any level of watching
- The claim that Korean content declined. World share held near 7.7% across the five years — this piece is about where inside that figure the places sit
- Russia, whose list Netflix stopped publishing in February 2022
- Population and subscriber counts. A place in Guatemala's top 10 and a place in Japan's are one place each here, and they are not the same number of people
The data behind this
Written from the same data
Take this away — 10 cards
The figures in this article, as images. Free to repost with the address on them.

If you work in this business
Everything on this page is measured from the same weekly Netflix lists, per market and per title. We publish the pages free; what we sell is the same measurement cut to one company's catalogue — including the figures behind /where-it-moved.
What a company sheet contains, and what it cannot tell you →