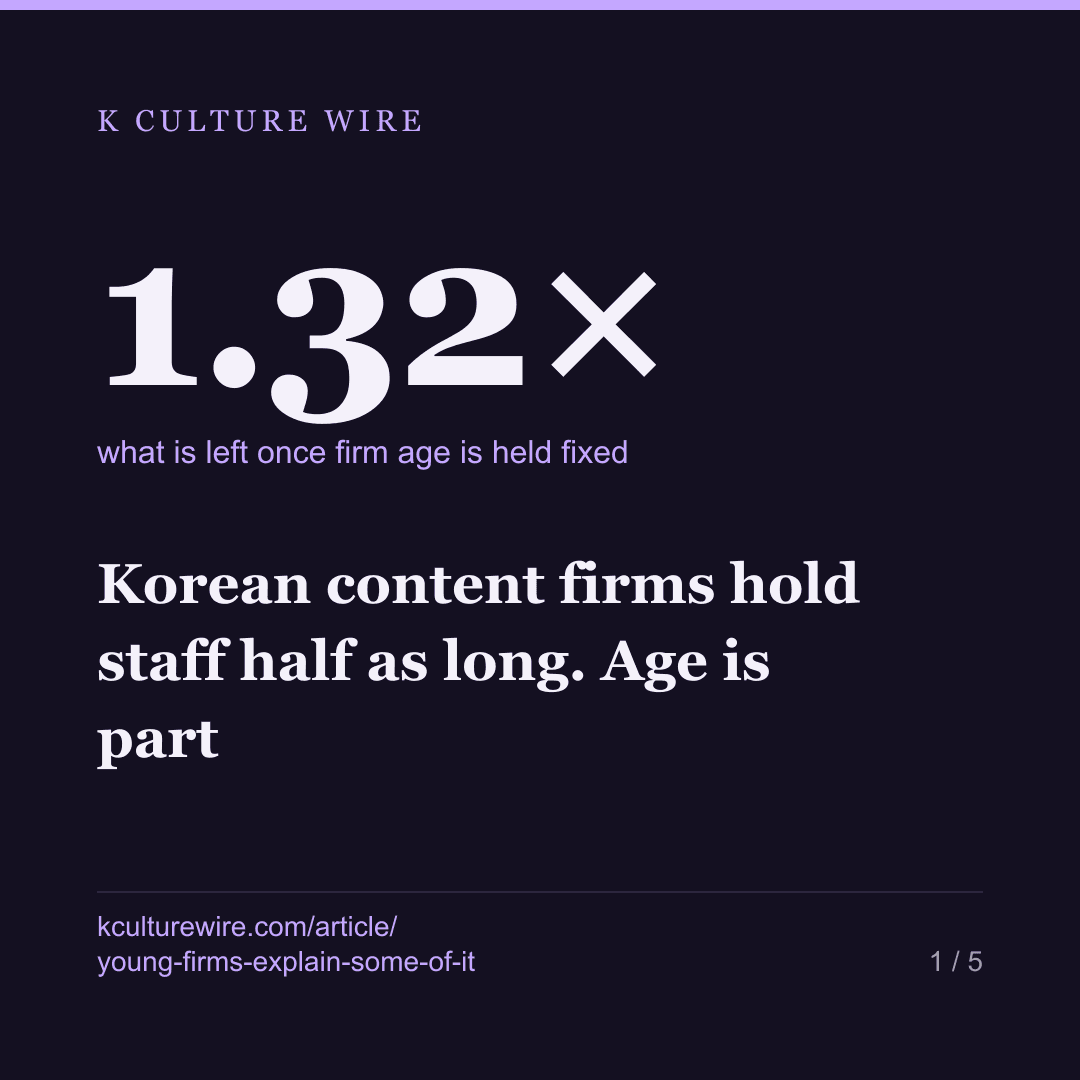
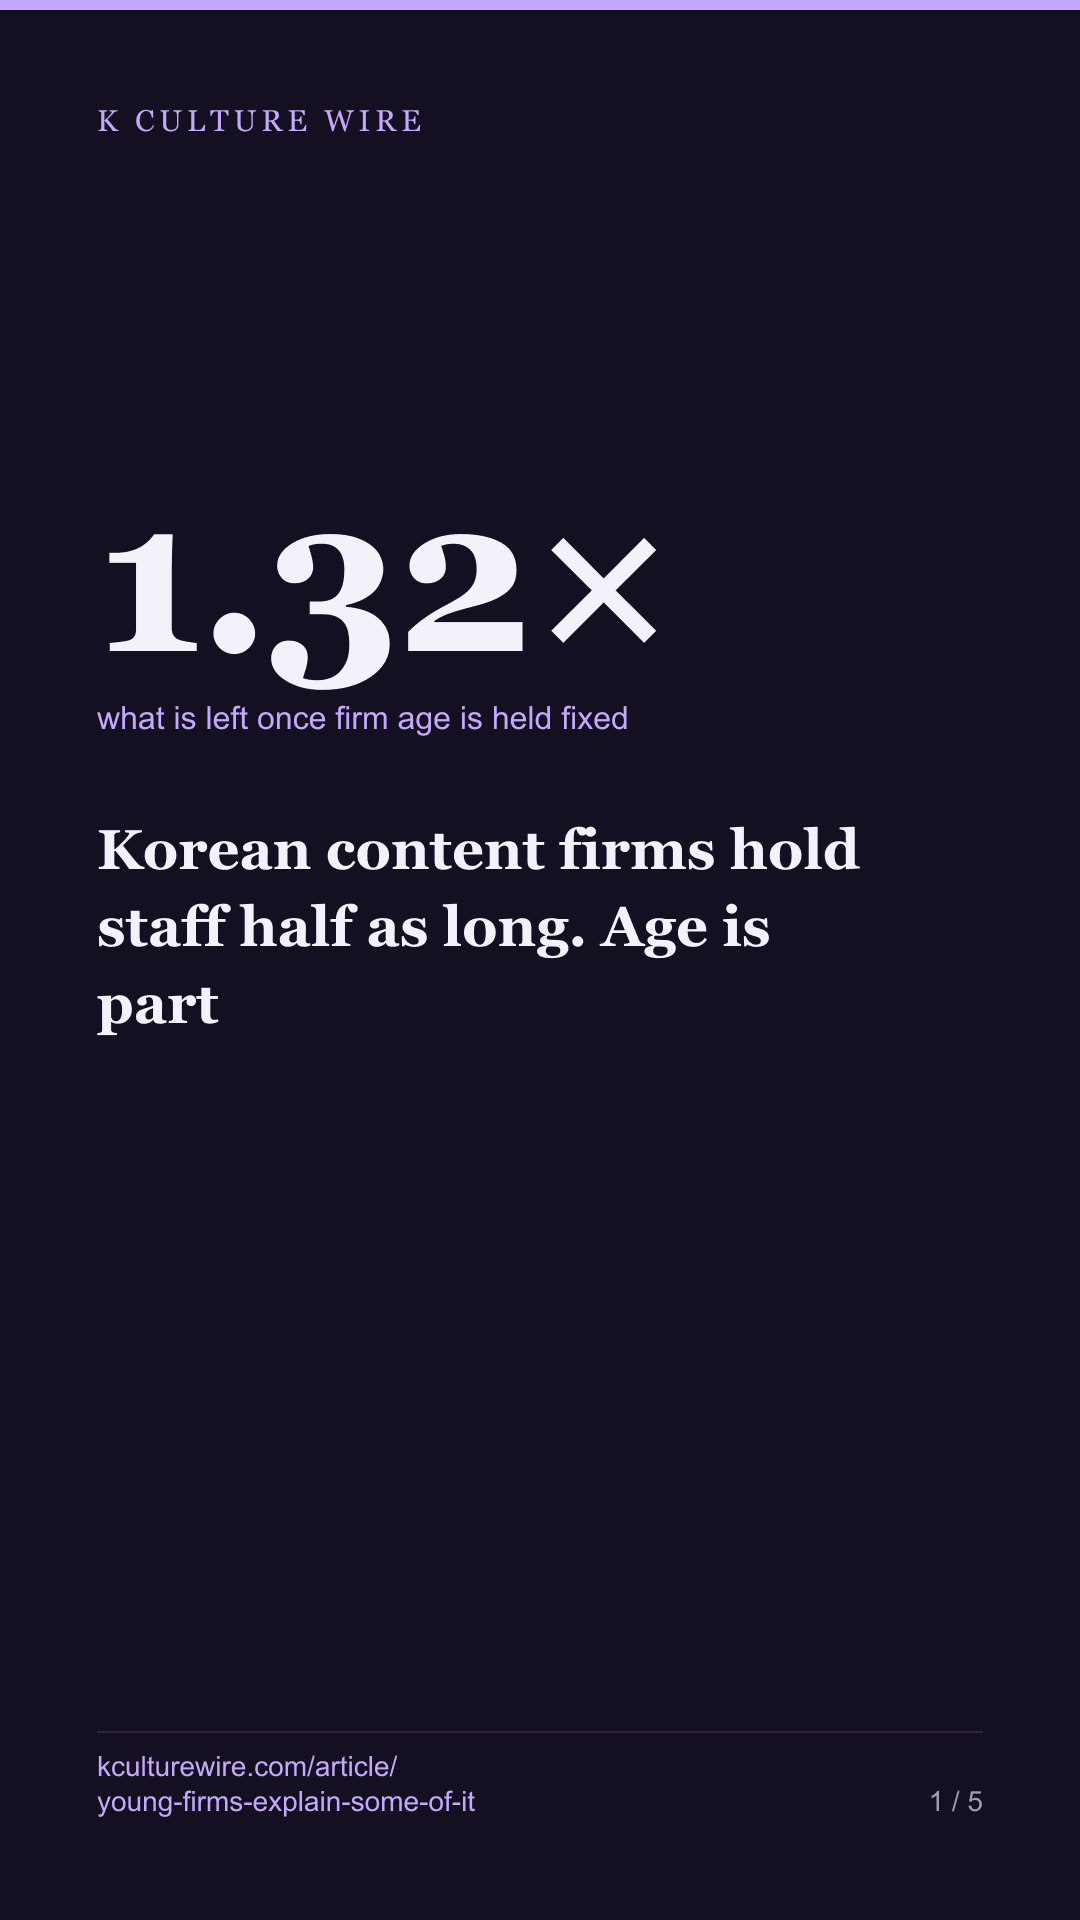
Korean content firms hold staff half as long. Age is part
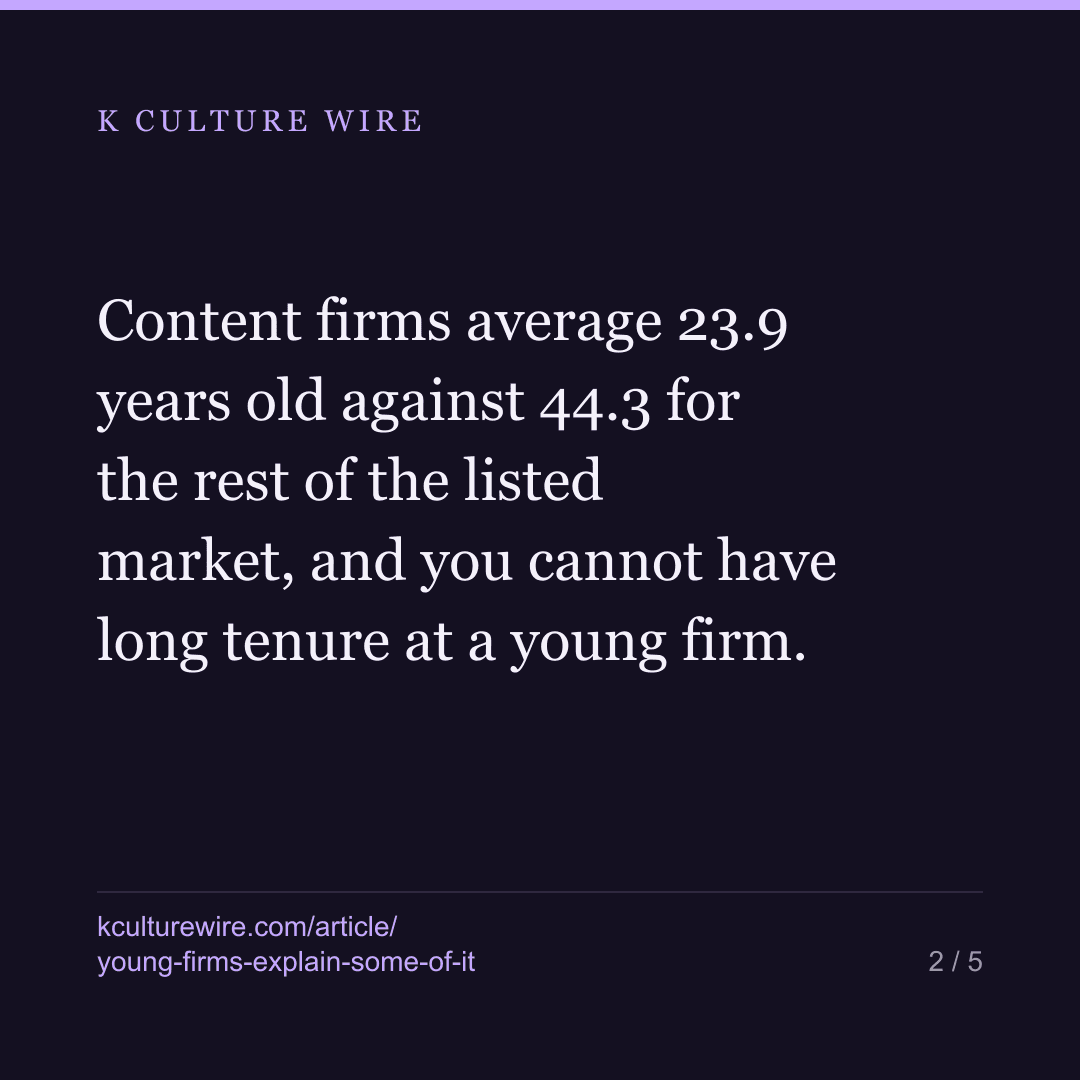
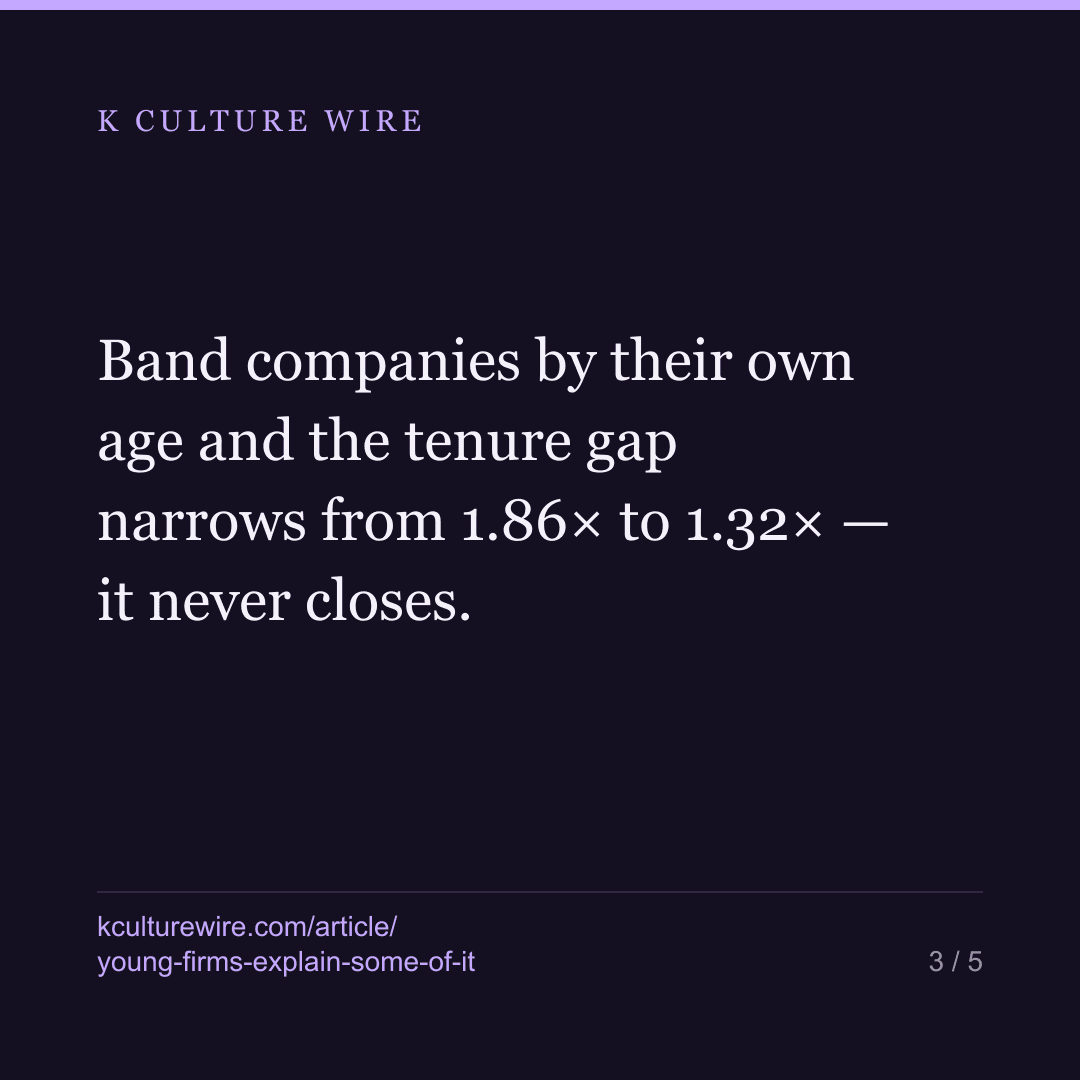
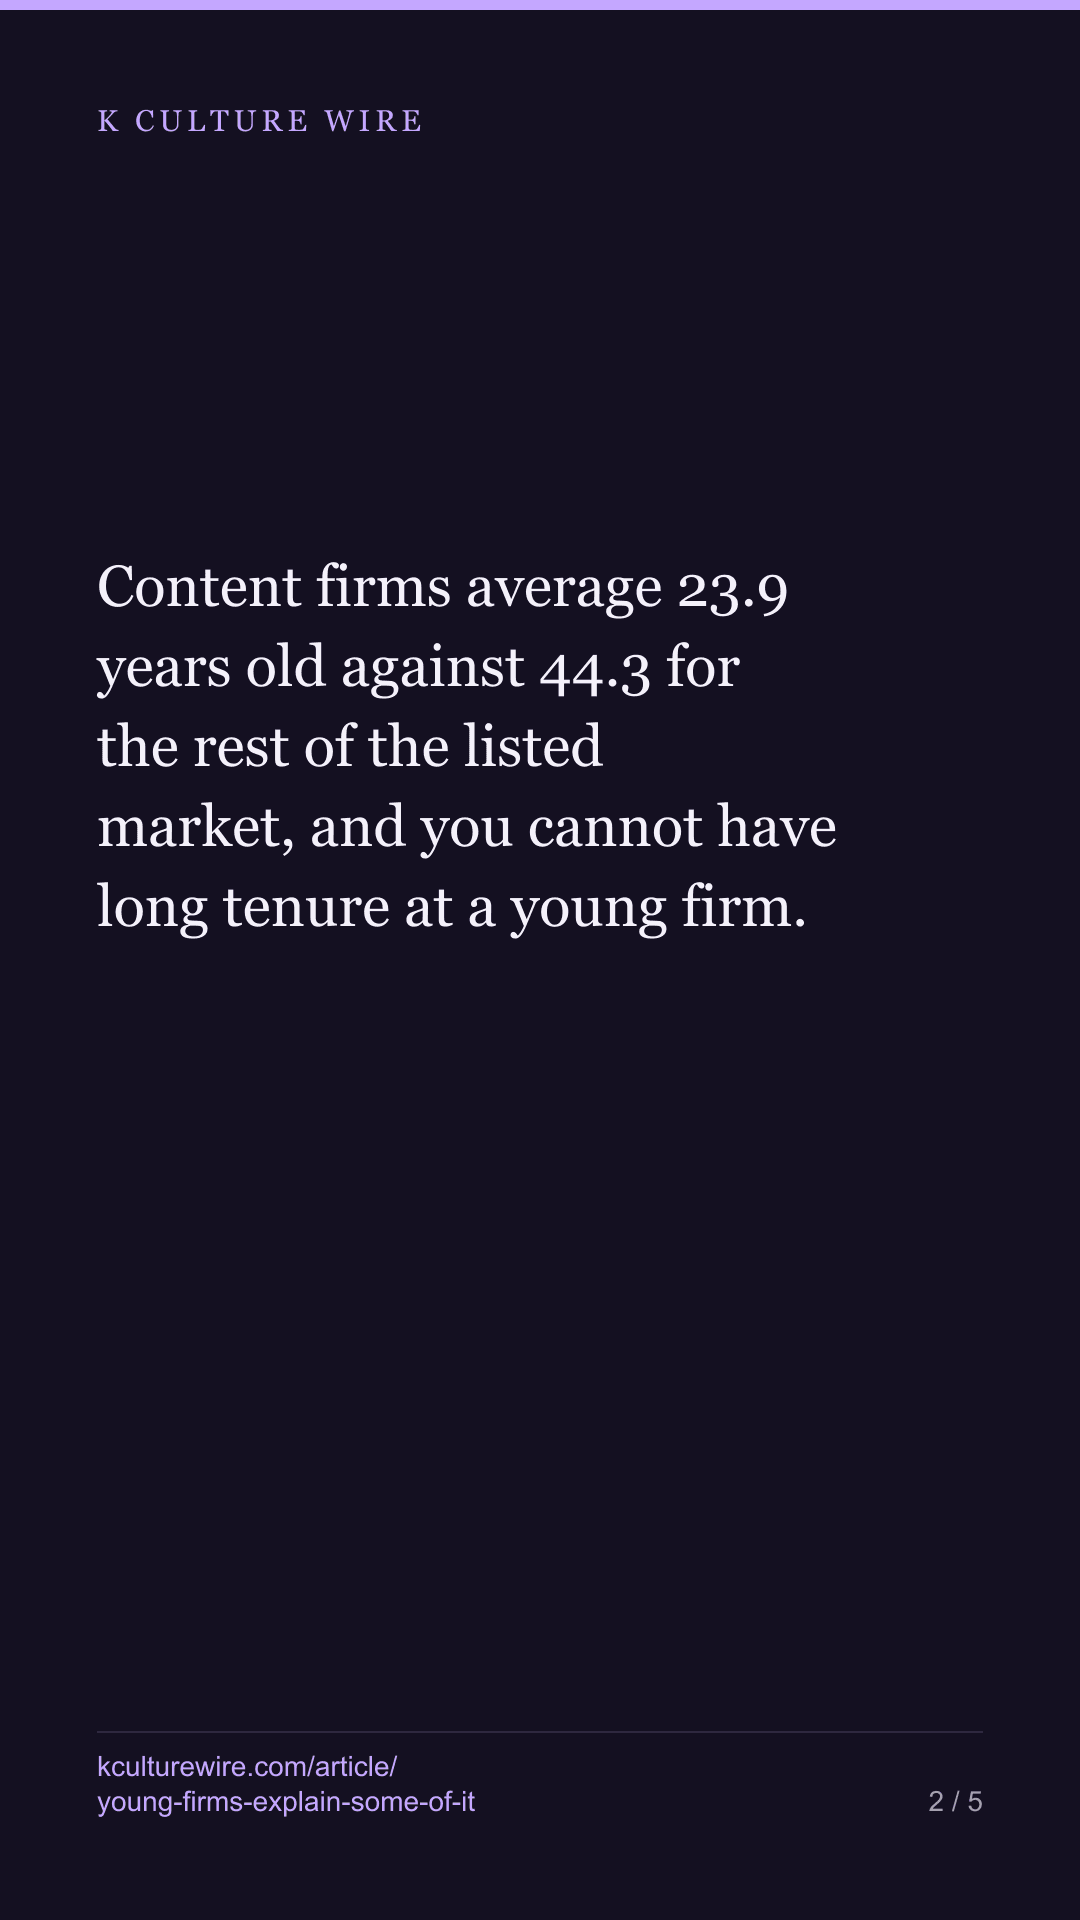
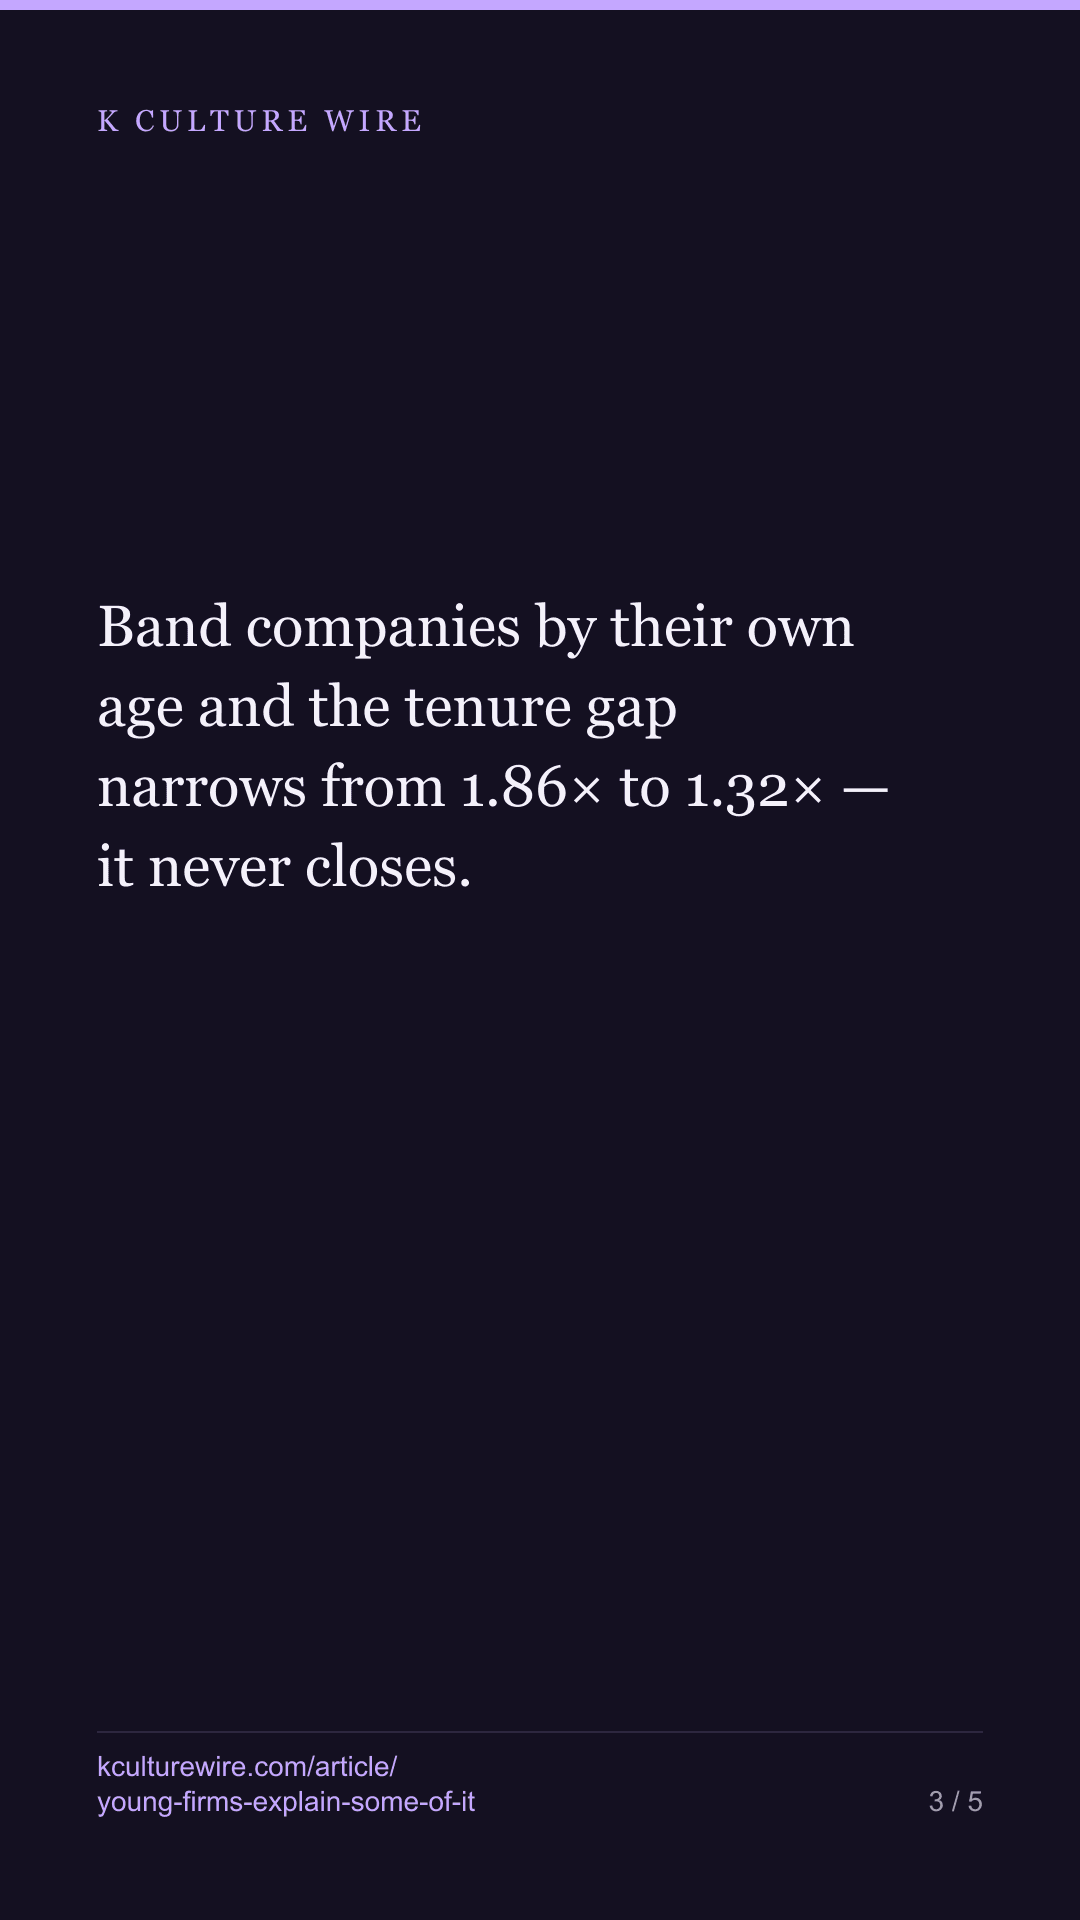
Content firms average 23.9 years old against 44.3 for the rest of the listed market, and you cannot have long tenure at a young firm. Band companies by their own age and the tenure gap narrows from 1.86× to 1.32× — it never closes.
The table this is written from: /industry
We have already published that Korean listed content companies hold staff 6.18 years against 11.29 years across the listed market. It is one of the numbers people quote back at us.
There is a column in the same file we had never used: how old each company is. And it changes how that comparison should be read.
Content companies are young companies
| Average tenure | Average firm age | |
|---|---|---|
| Content (248 firms) | 6.18 years | 23.9 years |
| Everything else (2,505 firms) | 11.49 years | 44.3 years |
A twenty-four-year-old company cannot have staff averaging eleven years of service without almost everyone having joined at the start. Part of the tenure gap is arithmetic, not culture, and until today we had not separated the two.
(The 11.49 here is the rest of the market with content firms taken out. Our industry page reports 11.29 for the whole listed market including them — the same data, a different denominator, and we would rather say so than have the two numbers look like a disagreement.)
Hold firm age fixed and most of the gap survives
| Companies aged | Content tenure | Everything else | Gap |
|---|---|---|---|
| under 15 years | 3.91 (68 firms) | 8.07 (449 firms) | 2.06× |
| 15 to 30 years | 6.18 (144 firms) | 9.37 (911 firms) | 1.52× |
| 30 to 50 years | 8.39 (35 firms) | 11.10 (624 firms) | 1.32× |
| 50 years or more | 9.50 (1 firm) | 13.60 (521 firms) | not read |
The headline ratio is 1.86×. Inside an age band it runs 1.32× to 2.06× and it is present in every band we can read.
So youth explains something — the gap is smallest among the oldest content firms — but it does not explain the thing away. A thirty-five-year-old content company still holds its staff a third less long than a thirty-five-year-old company of any other kind.
What we will not do with the last row
One content company in our data is fifty years old or more. We could compute a ratio for that band, print 1.43×, and it would look like the others.
It would be a reading of one company. The row is in the table with its firm count beside it and no ratio, which is the honest way to show a number we decline to calculate rather than quietly dropping the row and leaving three tidy lines.
And why the rest of the gap exists — we do not know
Project-based hiring, smaller payrolls, pay levels and the ordinary churn of a young industry are all plausible, and none of them is separated by these figures. What we have is a size: about a third to a half of the raw difference is firm age, and the rest is something else.
Anyone who tells you which, from this data, is guessing. We would need hiring and leaving dates rather than a single average, and Korean disclosure does not carry them.
Where these numbers come from
Sources
- Financial Supervisory Service (Korea) — DART annual report employee disclosures, filing year 2025 — average tenure, headcount, and years since incorporation for every listed company that discloses them · https://dart.fss.or.kr
What we checked
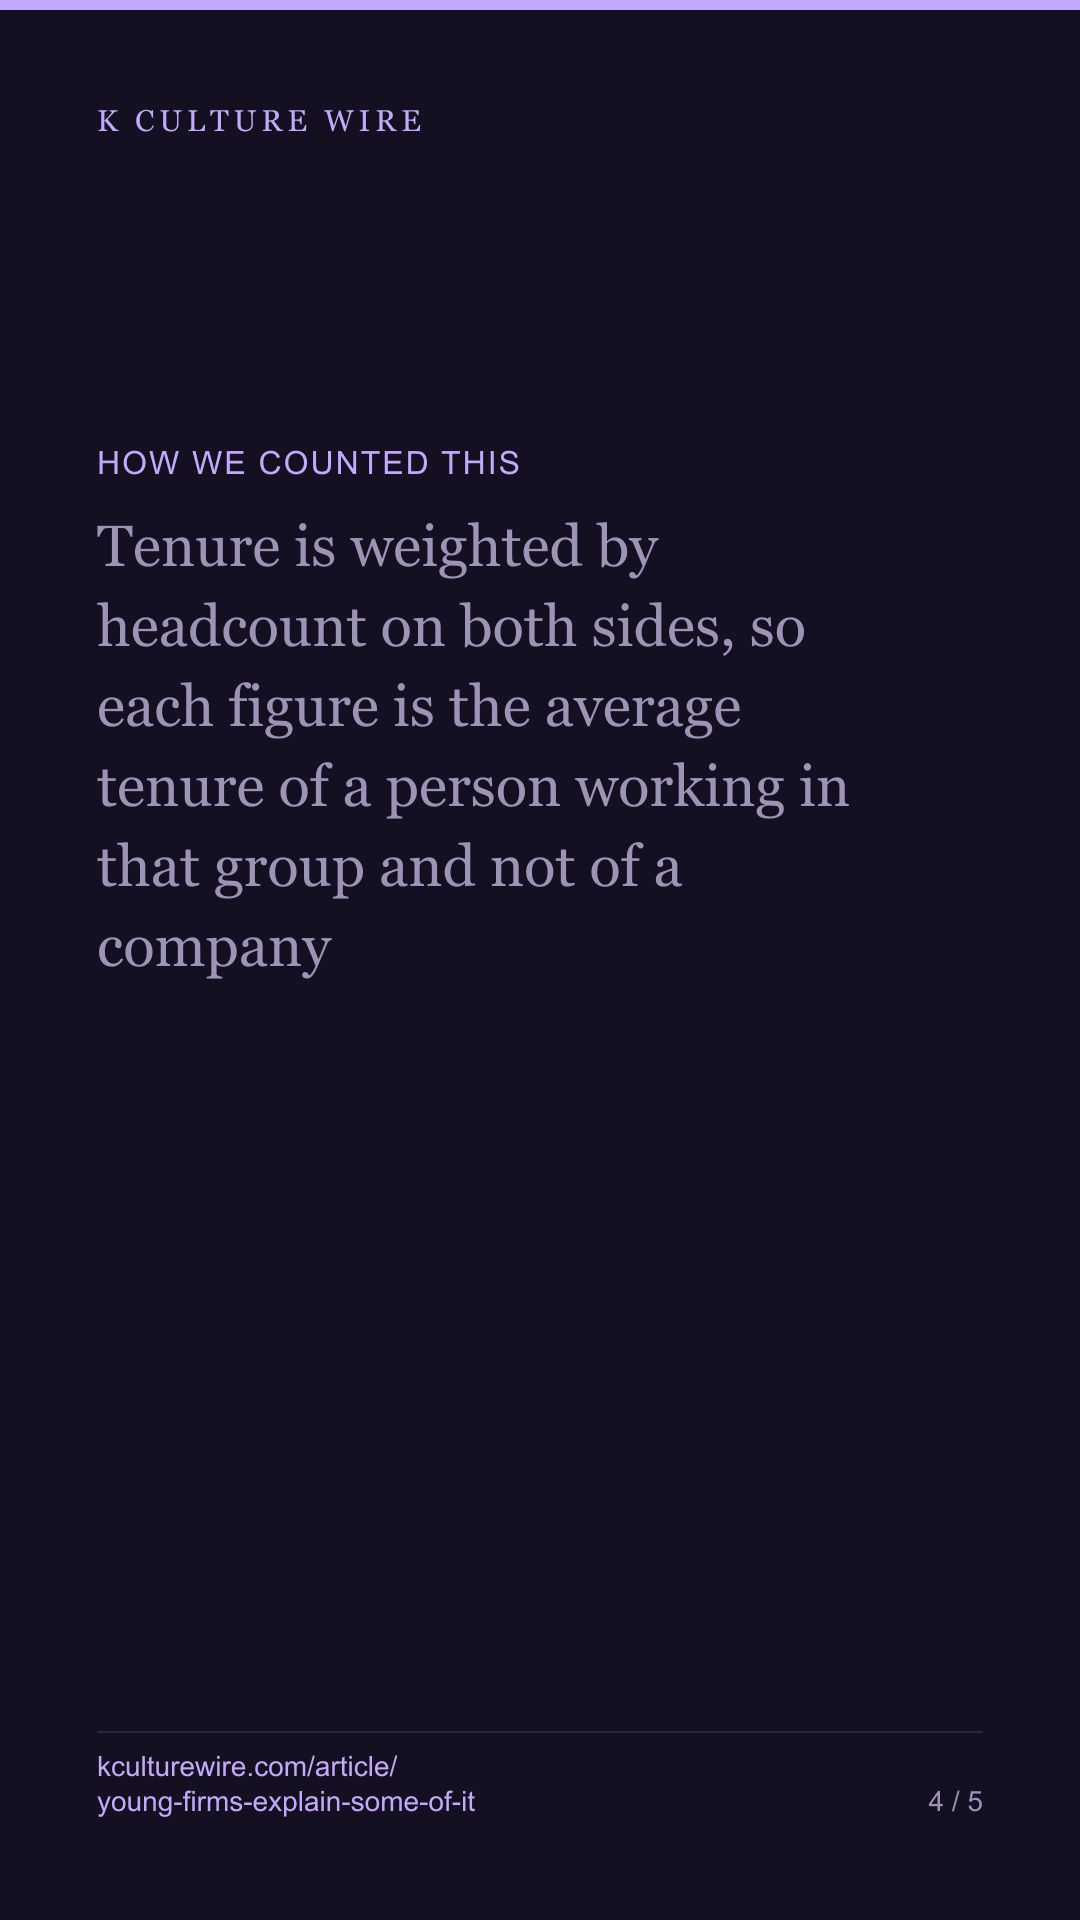
- Tenure is weighted by headcount on both sides, so each figure is the average tenure of a person working in that group and not of a company
- Only companies disclosing tenure, headcount and incorporation year are used — 2,753 of them — so the same rows feed every figure here
- The 50-years-or-more band holds one content company and is deliberately left unread; a ratio over one company is a reading of one company
What we left out, and why
- Unlisted companies. Much of Korean content production never files this, and nothing here describes those firms
- Any claim about why the remaining gap exists. Project-based hiring, company size and pay all plausibly matter and none of them is separated here
- Company names. This is a comparison of groups, not a league table of employers
- The oldest band's ratio, for the reason in the cross-checks
The data behind this
Written from the same data
Take this away — 10 cards
The figures in this article, as images. Free to repost with the address on them.
If you work in this business
Everything on this page is measured from the same weekly Netflix lists, per market and per title. We publish the pages free; what we sell is the same measurement cut to one company's catalogue — including the figures behind /industry and /workforce.
What a company sheet contains, and what it cannot tell you →