You cannot ask what a Korean hit leaves behind
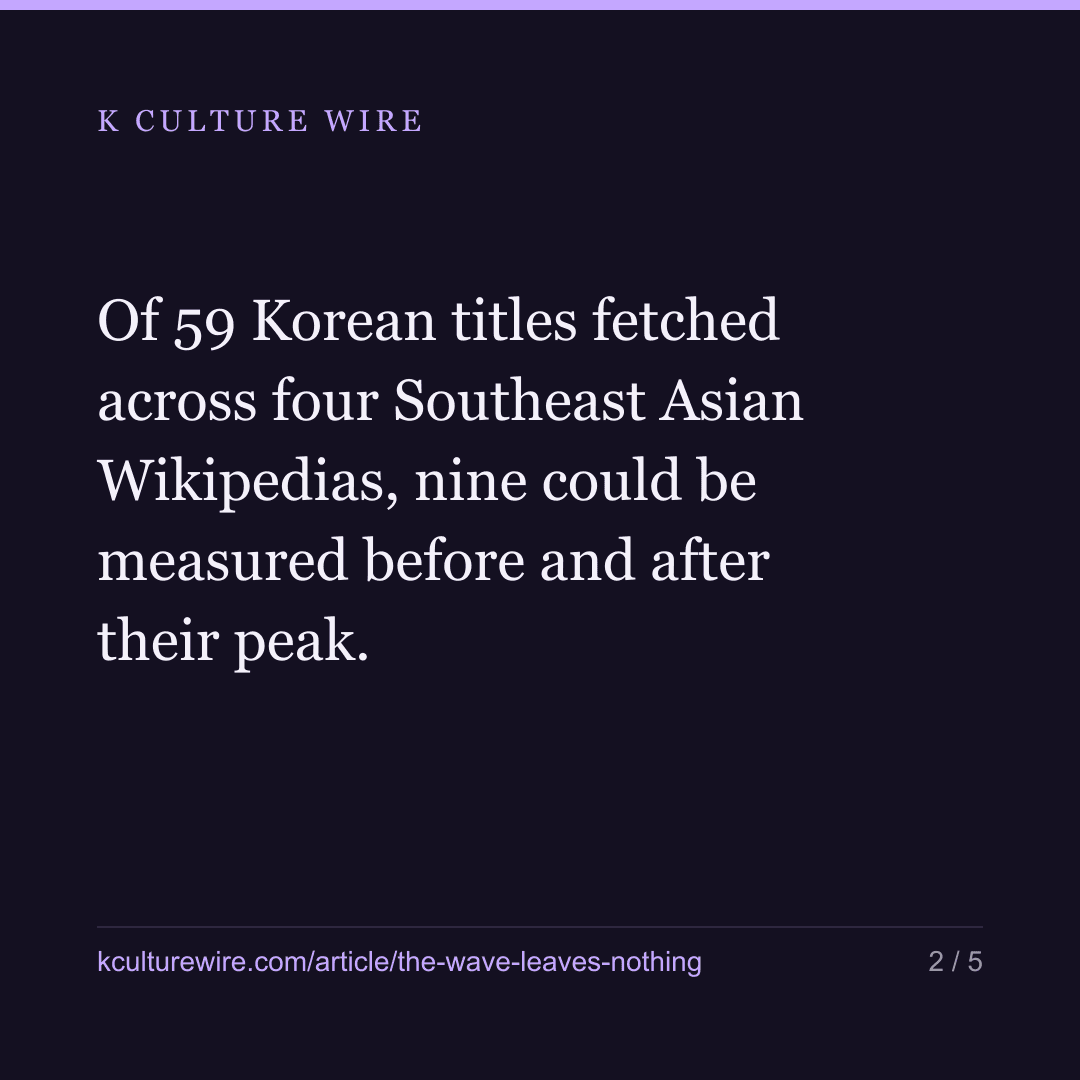
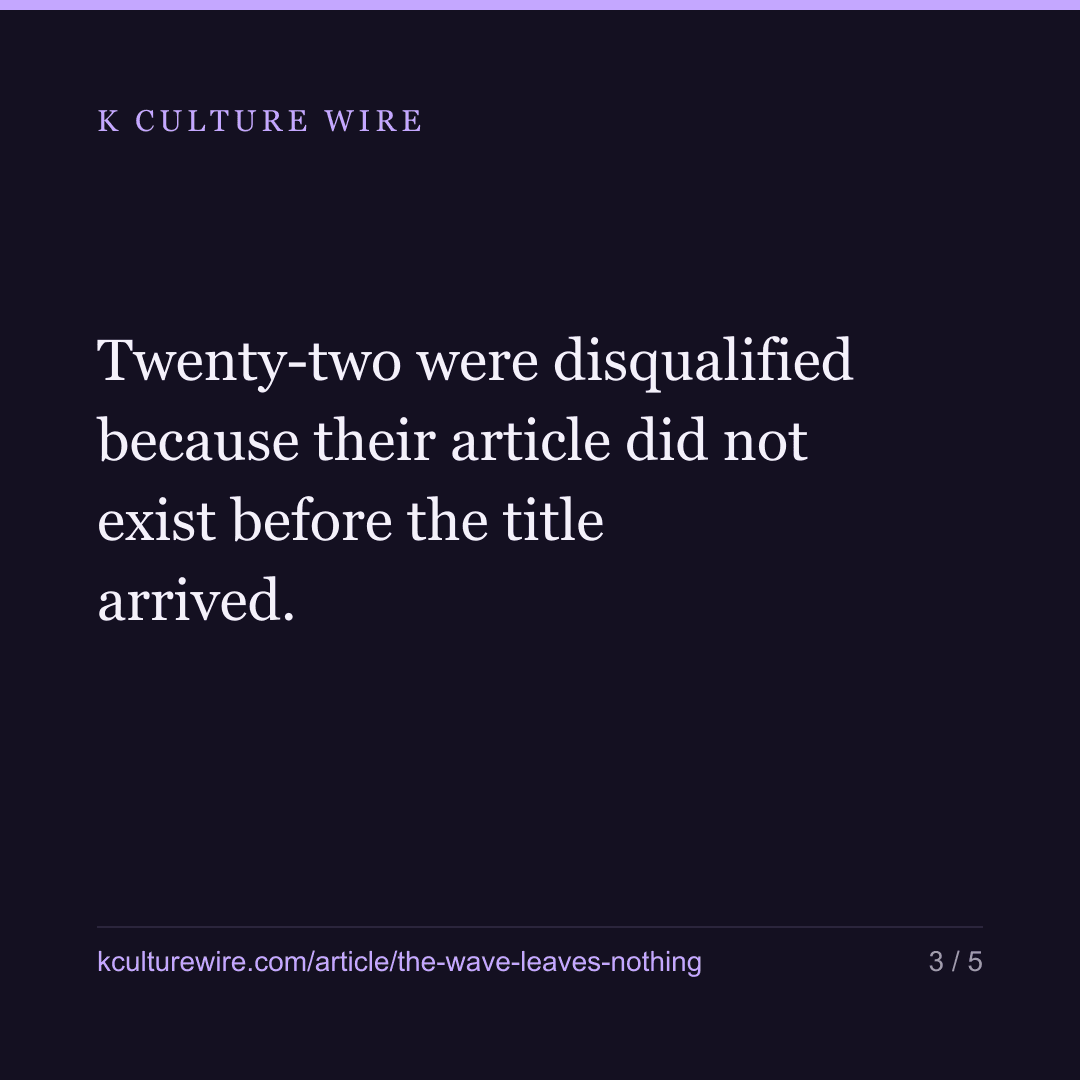
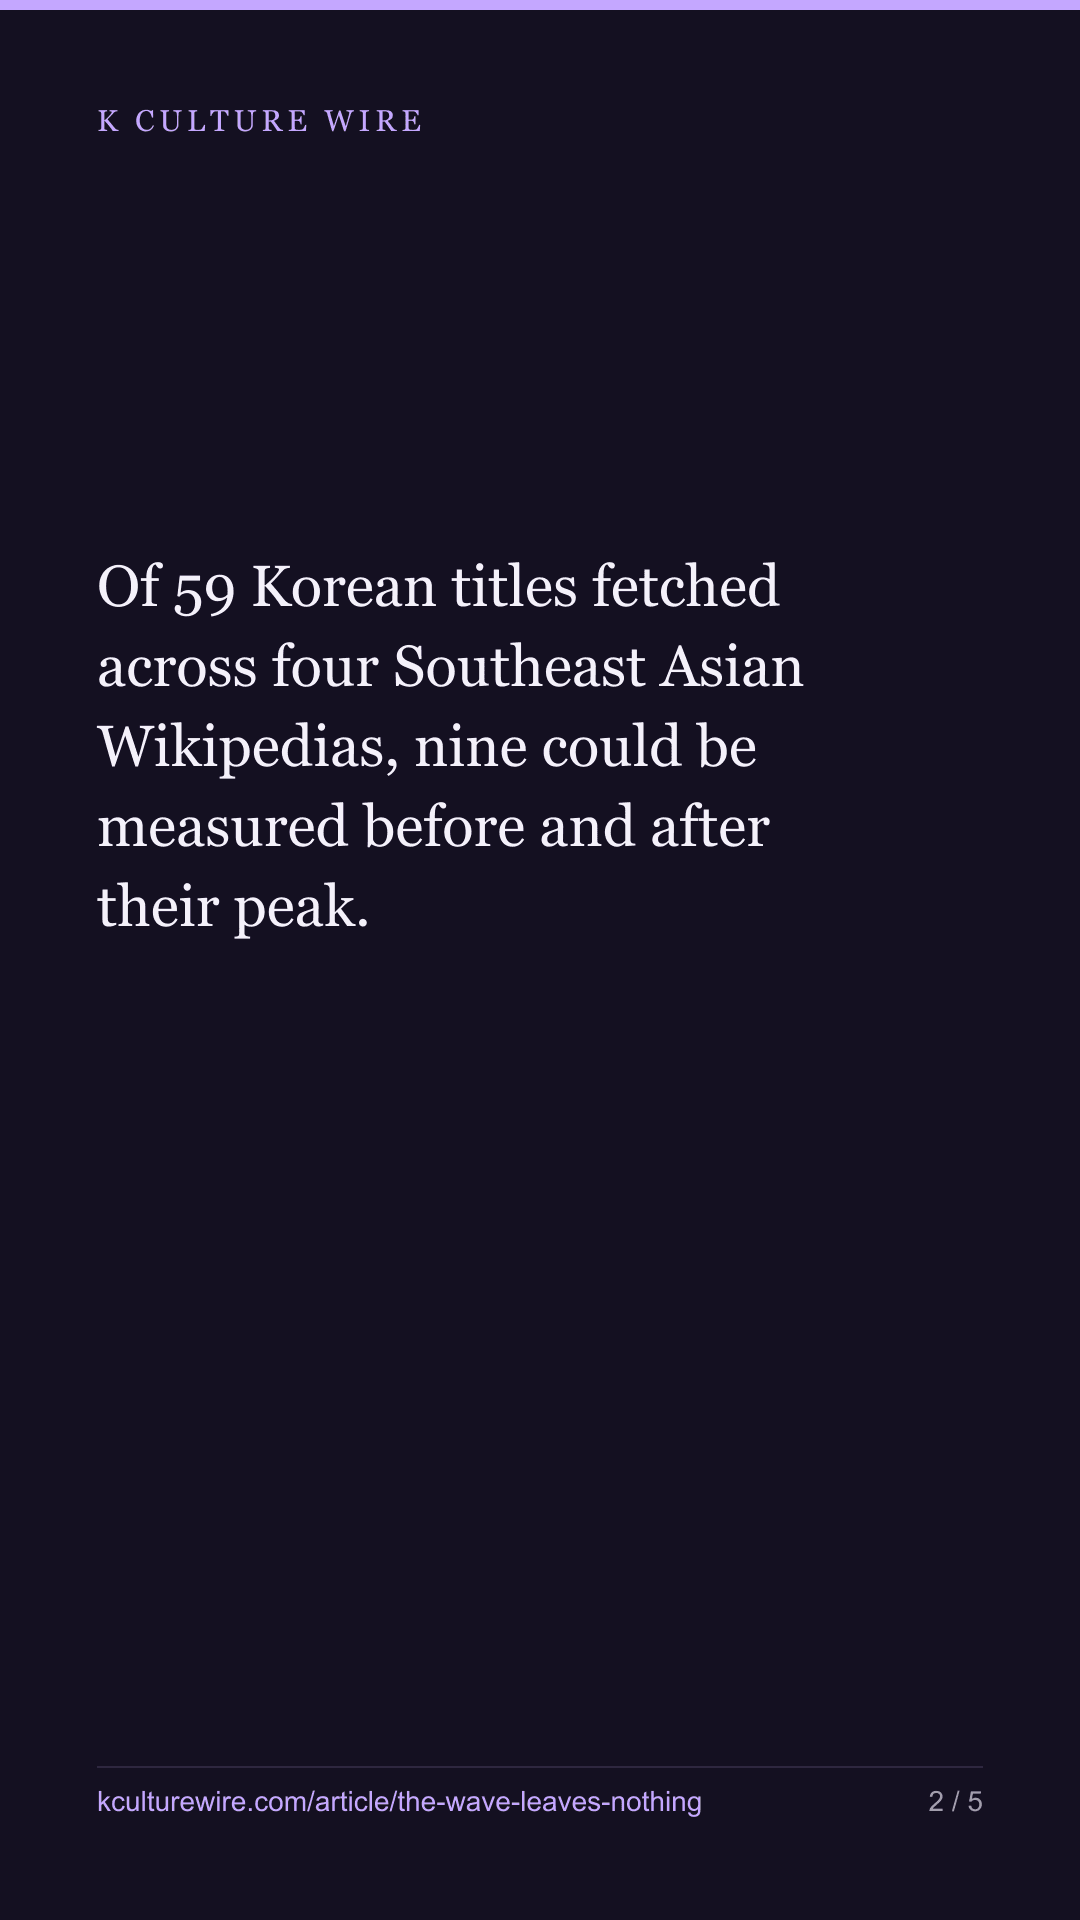
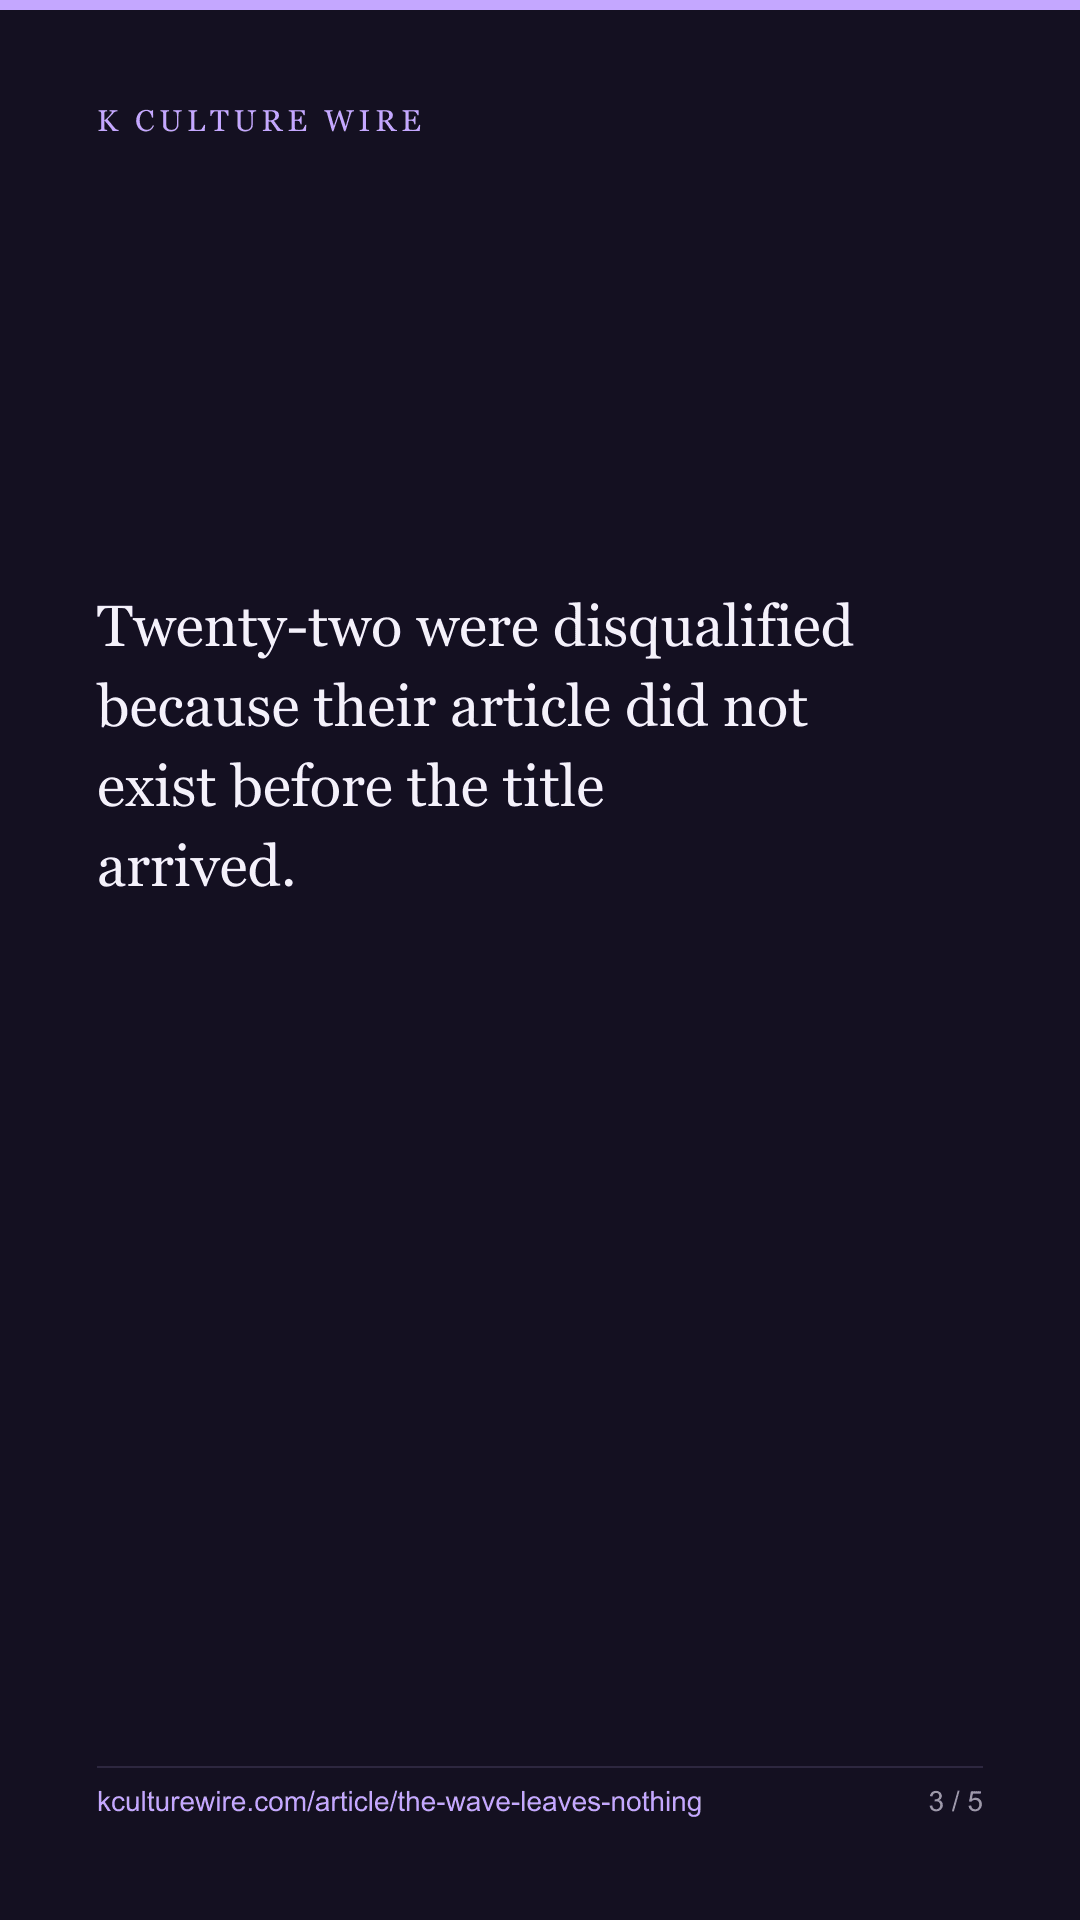
Of 59 Korean titles fetched across four Southeast Asian Wikipedias, nine could be measured before and after their peak. Twenty-two were disqualified because their article did not exist before the title arrived.
The table this is written from: /wave-and-floor
A Korean series lands, four Southeast Asian Wikipedias fill up with it, and then they empty again. Squid Game’s article was read 2,440 times per million reads of those editions in October 2021. By mid-2026 it sits under a hundred.
The question a studio would want answered is what the wave leaves behind. Is the floor higher after a hit than it was before?
For Squid Game, and for most of what Korea has exported in the last five years, that question has no answer. Not because the data is thin — because there is no before. The Indonesian, Vietnamese, Thai and Malay articles about Squid Game were created in September 2021, one month before the peak. The article is born with the show.
That is the finding. What follows is what is left once it is accounted for, and it is less than we thought this morning.
What we could measure, and what it cost
We fetched 59 Korean titles over 72 months. Nine survived to the table.
| Title | Peak | Peak ÷ floor | Floor before | Floor after | Change |
|---|---|---|---|---|---|
| Kingdom | 2025-02 | 4.6× | 43.2 | 69.3 | +60.2% |
| Descendants of the Sun | 2025-04 | 1.5× | 138.1 | 146.3 | +6.0% |
| Marry My Husband | 2025-07 | 2.2× | 67.7 | 69.1 | +2.0% |
| Reply 1988 | 2021-08 | 2.3× | 117.2 | 117.2 | 0.0% |
| Crash Landing on You | 2021-08 | 2.7× | 222.5 | 212.4 | −4.5% |
| My Name | 2024-01 | 1.8× | 45.0 | 33.5 | −25.7% |
| Goblin | 2021-10 | 1.2× | 224.0 | 159.1 | −29.0% |
| The Roundup | 2024-05 | 2.2× | 23.9 | 13.0 | −45.8% |
| The Handmaiden | 2022-09 | 1.5× | 116.1 | 61.1 | −47.4% |
Reads are per million reads of that Wikipedia, summed across the four editions. The floor is the six months before the peak and the six after, skipping two months either side because those are still the wave.
Median peak: 2.2 times the surrounding months. Median floor afterwards: −4.5%. Three of nine ended higher.
Notice what these nine have in common. Goblin is from 2016, Descendants of the Sun from 2016, Reply 1988 from 2015, The Handmaiden from 2016, Crash Landing from 2019. These are not hits arriving — they are back catalogue rising again. The only titles that can answer this question are the ones that already had a floor.
What changed between this morning and now
We published this earlier today with 35 titles and six in the table. The median floor change was −15.1%. Widening the set to 59 moved it to −4.5%.
Nothing was wrong with the first figure. It was the median of six numbers, and six is too few for a median to sit still — one title entering or leaving swings it. The honest reading is that a set this small could not have told us the difference between a real fall and no fall, and now that it is larger, what is left looks much more like no fall.
The same widening left our other finding untouched: the median half-life of a Korean title’s wave stayed at two months as the set went from 16 measurable titles to 26. One number held and one did not, which is worth knowing about both of them.
The twenty-two with no before at all
| Why not | How many |
|---|---|
| The article did not exist for the first part of the window | 22 |
| Not enough months across the four editions | 15 |
| The peak sits too close to the end of the window | 7 |
| The peak sits too close to the start of the window | 3 |
| The floor before the wave was too thin to take a percentage | 3 |
The first row is the one that matters and it grew faster than the table did. Squid Game, All of Us Are Dead, Hellbound, Alchemy of Souls, D.P., Lovely Runner and sixteen others have no measurable floor because their articles were created as the titles launched. A percentage change from nothing is not a small number, it is not a number.
Physical: 100 is the clearest case of why the last rule exists. Its floor before the peak was 1.3 per million and afterwards 2.4 — an 82.7% rise between two numbers that are both, in practice, nobody.
The peaks are spread out, which the question requires
Nine peaks, eight clusters, the largest holding one title. August 2021, October 2021, September 2022, January 2024, May 2024, February 2025, April 2025, July 2025.
Each title rose in its own month. An earlier version of this page, built on a 48-month window, had five peaks landing in three clusters of neighbouring months, which meant we might have been measuring those months rather than those titles. That objection is answered.
What this cannot tell you
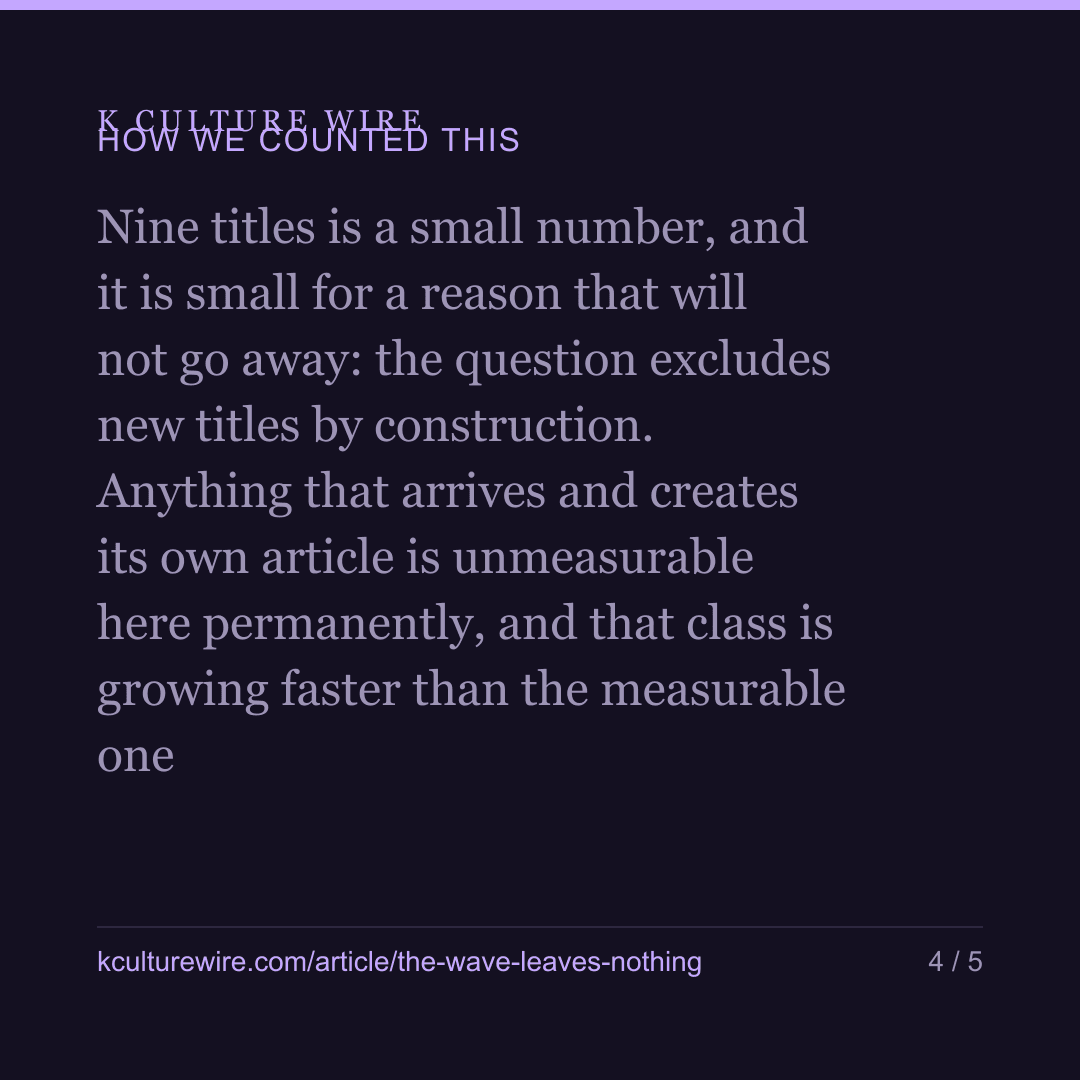
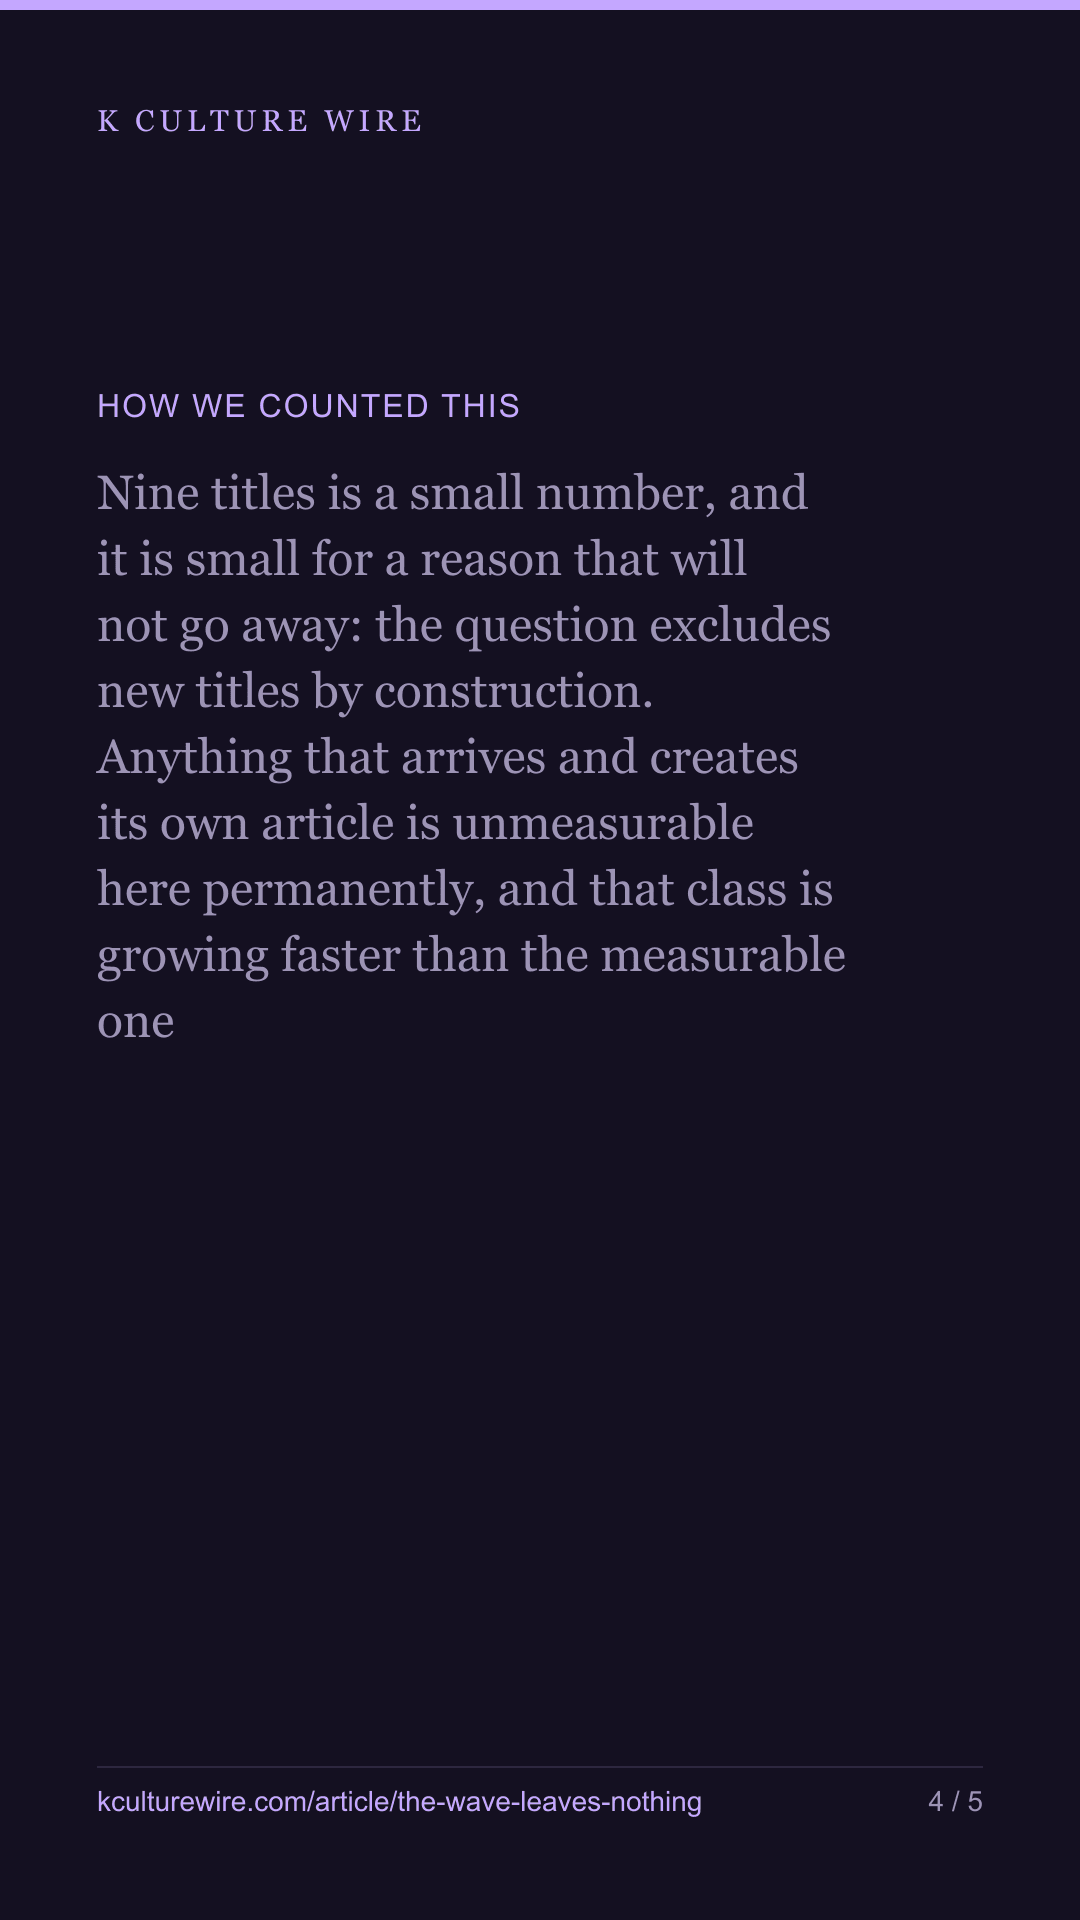
Nine titles is a small number, and it is small for a reason that will not go away: the question excludes new titles by construction. Anything that arrives and creates its own article is unmeasurable here permanently, and that class is growing faster than the measurable one.
The titles were chosen as ones we expected to have had a wave, not the most-read Korean titles and not a random sample.
A read is not a viewer. And we are not saying the wave caused the floor to move in either direction — twelve months either side of a peak contain everything else that happened in those months.
What we can say, and it is narrower than it was this morning: among Korean titles old enough to have a floor, the months after a wave look about the same as the months before it. Back catalogue that gets rediscovered does not settle higher afterwards. It settles roughly where it was.
The full tables, including every title we had to drop and why, are on wave and floor.
Where these numbers come from
Sources
- Wikimedia — Pageviews API, Indonesian, Vietnamese, Thai and Malay editions, monthly, August 2020 to June 2026
What we checked
- Nine titles is a small number, and it is small for a reason that will not go away: the question excludes new titles by construction. Anything that arrives and creates its own article is unmeasurable here permanently, and that class is growing faster than the measurable one
- The titles were chosen as ones we expected to have had a wave, not the most-read Korean titles and not a random sample
- A read is not a viewer, and we are not saying the wave caused the floor to move in either direction — twelve months either side of a peak contain everything else that happened in those months
- What this can say is narrower than the headline: among Korean titles old enough to have a floor, the months after a wave look about the same as the months before it
The data behind this
Written from the same data
Take this away — 10 cards
The figures in this article, as images. Free to repost with the address on them.


If you work in this business
Everything on this page is measured from the same weekly Netflix lists, per market and per title. We publish the pages free; what we sell is the same measurement cut to one company's catalogue — including the figures behind /wave-and-floor and /half-life.
What a company sheet contains, and what it cannot tell you →