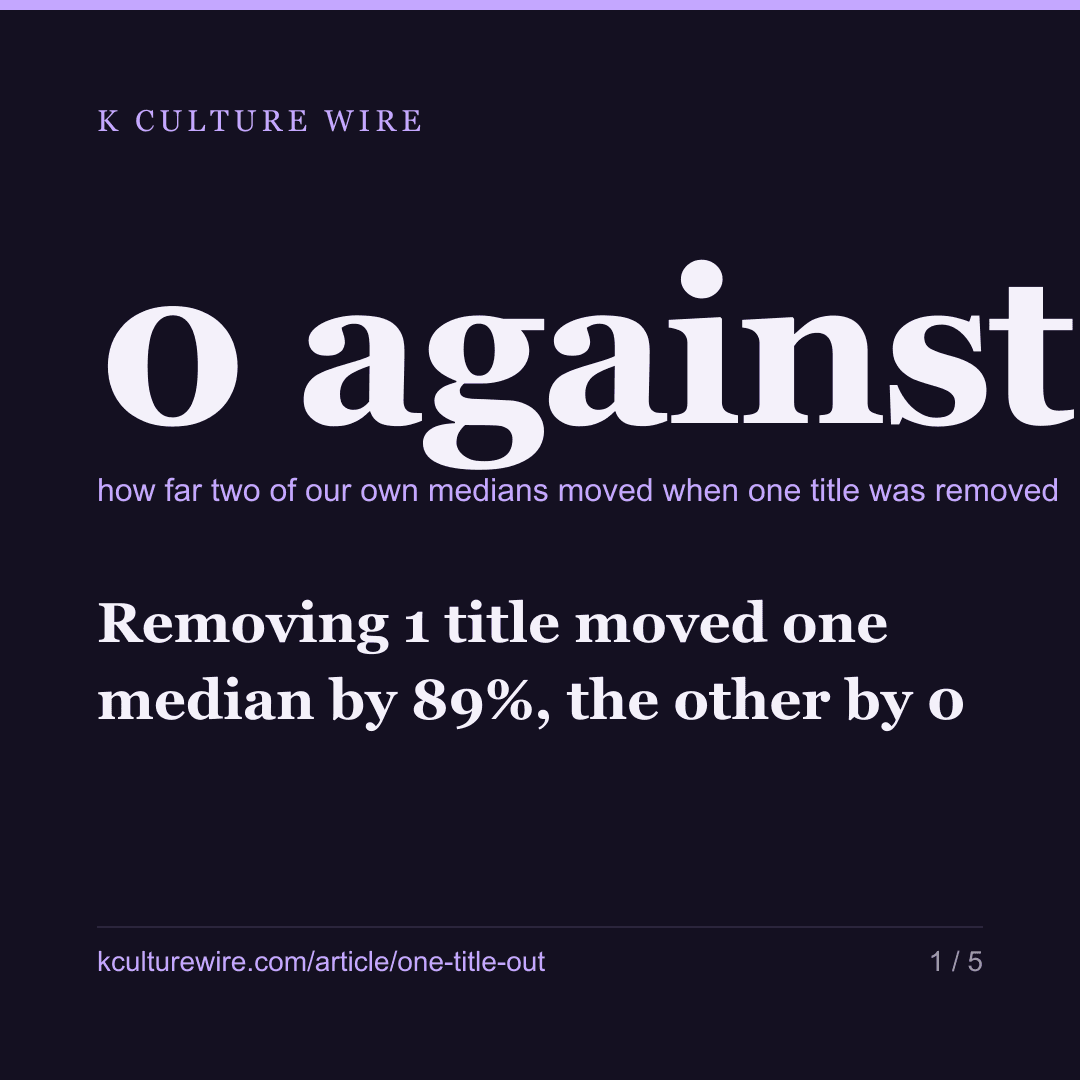
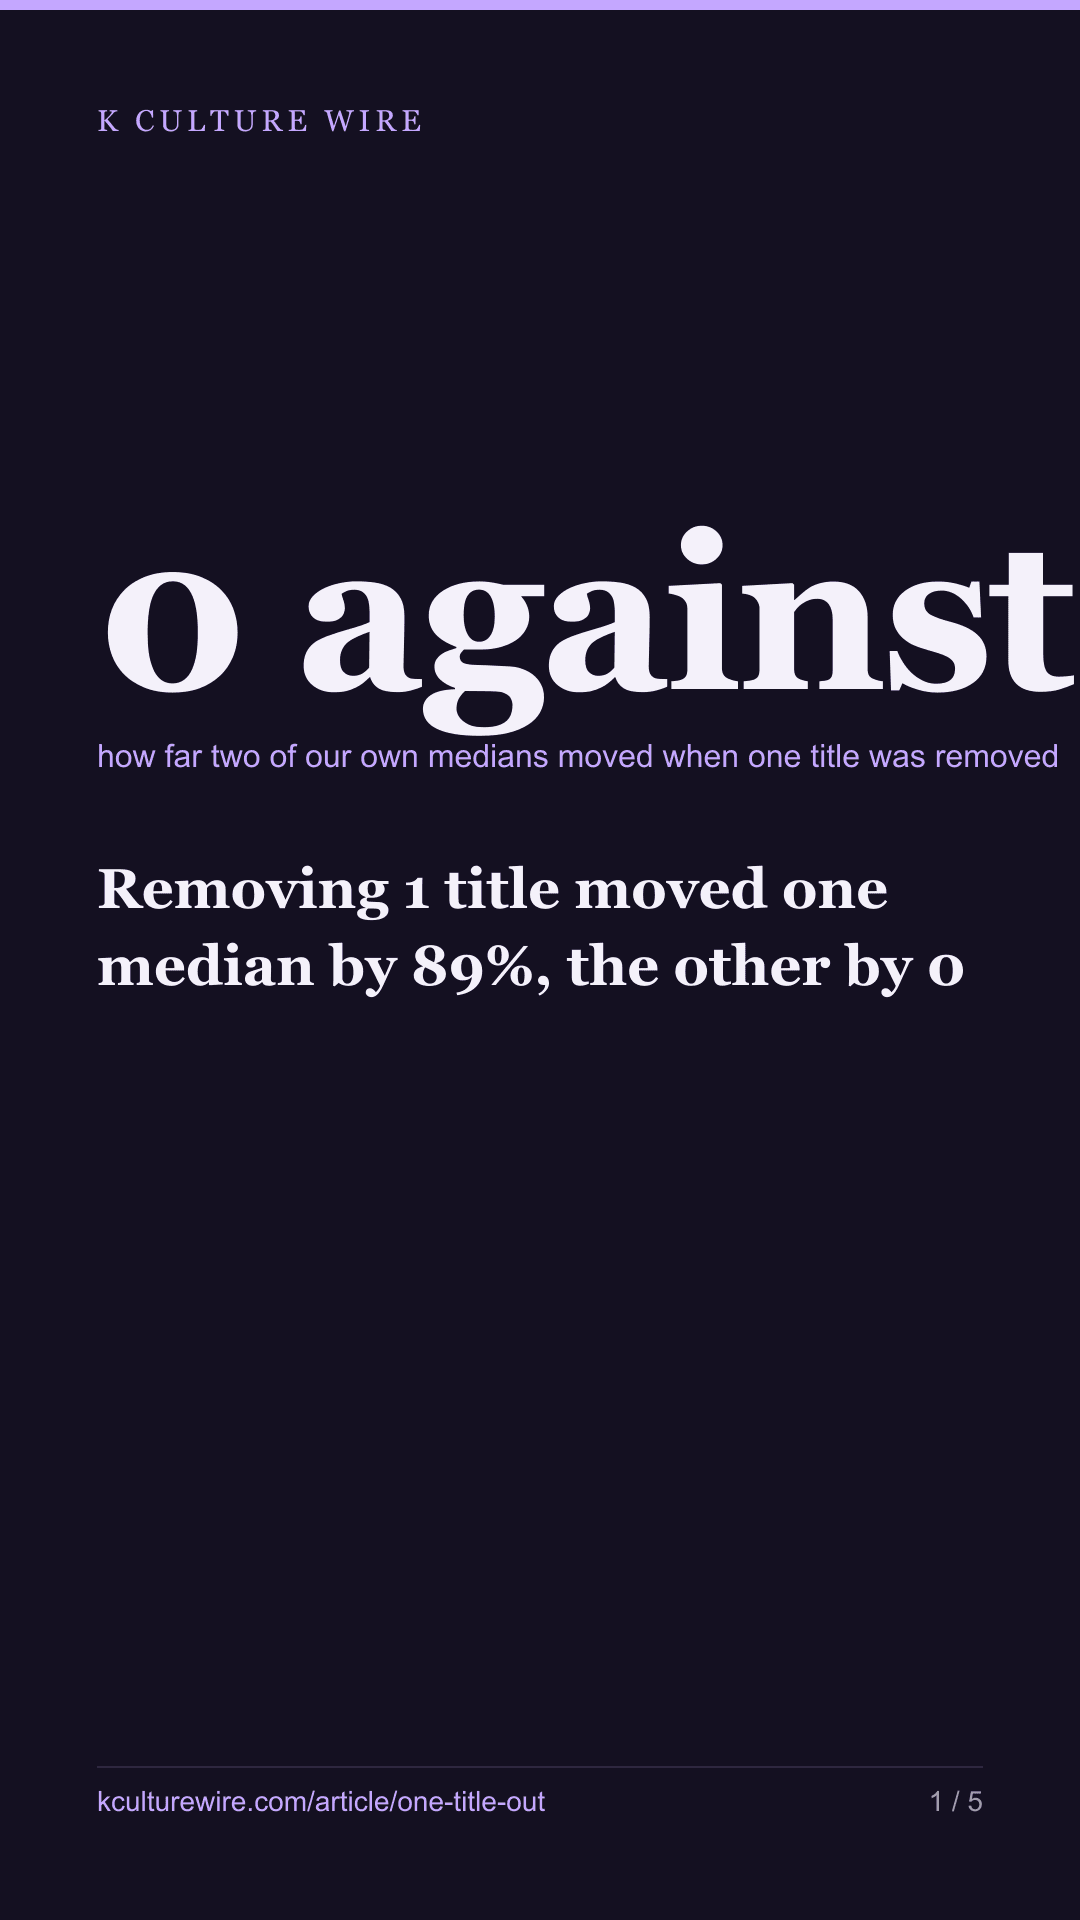
Removing 1 title moved one median by 89%, the other by 0
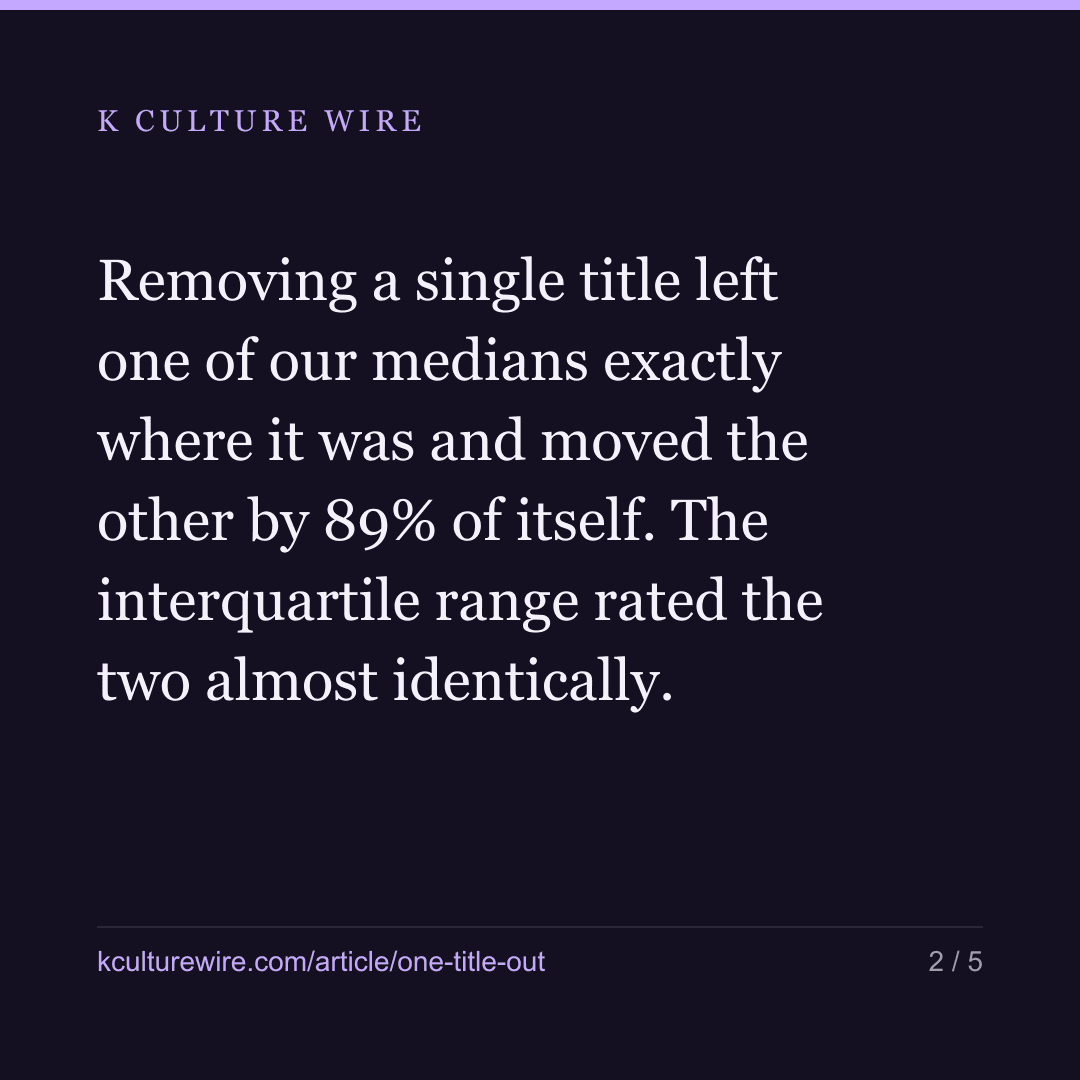
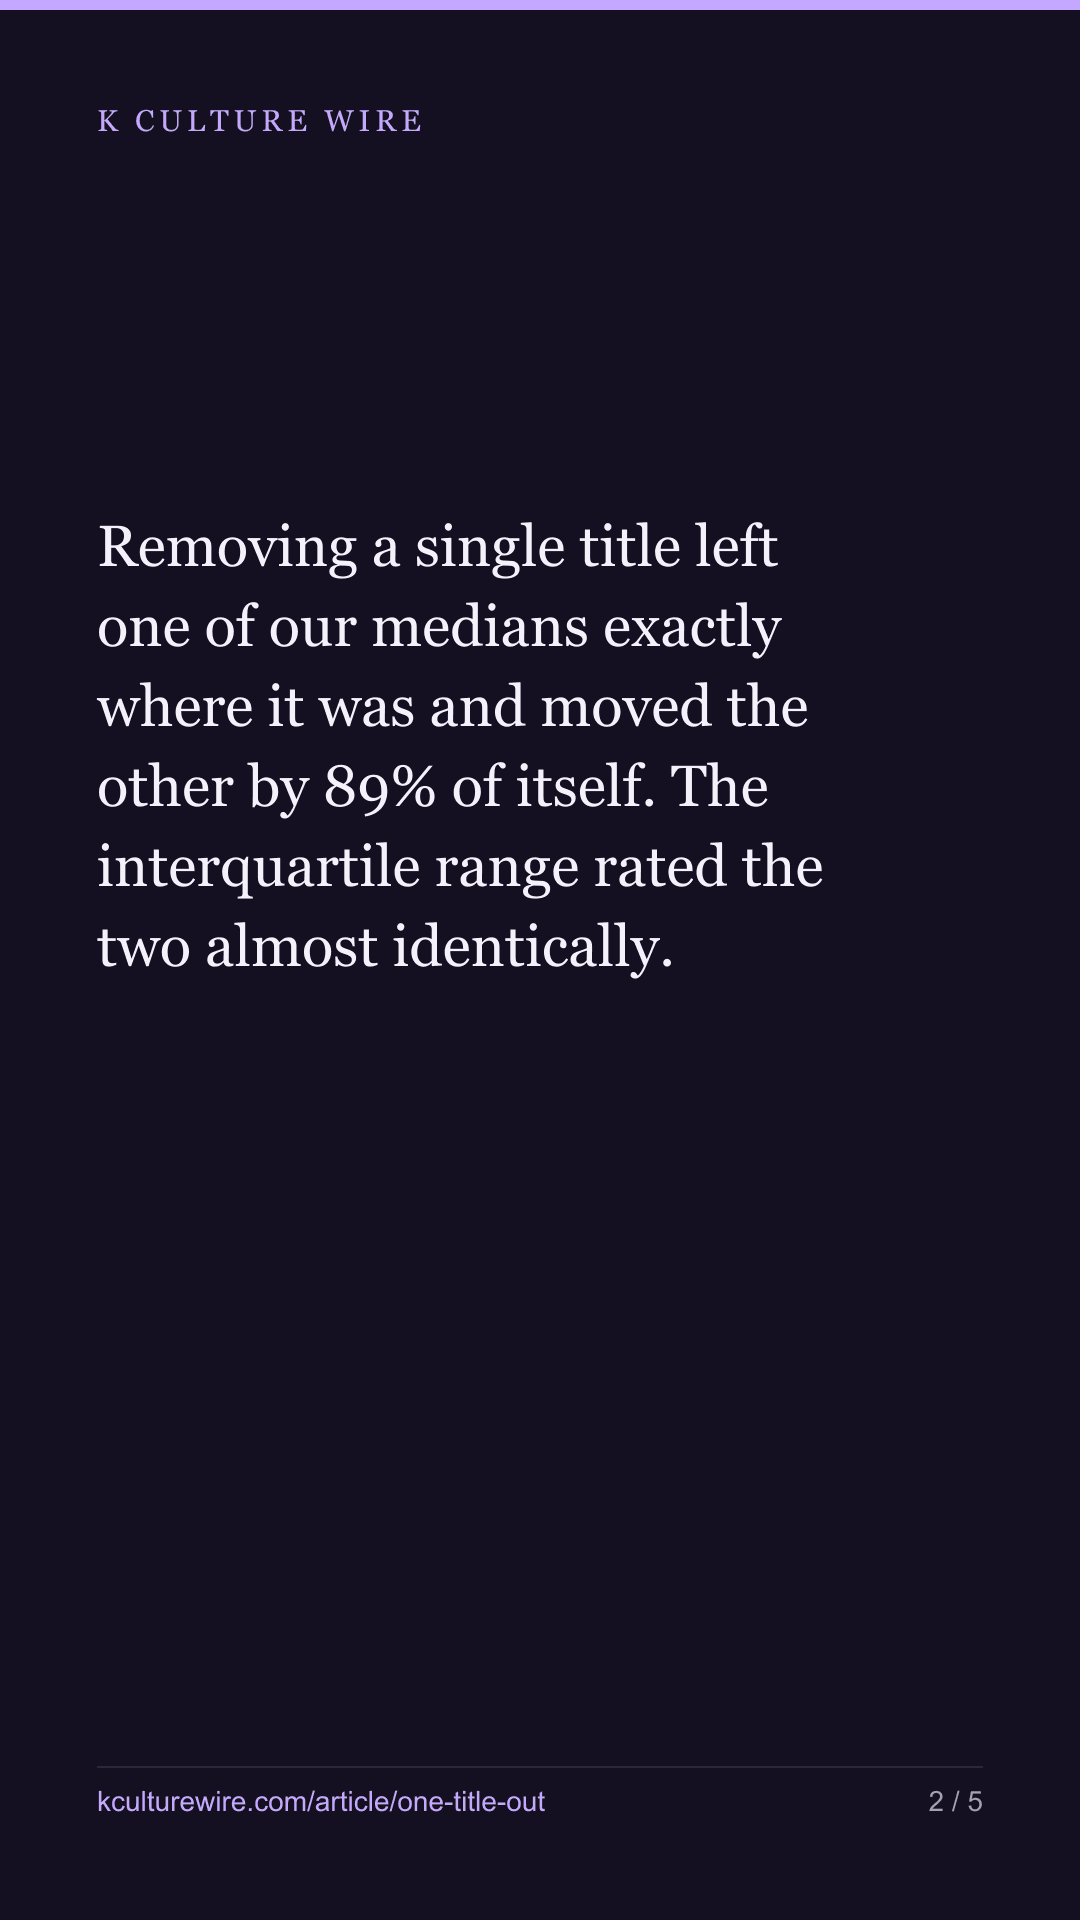
Removing a single title left one of our medians exactly where it was and moved the other by 89% of itself. The interquartile range rated the two almost identically. We ran neither before publishing.
The table this is written from: /one-out
Earlier today we published two findings drawn from the same set of Korean titles in four Southeast Asian Wikipedias.
The first: a title loses half its readers in a median of two months. The second: after that wave passes, the floor it leaves is a median 15.1% below where it started.
We then widened the sample from 35 titles to 59, for a reason that had nothing to do with either. The half-life stayed at two months. The floor change fell to −4.5%, and we corrected the article that carried it — the second correction on that piece in one day.
The uncomfortable part is not the correction. It is that we could have known.
Remove one, look again
Take the numbers behind a median. Remove one of them and recompute. Do that once for every number, and look at how far the answer travels.
| Finding | Titles | Median | Range without any one title | Swing ÷ median |
|---|---|---|---|---|
| Months to lose half the readers | 16 | 2 | 2 to 2 | 0× |
| Change in the floor after a wave | 5 | −6.7% | −11.8% to −5.8% | 0.89× |
Those are the numbers as they stood when we hit publish.
The half-life median did not move. Not by a tenth of a month, for any of the sixteen titles removed. Nothing in that sample was propping it up.
The floor-change median could be pushed anywhere across a six-point range by dropping one observation out of five. Its swing was 89% of its own value. We published it as a finding.
What the widening did
| Finding | Then | Now | Titles |
|---|---|---|---|
| Months to lose half the readers | 2 | 2 | 16 → 26 |
| Change in the floor after a wave | −15.1% | −4.5% | 5 → 9 |
The check predicted both outcomes. It needed no new data, no simulation, no assumption about how the numbers are distributed. It needed the numbers we already had and about a line of code.
The check we would normally have used says the opposite
If you asked a statistician how spread out two samples are, they would reach for the interquartile range. On these two samples it says they are nearly the same:
| Finding | IQR ÷ median | Leave-one-out swing ÷ median |
|---|---|---|
| Months to lose half the readers | 1.5× | 0× |
| Change in the floor after a wave | 1.8× | 0.89× |
1.5 against 1.8 is no difference at all. 0 against 0.89 is the difference between a finding and a guess.
The reason is worth stating plainly. The five values behind our floor-change median were −27.8, −16.9, −6.7, −5.0 and +60.2. The interquartile range is built from the middle of that list; it never has to look at +60.2, and it does not. Leave-one-out asks what the answer becomes when +60.2 is the value removed — which is precisely the risk a five-item sample carries.
This is not an argument against the interquartile range. It is an argument that “how spread out is this sample” and “how much does one observation move my answer” are different questions, and we had been treating them as the same one.
What this does not do
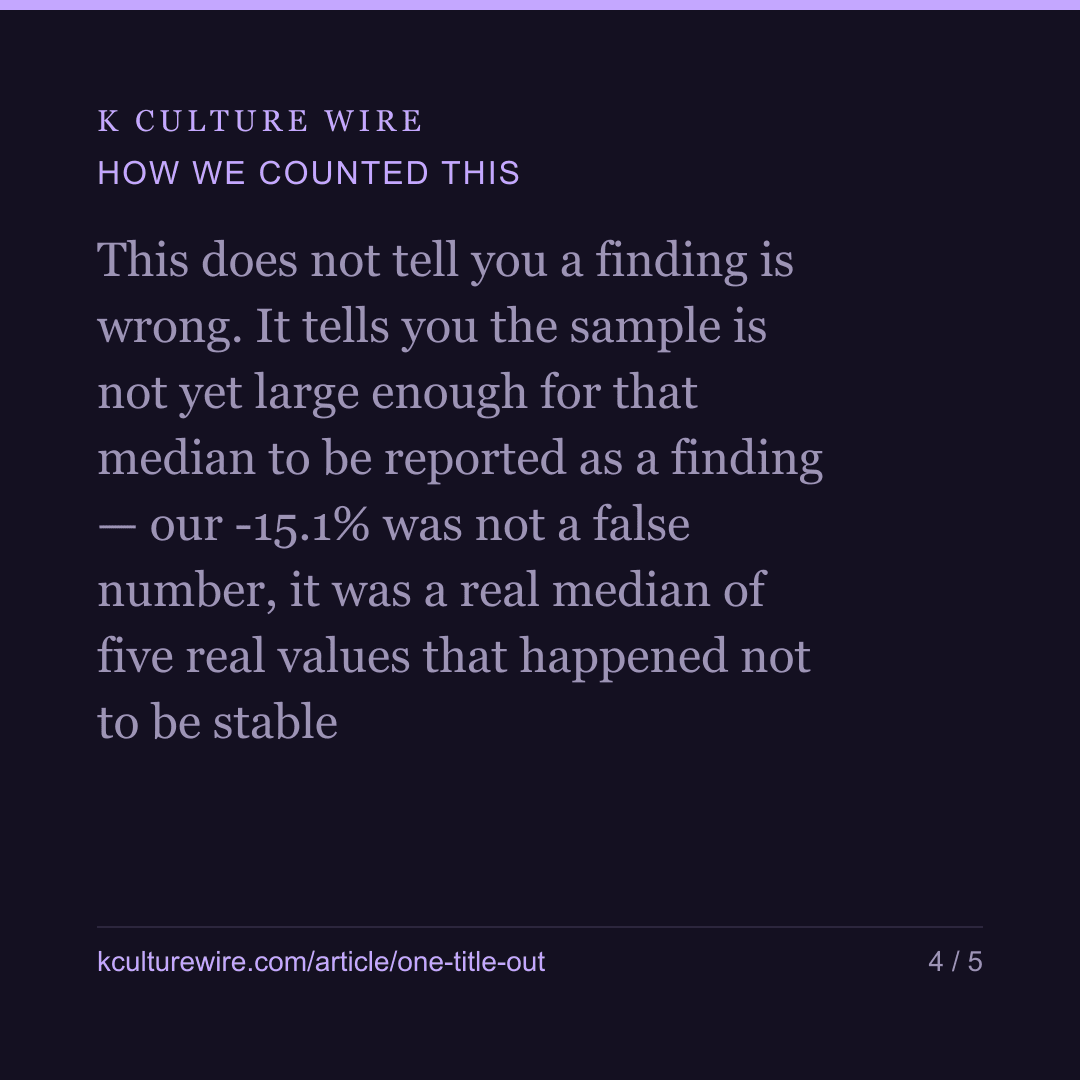
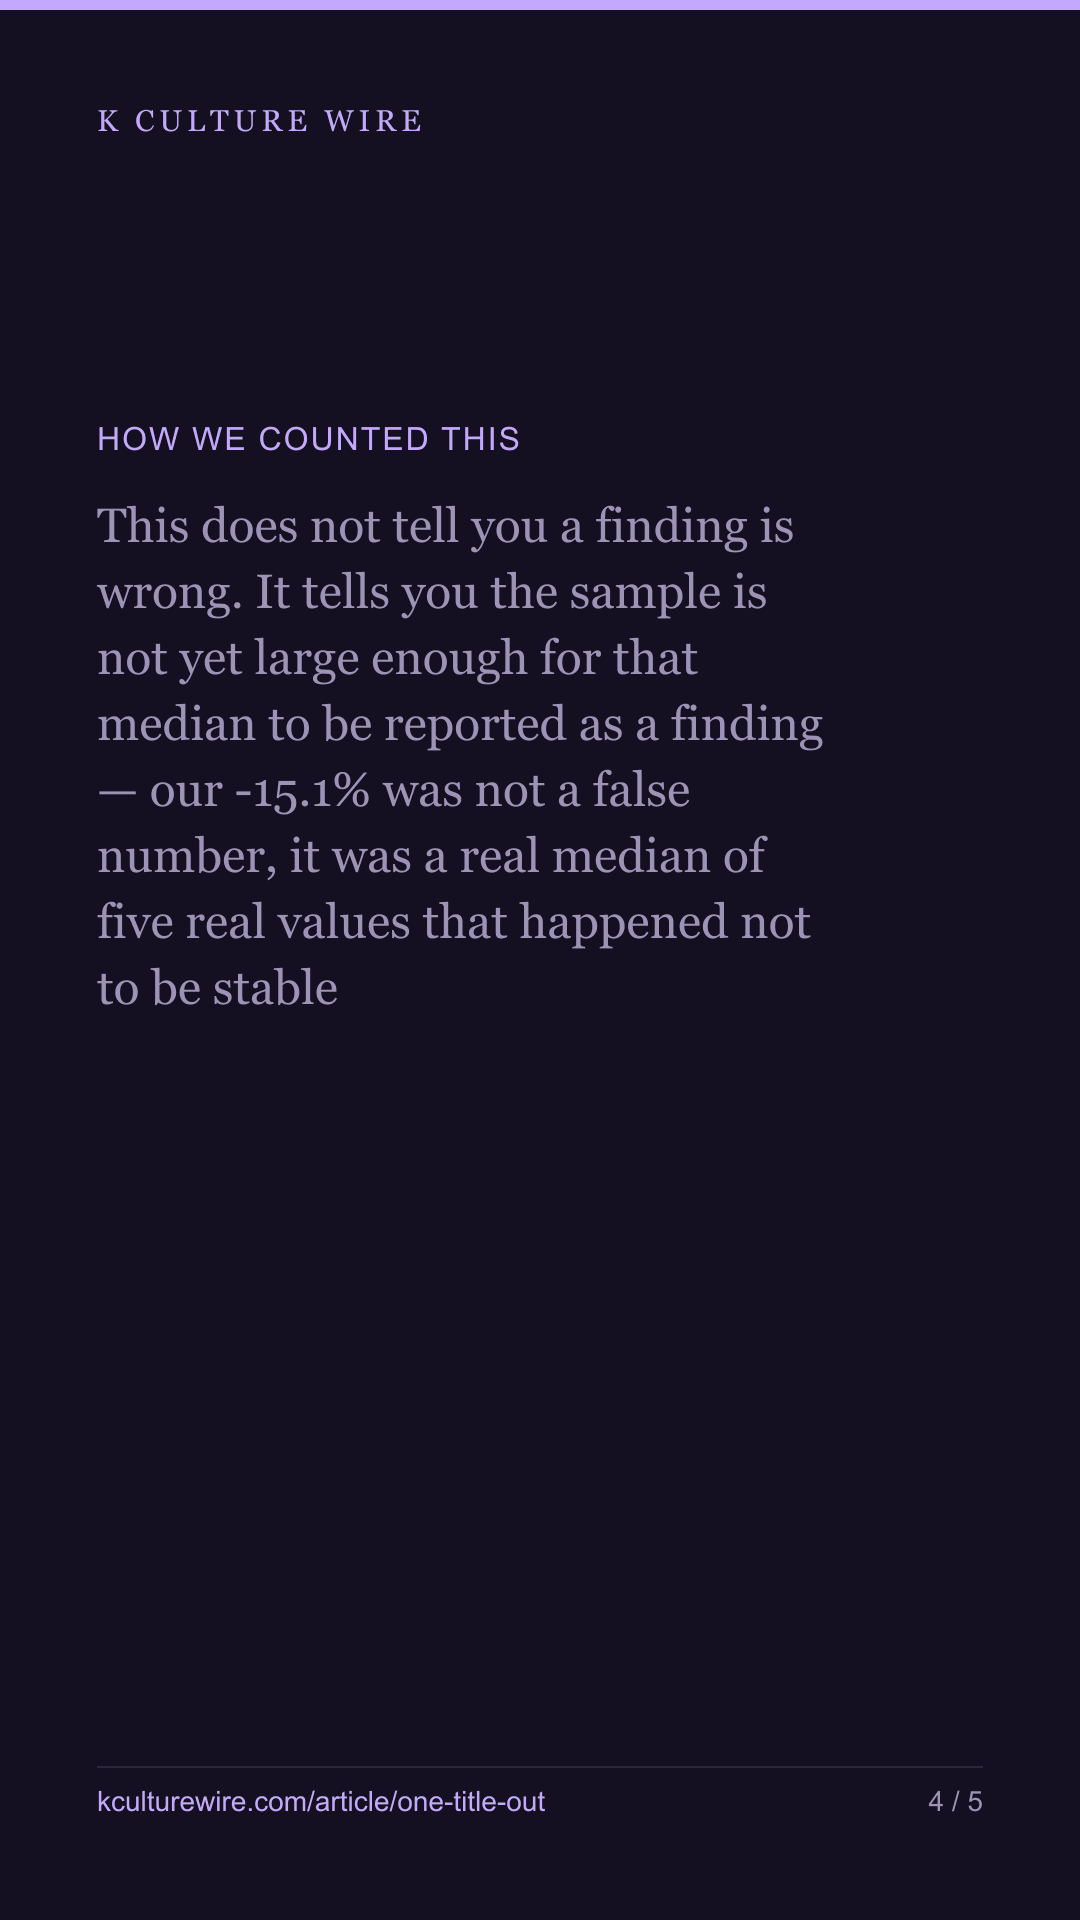
It does not tell you a finding is wrong. It tells you the sample is not yet large enough for that median to be reported as a finding. We have conflated those two things before, and the distinction matters: our −15.1% was not a false number, it was a real median of five real values that happened not to be stable.
It works on medians. A share, a total or a correlation needs a different check, and we do not have one.
And it only works in one direction. This check is a jackknife, a method from 1949, and the literature is clear about where it fails: because removing one observation barely moves a median, the jackknife understates how much a median varies, and it is not consistent for the median at all (Miller, 1974). So a swing it finds is real — a method that understates variation found one anyway. A swing it does not find is not evidence of stability. It may be a swing this method cannot see. Establishing stability, rather than failing to disprove it, would take a delete-d jackknife or a bootstrap (Efron, 1979). We have built neither.
And a steady median is not a true one. Every title in these samples was chosen by us, on the expectation that it had a wave worth measuring. A biased sample can produce a very steady wrong answer, and this check is blind to that entirely.
Two findings is also not a study of findings. This is a description of what we did today, not a claim about how often it happens.
We are adding the check to the tools that build our tables. The full workings, including both samples and both measures, are on one out.
Where these numbers come from
Sources
- Wikimedia — Pageviews API, Indonesian, Vietnamese, Thai and Malay editions, monthly, August 2020 to June 2026
What we checked
- This does not tell you a finding is wrong. It tells you the sample is not yet large enough for that median to be reported as a finding — our -15.1% was not a false number, it was a real median of five real values that happened not to be stable
- It works on medians. A share, a total or a correlation needs a different check, and we do not have one
- It only works in one direction. Because removing one observation barely moves a median, the jackknife understates how much a median varies and is not consistent for the median at all (Miller, 1974). A swing it finds is real; a swing it does not find is not evidence of stability
- Establishing stability, rather than failing to disprove it, would take a delete-d jackknife or a bootstrap (Efron, 1979). We have built neither
The data behind this
Written from the same data
Take this away — 10 cards
The figures in this article, as images. Free to repost with the address on them.




If you work in this business
Everything on this page is measured from the same weekly Netflix lists, per market and per title. We publish the pages free; what we sell is the same measurement cut to one company's catalogue — including the figures behind /one-out and /half-life and /wave-and-floor.
What a company sheet contains, and what it cannot tell you →