We published two findings and corrected one. A one-line check told them apart before we knew
We published two findings from the same data on the same day. Widening the sample left one untouched and cut the other to a third, and we corrected it. Could we have known which one would move, before we widened anything?
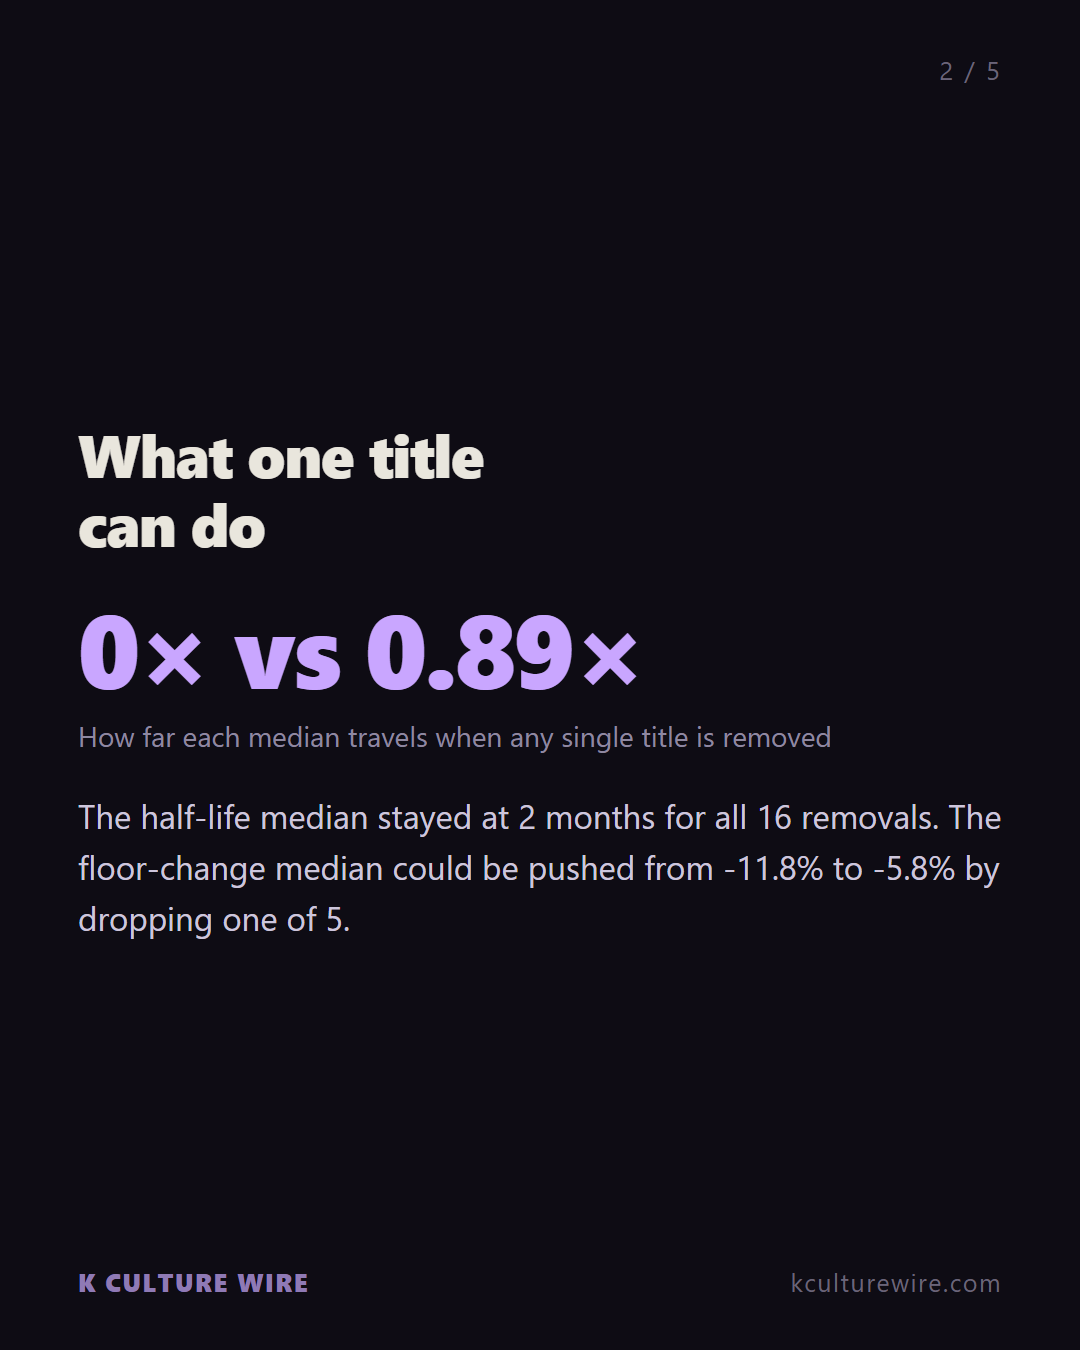
Yes. Take the numbers behind a median, remove one, recompute. Do it once for every number. On the day we published, the finding that survived did not move at all when any single title was removed. The one we corrected moved by 0.89 times its own size.
The two findings, on the day we published them
| Finding | Titles | Median | Range without any one title | Swing ÷ median |
|---|---|---|---|---|
| Months for a Korean title to lose half its readers | 16 | 2 | 2 to 2 | 0× |
| Percentage change in the floor after a wave passes | 5 | -6.7% | -11.8% to -5.8% | 0.89× |
The half-life median sat at 2 months and stayed at 2 months no matter which of the 16 titles was dropped. Nothing in the sample was holding it up. The floor-change median could be pushed anywhere between -11.8% and -5.8% by removing one of five. We reported it anyway.
What happened next
We widened the set from 35 titles to 59 for an unrelated reason. Here is where the same two medians landed.
| Finding | Then | Now | Titles then → now |
|---|---|---|---|
| Months for a Korean title to lose half its readers | 2 | 2 | 16 → 26 |
| Percentage change in the floor after a wave passes | -6.7% | -4.5% | 5 → 9 |
One held to the number. The other fell to a third of what we had published, and we corrected the article that carried it — the second correction on that piece that day. The check would have cost one line and it would have told us which was which.
The check we would normally have reached for does not work here
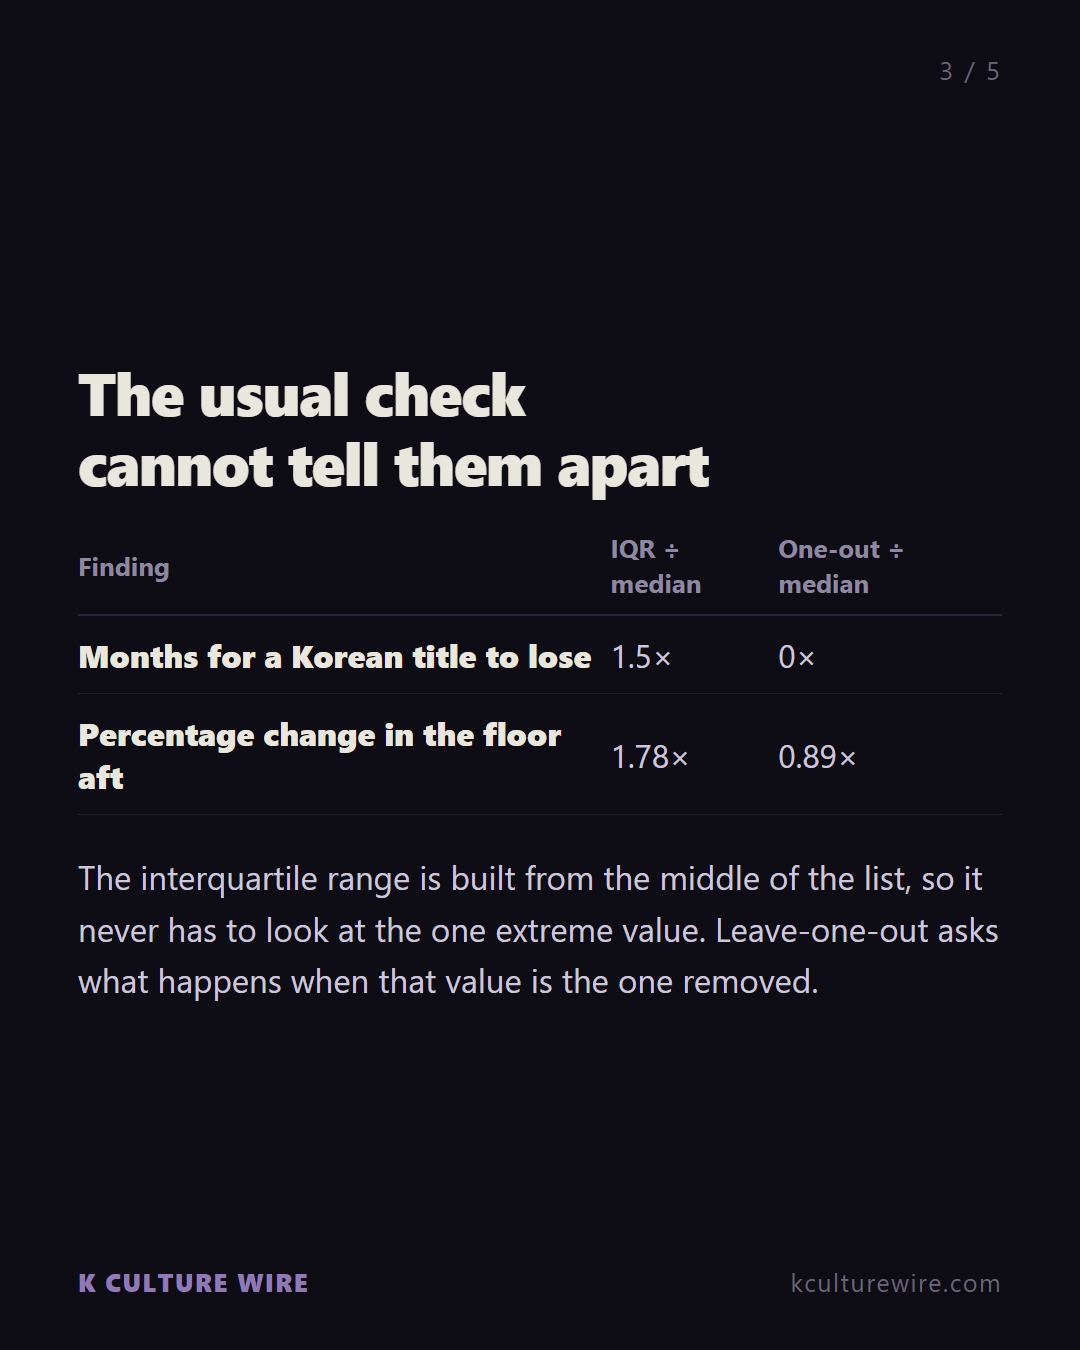
The interquartile range is the usual way to describe spread, and on these two samples it says they are almost the same.
| Finding | IQR ÷ median | Leave-one-out swing ÷ median |
|---|---|---|
| Months for a Korean title to lose half its readers | 1.5× | 0× |
| Percentage change in the floor after a wave passes | 1.78× | 0.89× |
The interquartile range cannot do this job. On the five values behind our first publication it read 1.78 times the median, which looks narrow — because it puts the one extreme value outside its own range and stops looking at it. Leave-one-out asks what happens when that value is the one removed.
The five values behind that first publication were −27.8, −16.9, −6.7, −5.0 and +60.2. The interquartile range is computed from the middle of that list and never has to look at +60.2 at all. Leave-one-out asks what the answer becomes when +60.2 is the one taken away, which is exactly the question a small sample raises.
How to run it
Take the numbers you have. Remove one, recompute the median. Do that once for every number. If the median barely moves, one more or one fewer observation will not change your finding. If it moves by a large fraction of itself, it will.
There is no sampling and no random seed here. The same numbers always give the same answer, which is why we can put it in a build script. We call it leave one out rather than by its statistical name because the name is the whole method. Our threshold is 0.5 — a median that moves by half its own size when one observation leaves is not yet a finding.
What this page cannot tell you
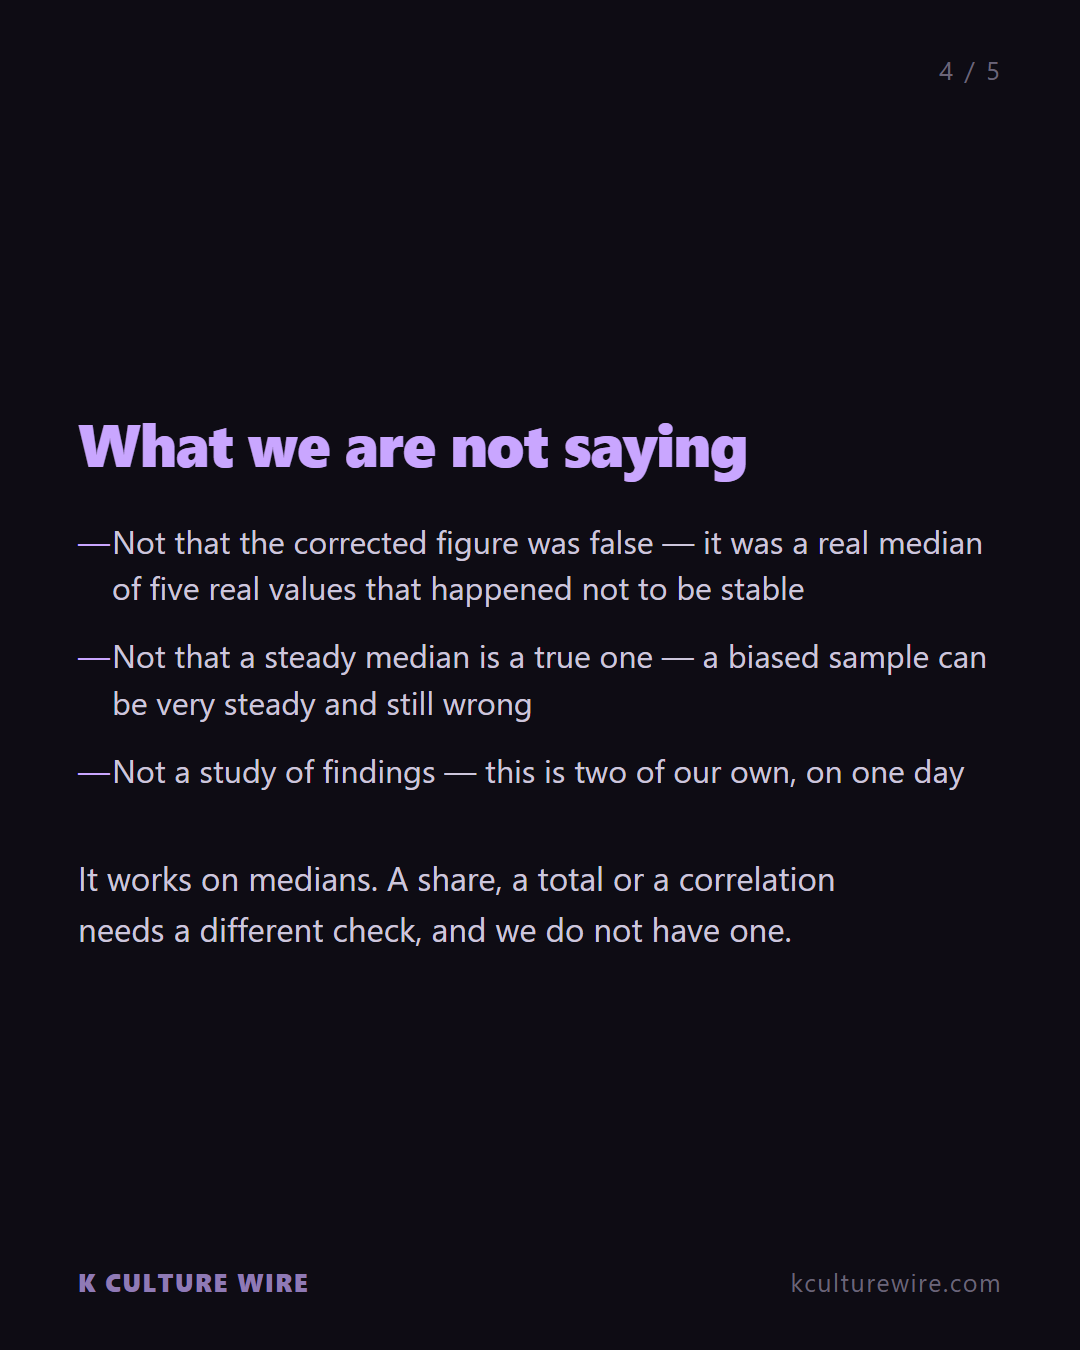
Leave-one-out does not tell you a finding is wrong. It tells you the sample is not yet large enough for that finding to be reported as one. Those are different things and we have conflated them before.
It works on a median. A share, a total or a correlation needs a different check, and we do not have one for those yet.
A steady median is not a true one. Every title here was chosen by us, and a biased sample can give a very steady wrong answer — this check cannot see that at all.
Two findings is not a study of findings. We are describing what we did today, not establishing how often this happens.
Card set — free to share
Five cards, 1080×1350. Every figure on them is in the table on this page. Take them.


14 seconds, with sound
A man and a woman read out what happened to each of two medians when a single title was removed. Free to repost with the address on it.
All our short films — each one built from a table on this site
What we wrote from this data
- Removing 1 title moved one median by 89%, the other by 0
Removing a single title left one of our medians exactly where it was and moved the other by 89% of itself. The interquartile range rated the two almost identically. We ran neither before publishing.
15 August 2026 · corrected
What the check actually answered
Could we have known beforehand? Yes. Of the two medians put through it, the one that held was the half-life figure and the one that moved was the wave-floor figure.
A median that moves under this check is genuinely unstable. A median that does not move is not thereby proven stable — this method understates how much a median varies. We publish the asymmetry rather than the reassurance.