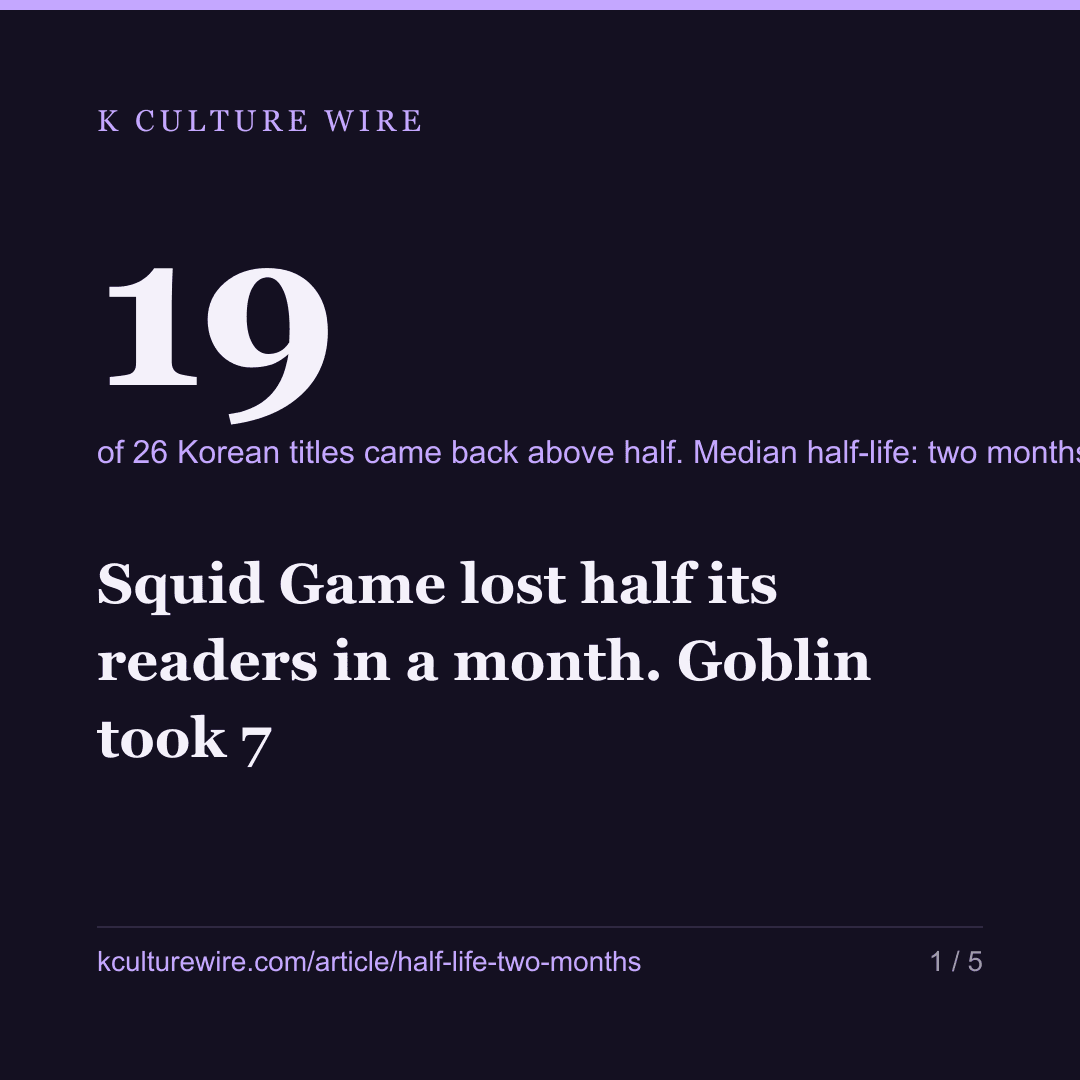
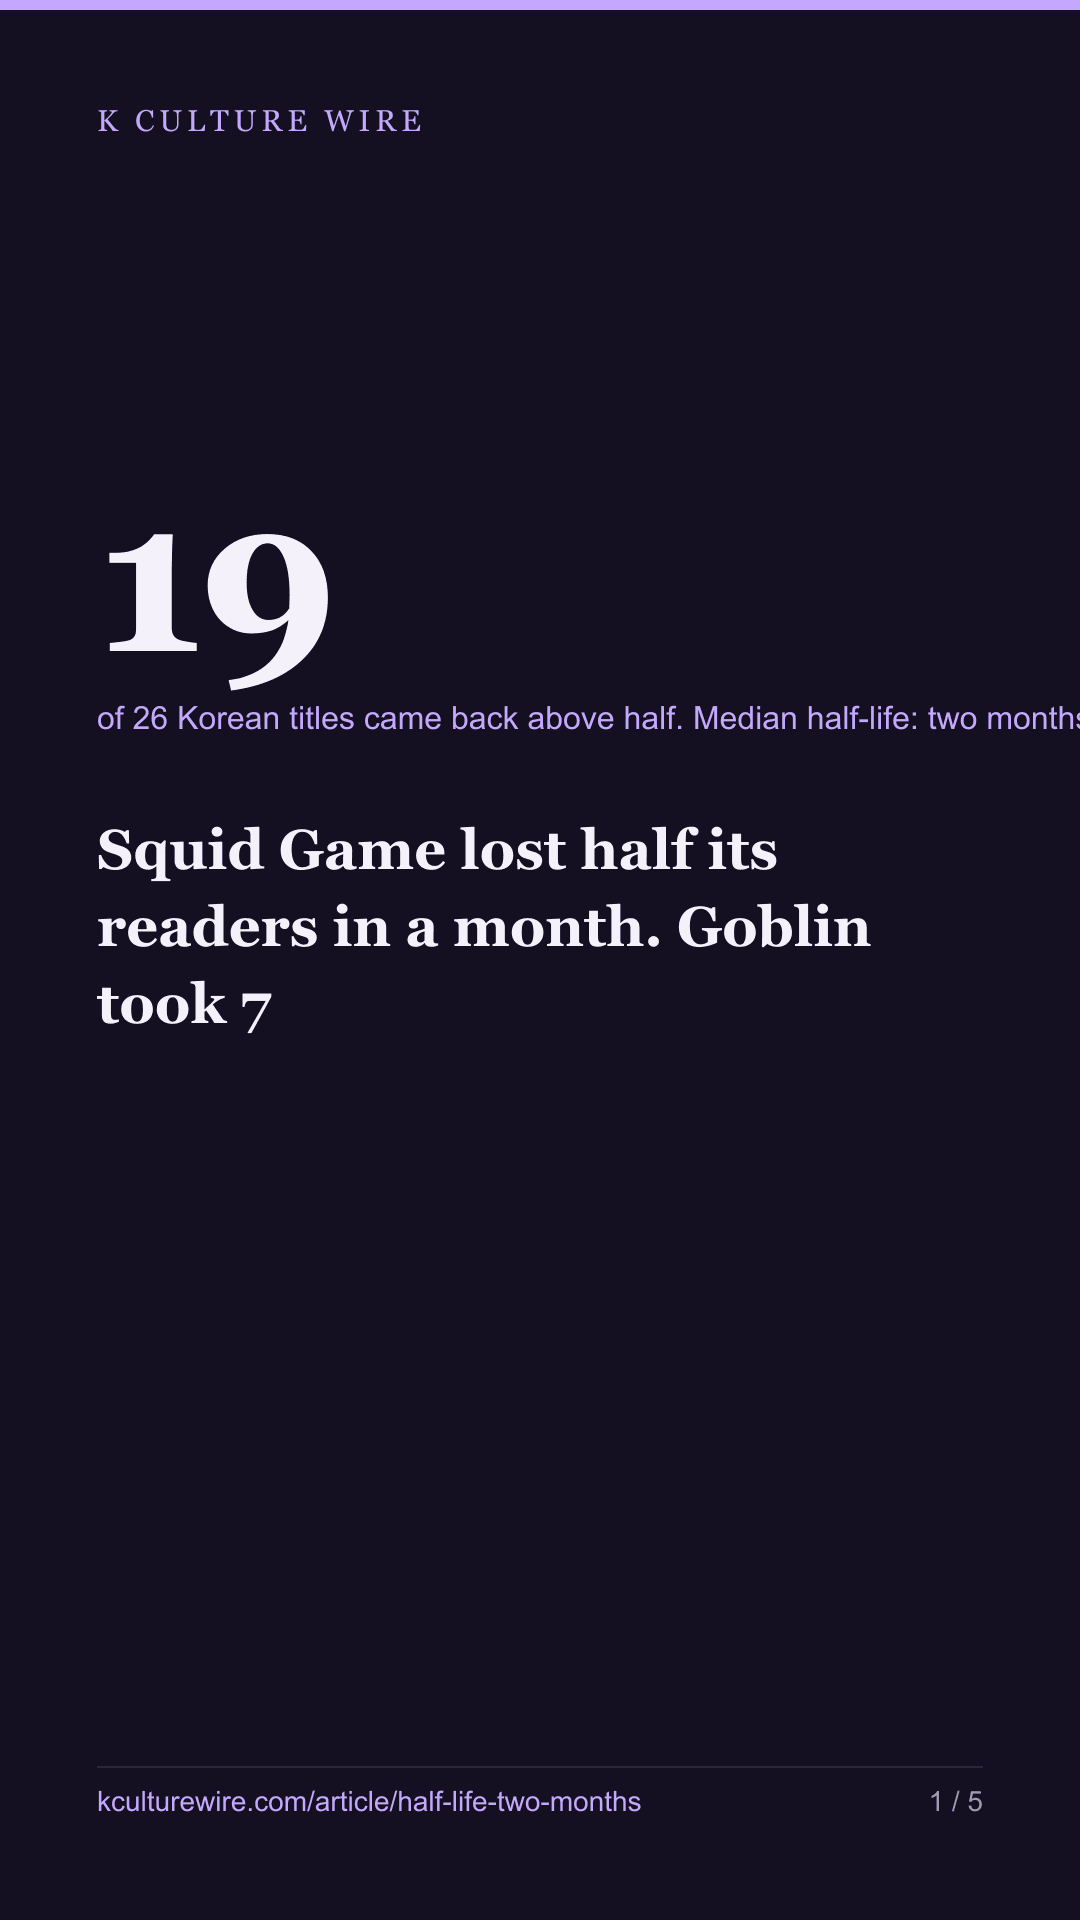
Squid Game lost half its readers in a month. Goblin took 7
Twenty-six Korean titles could be timed from their peak across four Southeast Asian Wikipedias. The median fell below half in two months, nine of them in a single month, and nineteen later rose above half again.
The table this is written from: /half-life
The last piece ended in a wall. We wanted to know whether a Korean hit leaves the floor higher than it found it, and for most titles that question cannot be asked: the encyclopaedia article is created when the title arrives, so there is no before to compare against.
There is a version of the question that needs no before. After the peak, how long until half of it is gone?
Of the 59 titles we hold, 26 have a peak thick enough to time and at least six months of watching afterwards. Their median half-life is two months.
How long half of it lasts
| Title | Peak | Peak reads | Half-life |
|---|---|---|---|
| Queen of Tears | 2024-04 | 2550.5 | 1 month |
| Squid Game | 2021-10 | 2440 | 1 month |
| All of Us Are Dead | 2022-02 | 1267.6 | 1 month |
| A Killer Paradox | 2024-02 | 539.6 | 1 month |
| Alchemy of Souls | 2023-01 | 508.4 | 1 month |
| Parasite | 2020-09 | 443.7 | 1 month |
| Exhuma | 2024-05 | 279.8 | 1 month |
| The Atypical Family | 2024-06 | 185.8 | 1 month |
| The Roundup | 2024-05 | 53.5 | 1 month |
| Crash Landing on You | 2021-08 | 604.6 | 2 months |
| Little Women | 2022-09 | 470.7 | 2 months |
| Train to Busan | 2020-08 | 387 | 2 months |
| Kingdom | 2025-02 | 199.6 | 2 months |
| The Handmaiden | 2022-09 | 172 | 2 months |
| Marry My Husband | 2025-07 | 150.3 | 2 months |
| Hospital Playlist | 2021-07 | 478.2 | 3 months |
| Lovely Runner | 2024-06 | 379.3 | 3 months |
| Reply 1988 | 2021-08 | 267 | 3 months |
| Start-Up | 2021-10 | 208.5 | 3 months |
| My Name | 2024-01 | 79 | 3 months |
| Vincenzo | 2021-06 | 771.7 | 4 months |
| Hotel del Luna | 2021-11 | 113.8 | 4 months |
| Itaewon Class | 2022-10 | 181 | 5 months |
| My Mister | 2021-06 | 68.6 | 5 months |
| Goblin | 2021-10 | 279 | 7 months |
| Descendants of the Sun | 2025-04 | 202 | 7 months |
Reads are per million reads of that Wikipedia, summed across the Indonesian, Vietnamese, Thai and Malay editions.
Nine titles lost half their readers in a single month. One, Big Mouth, has been watched for 26 months and has not fallen below half — the only one of the 26 that has held.
The biggest peaks are in the top rows. Queen of Tears and Squid Game are the two largest waves in the dataset and both are gone by half within thirty days. Goblin, at a tenth of Squid Game’s height, took seven months. Whatever makes attention last, it is not size.
We report the median rather than the mean. The mean is 2.6 months, which is longer than fifteen of the twenty-six titles actually lasted.
A half-life is not an ending
Nineteen of the twenty-six later rose back above half their peak.
The eight that came back most often:
| Title | Half-life | Returns | First return |
|---|---|---|---|
| The Handmaiden | 2 | 7× | 3 months after peak |
| Hotel del Luna | 4 | 6× | 5 months after peak |
| Itaewon Class | 5 | 5× | 6 months after peak |
| Reply 1988 | 3 | 4× | 5 months after peak |
| My Name | 3 | 4× | 9 months after peak |
| Goblin | 7 | 4× | 8 months after peak |
| Parasite | 1 | 3× | 5 months after peak |
| Train to Busan | 2 | 3× | 4 months after peak |
Squid Game is not on that list. It came back once, thirty-nine months after its peak, which was season two. That is the shape a release schedule makes: one return, on a long delay, when something new attaches to the name.
The eight above do not have that shape. The Handmaiden came back seven separate times, the first only three months after its peak, with nothing new attached to it. Neither does Hotel del Luna at six, or Itaewon Class at five.
The half-life counts the first fall, not the last. Read together, the two tables describe something other than a wave receding. They describe a wave that recurs: briefly, repeatedly, and mostly not on any schedule a release calendar would predict.
The thirty-three we could not time
| Why not | How many |
|---|---|
| The peak was too thin for halving to mean anything | 14 |
| Not enough months across the four editions | 11 |
| Only a few months follow the peak — unknown, not slow | 7 |
The last row deserves care. Seven titles peaked too recently to have fallen below half yet. That is not endurance; it is the calendar. Putting them in the table above would have pulled the median up for no reason at all.
What this cannot tell you
Monthly data puts a floor under every figure here. A title that lost half its readers in ten days and one that took thirty both read as one month. The short end of that table is shorter than it looks.
The titles were chosen as ones we expected to have had a wave, not the most-read Korean titles and not a random sample. A set chosen that way leans toward titles that travelled far enough to have a peak worth measuring at all.
A read is not a viewer. Someone opening an encyclopaedia article may have watched the show, may be deciding whether to, or may have seen the name somewhere and been curious.
And we cannot tell you why Goblin held for seven months while Queen of Tears halved in one. We can tell you it was not the size of the wave.
The full tables, including every title we could not time and why, are on half-life.
Where these numbers come from
Sources
- Wikimedia — Pageviews API, Indonesian, Vietnamese, Thai and Malay editions, monthly, August 2020 to June 2026
What we checked
- Wikipedia reads are monthly, so every half-life here has a floor of one month. A title that lost half its readers in ten days and one that took thirty both read as one month, which makes the short end of the table shorter than it looks
- The 59 titles were chosen as ones we expected to have had a wave, not the most-read Korean titles and not a random sample. A set chosen that way leans toward titles that travelled far enough to have a peak worth measuring
- A read is not a viewer. Someone opening an encyclopaedia article may have watched the show, may be deciding whether to, or may have seen the name somewhere and been curious
- Seven of the 33 titles we could not time had peaked too recently to have fallen below half yet. That is the calendar, not endurance, and including them would have pulled the median up for no reason
- We can say the half-life was not set by the size of the wave. We cannot say what did set it
The data behind this
Written from the same data
Take this away — 10 cards
The figures in this article, as images. Free to repost with the address on them.

If you work in this business
Everything on this page is measured from the same weekly Netflix lists, per market and per title. We publish the pages free; what we sell is the same measurement cut to one company's catalogue — including the figures behind /half-life and /wave-and-floor.
What a company sheet contains, and what it cannot tell you →