We said a market has 1 Korean slot. It was arithmetic
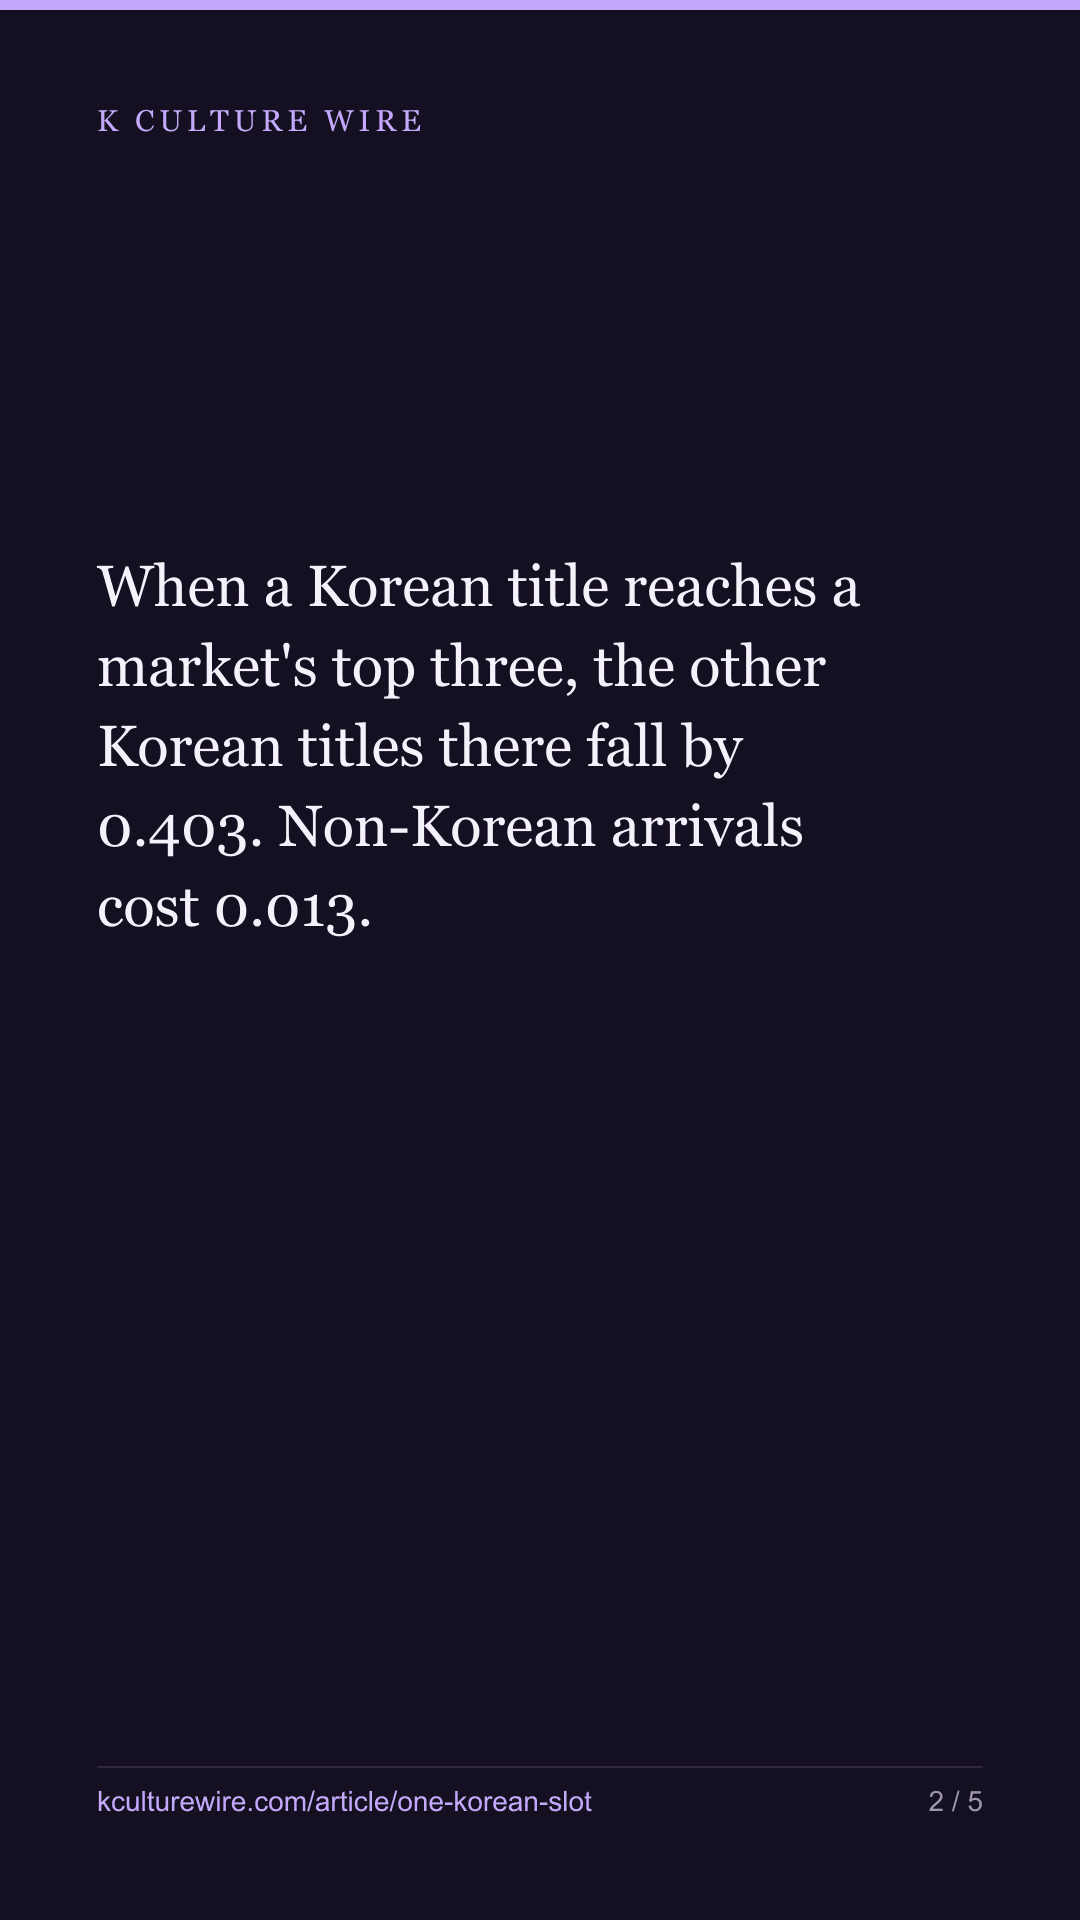
When a Korean title reaches a market's top three, the other Korean titles there fall by 0.403. Non-Korean arrivals cost 0.013. That looks decisive until you notice the two groups start from different heights.
The table this is written from: /crowding
On 9 August we published a sentence on our hard-markets page explaining why some countries only ever show the biggest Korean titles:
there is one Korean slot and the biggest title takes it
It was an explanation, not a measurement. We had not tested it. This is the test.
What a Korean arrival looks like
Take every week where a Korean title entered a market’s top three without being on that chart the week before — 2,258 of them. Count the other Korean titles on that chart, four weeks before against four weeks from the arrival. Then do exactly the same for arrivals that are not Korean.
| Arrivals at the top 3 | Cases | Other Korean titles before | Change after |
|---|---|---|---|
| Korean title arrives | 2,479 | 1.904 | -0.403 |
| Any other title arrives | 36,972 | 0.589 | -0.013 |
A twenty-eight-fold difference. Published on its own it would have looked like proof.
Why it is not
Read the third column. The Korean cases start at 1.916 other Korean titles; the control starts at 0.563. A Korean title reaches a market’s top three most often in markets that already carry several Korean titles — and a chart that starts high falls whatever arrives, because there is more to lose.
So we grouped both sides by how many other Korean titles were there to begin with, and compared like with like:
| Other Korean titles before | Korean arrivals | Change | Other arrivals | Change | Difference |
|---|---|---|---|---|---|
| 0 | 745 | +0.111 | 21,007 | +0.165 | -0.055 |
| 1 | 565 | -0.247 | 11,170 | -0.186 | -0.061 |
| 2 | 382 | -0.535 | 2,907 | -0.273 | -0.262 |
| 3 | 364 | -0.620 | 1,398 | -0.478 | -0.142 |
| 4 or more | 423 | -1.208 | 490 | -0.883 | -0.325 |
The control falls almost as far in every band. Weighted to the same starting levels, a non-Korean arrival would have cost -0.255; the Korean arrivals cost -0.403. What is left is -0.147, and 62% of the raw gap was the starting level rather than the arrival.
What survives
Something does. A Korean title reaching the top three of a market costs that market about a tenth of another Korean title, over and above what any arrival costs. In the markets that already carry four or more, it costs about three-tenths.
And the top row of the table is the honest limit on the original sentence. Where there was no other Korean title, a Korean arrival brings slightly fewer than a non-Korean one does — +0.130 against +0.157. In the markets we described as having “one Korean slot”, the slot does not behave like a slot at all. Whatever is happening there, it is not one title displacing another.
So the sentence was not wrong. It was much smaller than it sounded, and it does not hold in the markets we wrote it about.
What this cannot tell you
It shows places, not reasons. A Korean title that disappears the week a bigger one arrives may be ending its own run on schedule; nothing in a rank table separates that from displacement, and a four-week window cannot either.
It is also not viewing. A title pushed to eleventh place is invisible here at any level of watching, so “lost its place” is a statement about a chart, not about an audience.
Where these numbers come from
Sources
- Netflix — Tudum weekly Top 10 country lists, 492,900 rows read, 2021-07-04 to 2026-07-26, 93 markets, Films and TV counted as separate charts, Russia excluded · https://www.netflix.com/tudum/top10
What we checked
- Non-Korean arrivals at the same top-three positions are used as a control, so the comparison is against what any arrival does rather than against nothing
- The control is weighted to the same distribution of starting levels as the Korean cases, because a chart that starts high falls whatever arrives
- The arriving title is removed from the count on both sides, so the fall cannot be the arriving title itself
- The band with no other Korean title present is reported separately, because it is where the claim fails
What we left out, and why
- Russia, excluded across this publication because Netflix withdrew and the remaining weeks are not comparable
- Any reading of why a title left. A run ending on its own and a run displaced look identical in a rank table
The data behind this
Written from the same data
Take this away — 10 cards
The figures in this article, as images. Free to repost with the address on them.









If you work in this business
Everything on this page is measured from the same weekly Netflix lists, per market and per title. We publish the pages free; what we sell is the same measurement cut to one company's catalogue — including the figures behind /crowding.
What a company sheet contains, and what it cannot tell you →