No Netflix chart signals another — 58 are in one queue
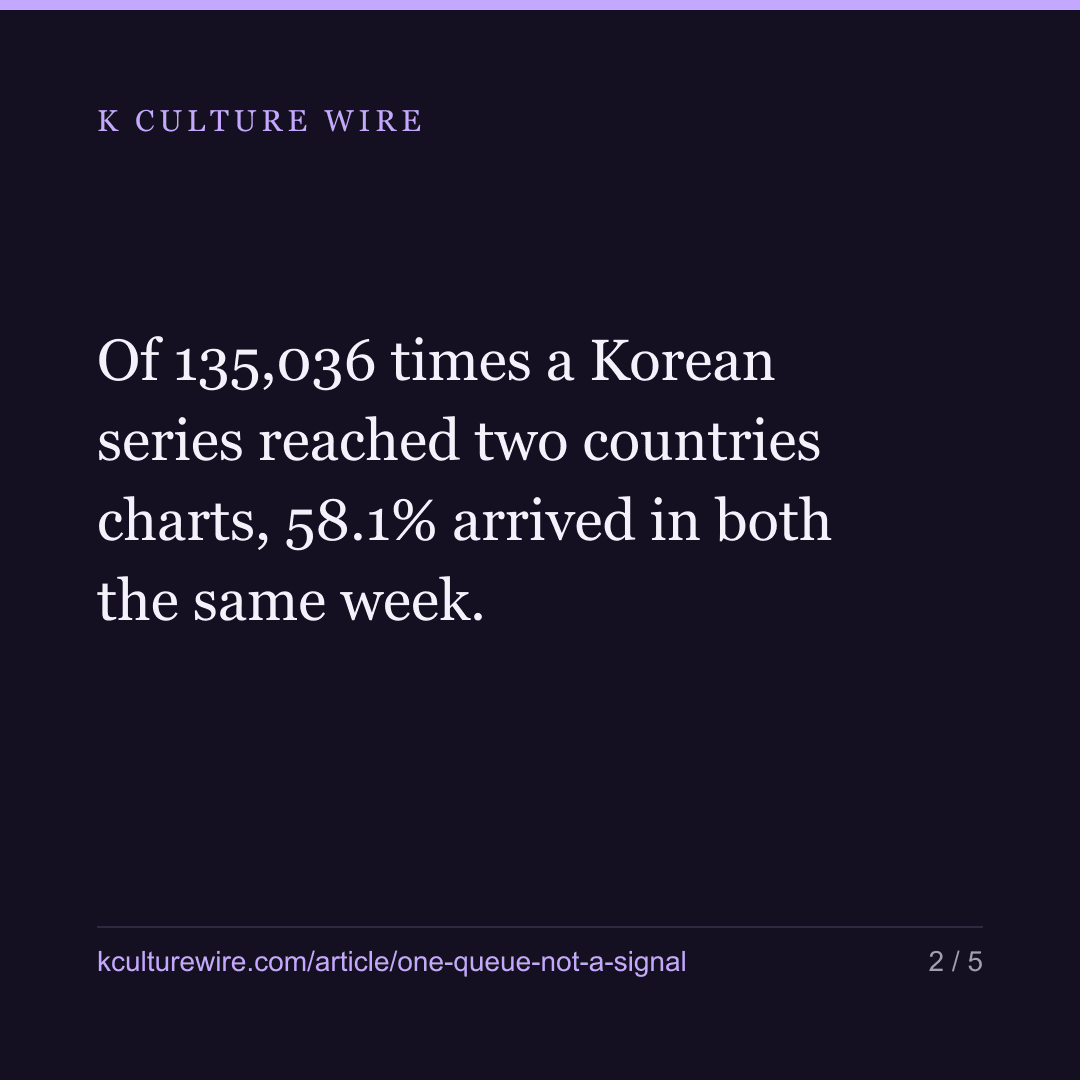
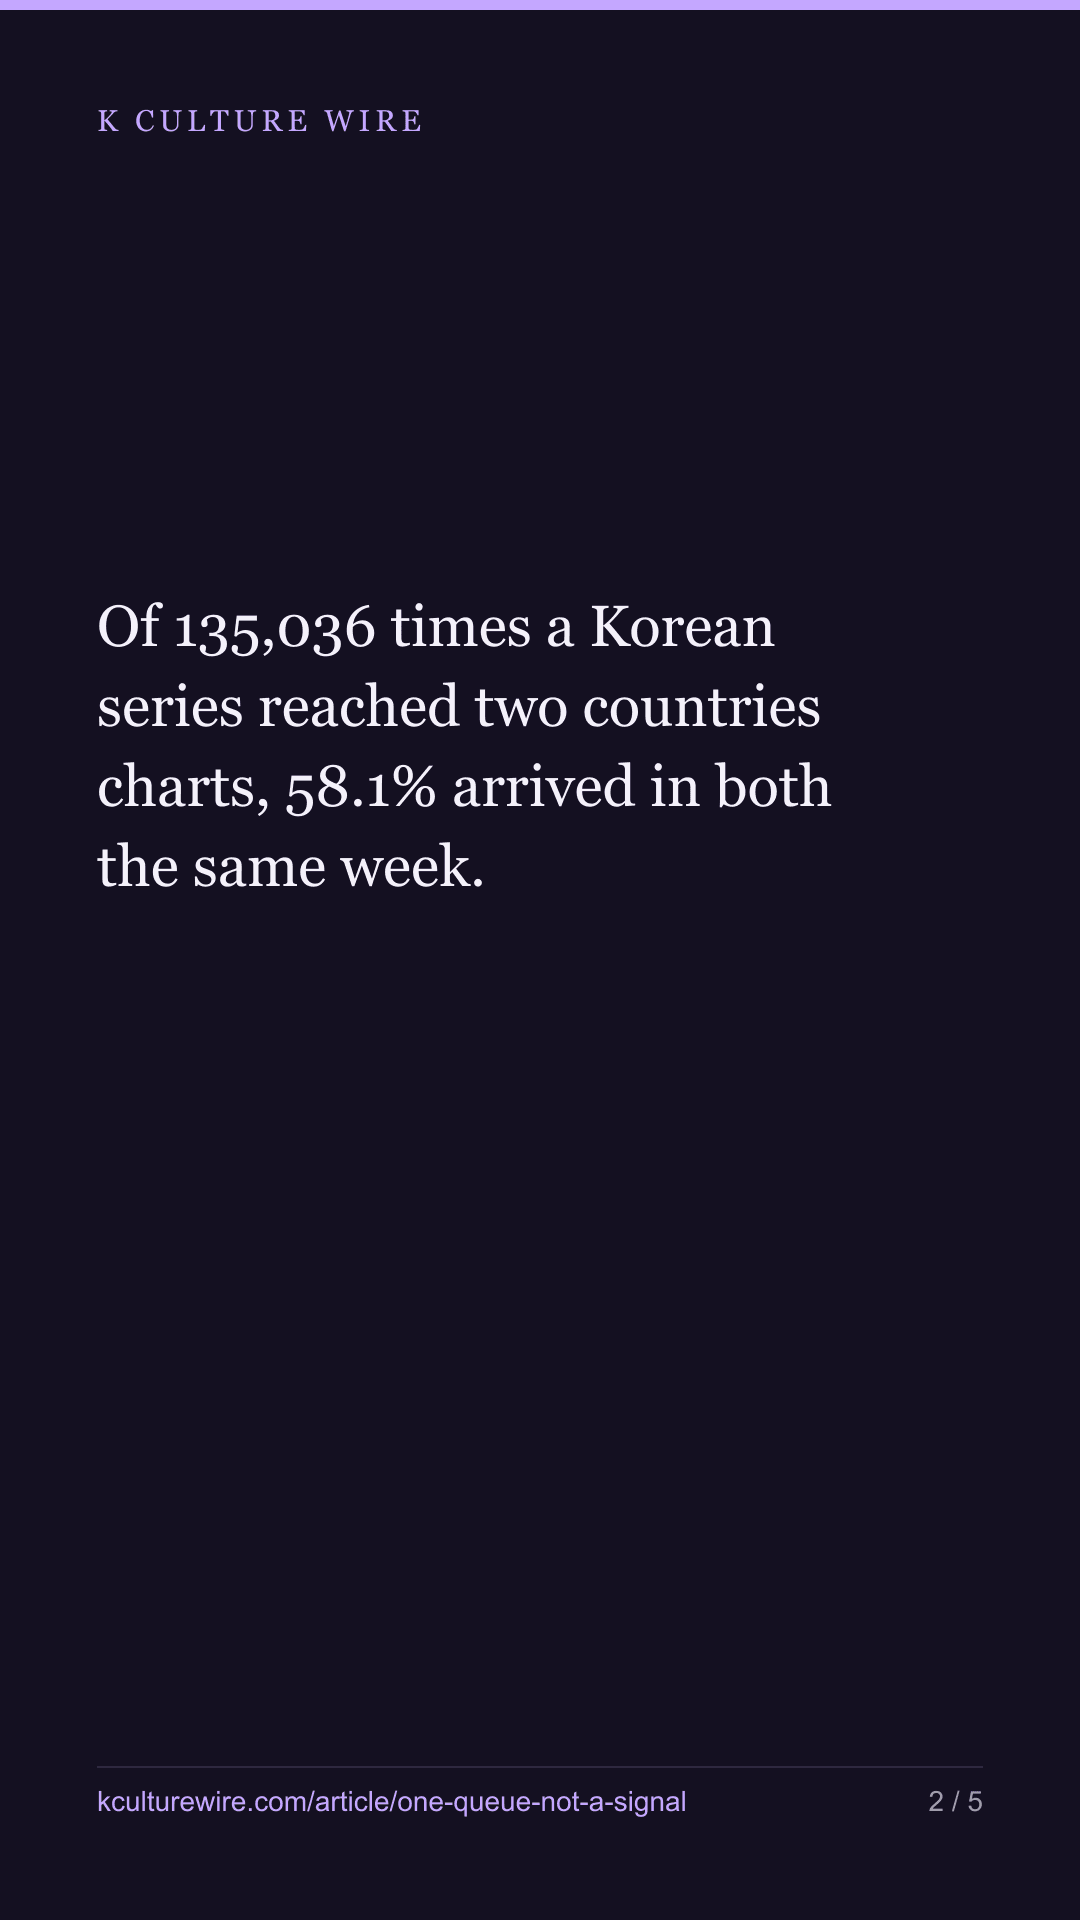
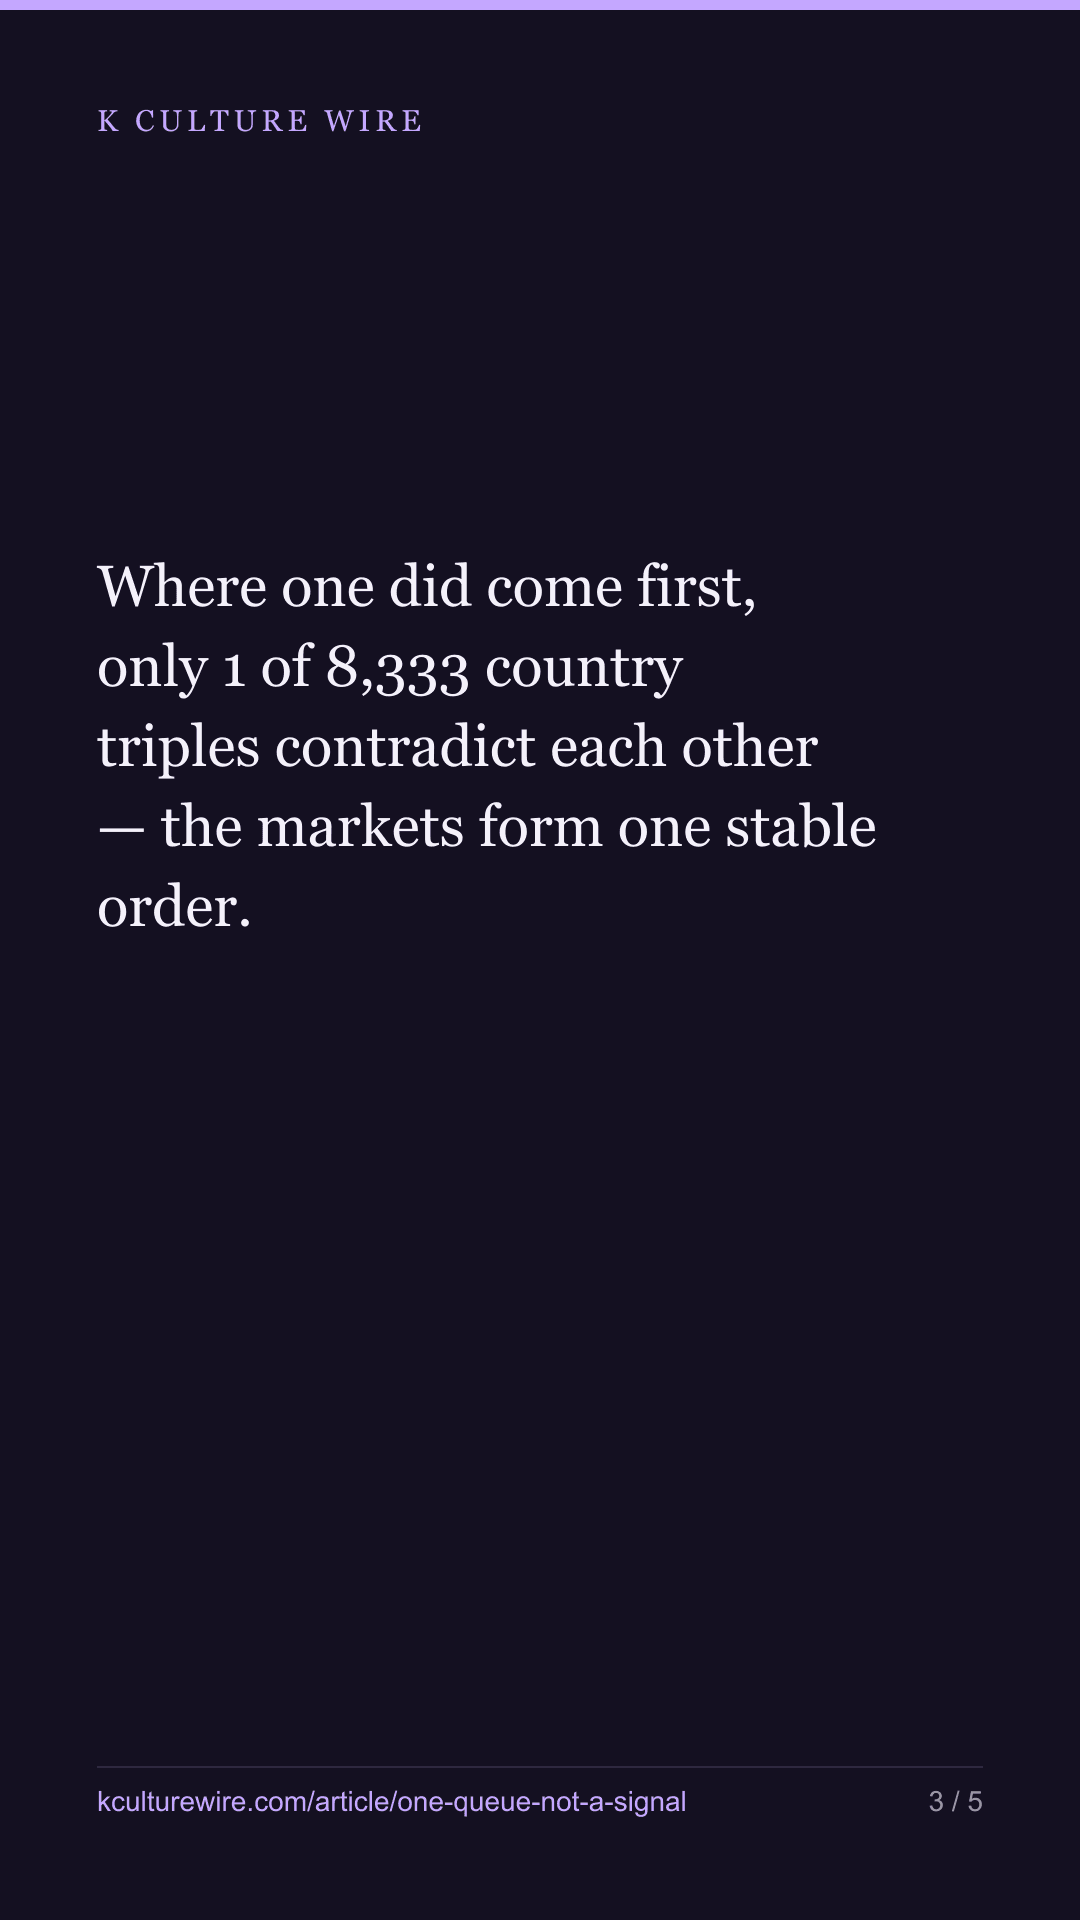
Of 135,036 times a Korean series reached two countries charts, 58.1% arrived in both the same week. Where one did come first, only 1 of 8,333 country triples contradict each other — the markets form one stable order.
The table this is written from: /lead-lag
Somewhere in a distribution office there is a second monitor with a neighbouring country’s Netflix chart on it. The reasoning is old and reasonable: if a Korean series is climbing in Thailand this week, Vietnam is worth watching next week.
We can test that against 268 weeks of country charts. The answer is no, and the interesting part is why no.
Most of the time there is no “first”
Before asking who leads, we have to ask whether anybody does.
Take every occasion a Korean series reached the charts of two countries — 135,036 of them across 239 series. Compare the week it first appeared in each.
| A Korean series that reached both countries’ charts | Times | Share |
|---|---|---|
| Arrived in both the same week | 78,428 | 58.1% |
| One came first | 56,608 | 41.9% |
Netflix releases worldwide, and it shows. More than half the time a series lands on both charts in the same week, and there is nothing to lead. Whatever a leading indicator could be, it is confined to the remaining 41.9% from the outset.
Where one does come first, the direction is almost fixed
For the pairs where a gap exists, we measured how lopsided the ordering is. Zero means the two countries trade the lead evenly; 50 means one of them is always first. 934 pairs had at least 20 titles arriving in different weeks.
| How lopsided the pair is | Pairs |
|---|---|
| Under 10 points from even | 86 |
| 10–20 points | 88 |
| 20–30 points | 96 |
| 30 points or more | 664 |
The median pair sits 42.1 points from even, out of a possible 50. When one of two countries takes a Korean series first, it is nearly always the same one of the two.
That looks, at first, like exactly the signal the second monitor was bought for.
It is not a signal. It is a queue.
Here is the test that separates the two.
If country charts genuinely pass signals to each other, the relationships should be local and sometimes circular: A leads B, B leads C, and C leads A, because each pair has its own reason.
If instead the markets simply differ in speed — some reach a top 10 within days of a release, others take weeks to accumulate enough viewing — then every pair is just two positions in one line, and loops should be impossible.
We checked every triple of countries where all three pairs have a direction. There are 8,333 of them across 58 markets.
8,332 are consistent. One forms a loop.
If A takes a title before B and B before C, then A takes it before C — essentially always. That is not a web of neighbours signalling to each other. That is 58 markets standing in a single line, in the same order, title after title.
So the answer to the scheduler’s question is no. A neighbour’s chart tells you nothing that your own position does not already tell you, and your own position does not change from one series to the next. You need one fact — am I early or late — and after that the second monitor is redundant.
What we are deliberately not publishing
We are not printing the order.
Ranking 58 markets by how quickly they take Korean titles would be a league table, and a league table is the one thing this publication does not make: it invites the reader to treat position as merit, when what is being measured here is a mixture of catalogue size, release patterns, chart volatility and how many people it takes to move a small country’s top 10. The finding is that an order exists and is stable. Which end a given market sits at belongs in that market’s own sheet, next to the reasons it might sit there.
What this cannot tell you
It cannot tell you why the order is what it is. “Arrival” here is a chart entry, not a release: Netflix does not publish release dates by country, so a market that appears late may have had the series available from day one and simply taken three weeks to accumulate enough viewing to place. A big country’s top 10 moves on a different number of viewers than a small one’s, and none of that is in these lists.
Two limits are worth naming. Of 4,278 country pairs that appear in the data at all, only 934 could be measured — a pair needs 20 titles that arrived in different weeks, and most pairs of countries have never shared that many Korean series with a gap between them. And the 20 is our threshold, not a property of the data.
Why we bothered
Because the second monitor costs attention, and attention spent watching a neighbour is attention not spent on the one question that actually matters for scheduling: where in the queue does my own market sit, and how long is the wait. That question has a stable answer. The neighbour does not.
The full tables — the same-week share, the lopsidedness distribution, the transitivity count and what had to be discarded: whether one chart leads another.
Where these numbers come from
Sources
- Netflix — Tudum weekly Top 10 country lists, series only, 268 weeks to 2026-08-16, 499,180 chart rows across 93 markets · https://www.netflix.com/tudum/top10
- Wikidata — Korean titles identified by item number rather than by name, using country of origin, and restricted to series · https://query.wikidata.org
What we checked
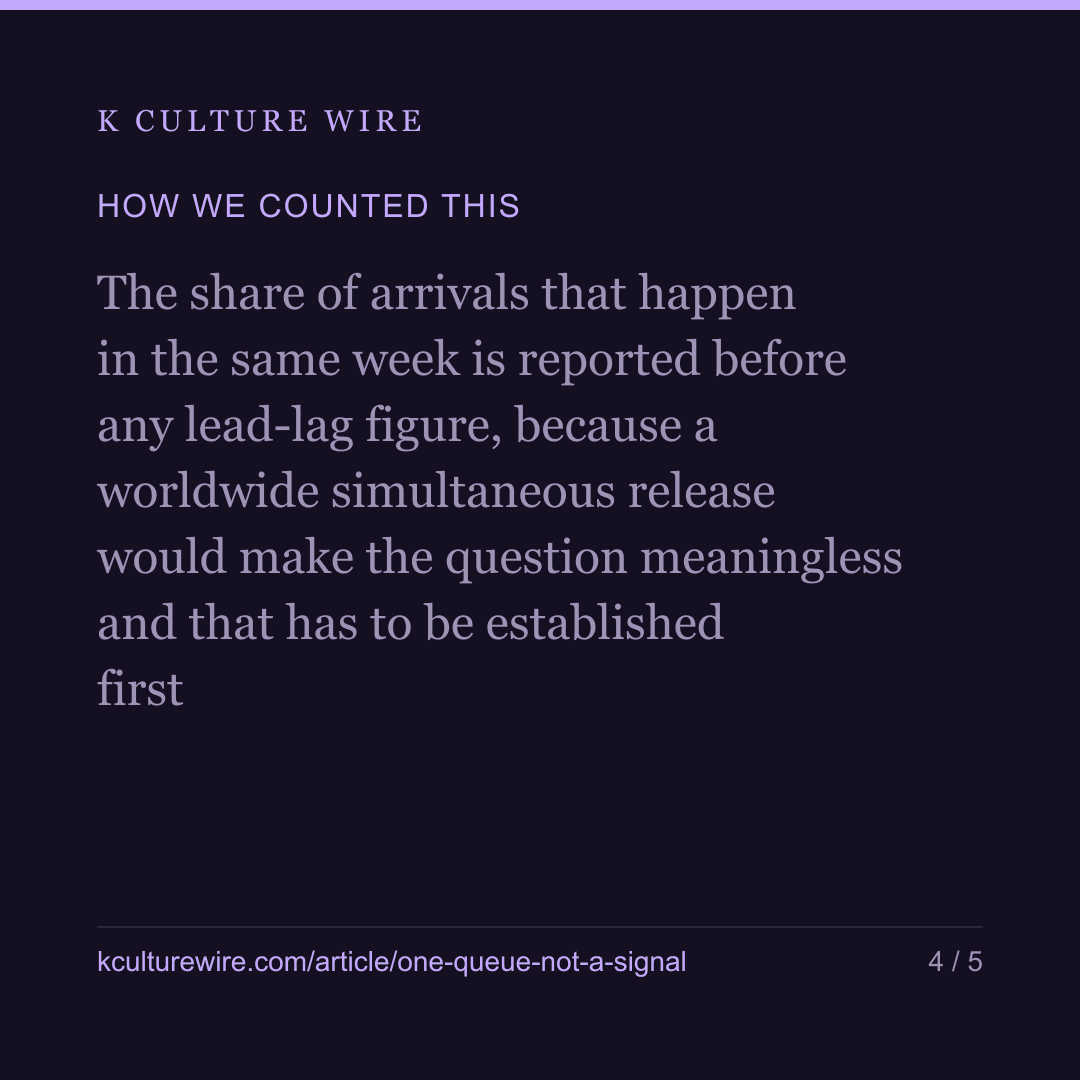
- The share of arrivals that happen in the same week is reported before any lead-lag figure, because a worldwide simultaneous release would make the question meaningless and that has to be established first
- Lopsidedness is reported as a distance from even in both directions, so no country is credited with leading another
- Transitivity is measured across every country triple with a direction on all three pairs, which distinguishes a single speed order from genuine pair-specific signals
- A pair is only measured when at least 20 titles arrived in different weeks, and the number of pairs dropped by that threshold is reported
What we left out, and why
- Films, so that a title's arrival means one thing throughout
- Country pairs with fewer than 20 titles arriving in different weeks, which is most of them
- Russia, excluded across this publication because Netflix withdrew and the remaining weeks are not comparable
The data behind this
Written from the same data
Take this away — 10 cards
The figures in this article, as images. Free to repost with the address on them.



If you work in this business
Everything on this page is measured from the same weekly Netflix lists, per market and per title. We publish the pages free; what we sell is the same measurement cut to one company's catalogue — including the figures behind /lead-lag.
What a company sheet contains, and what it cannot tell you →