Two shows from one company cost each other half a place
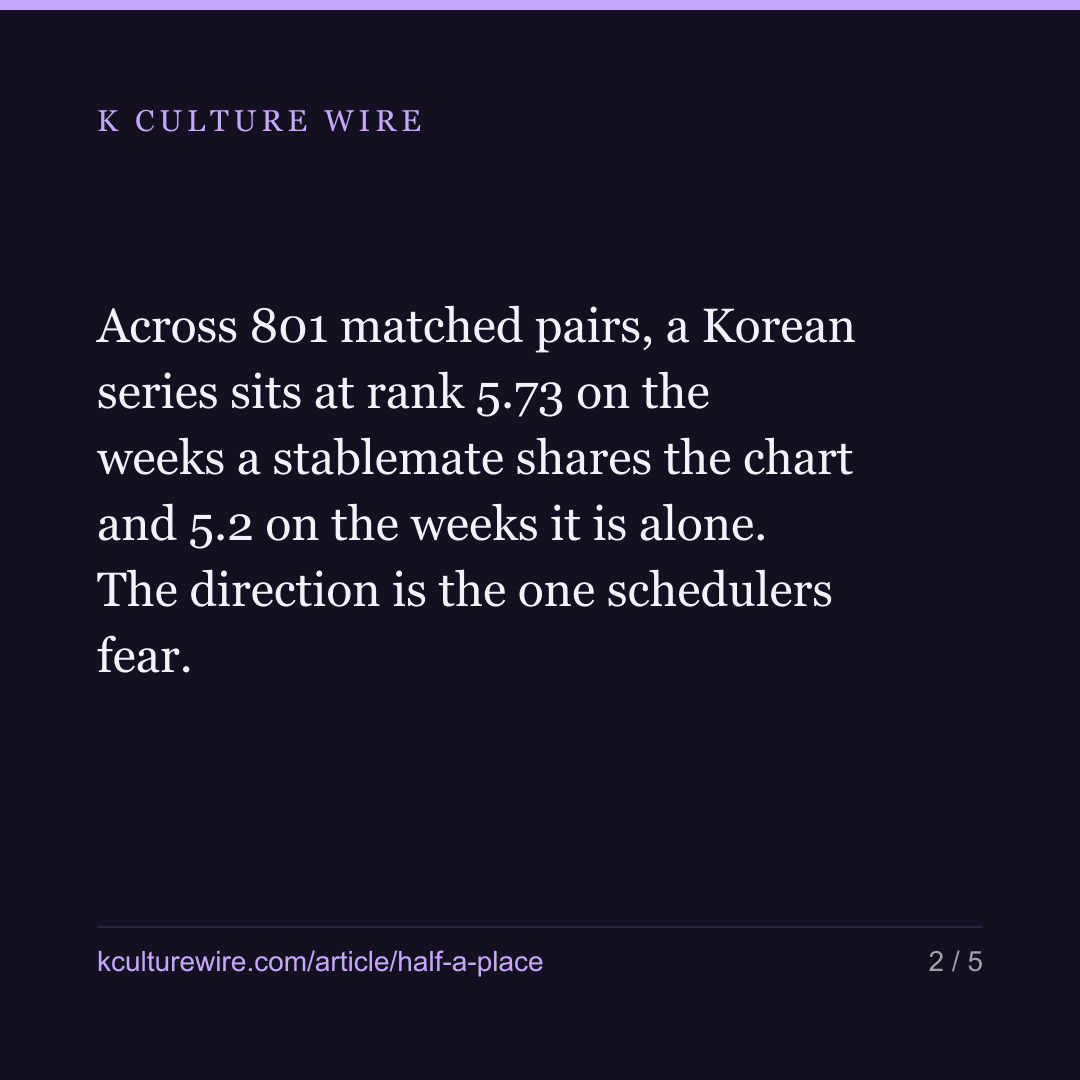
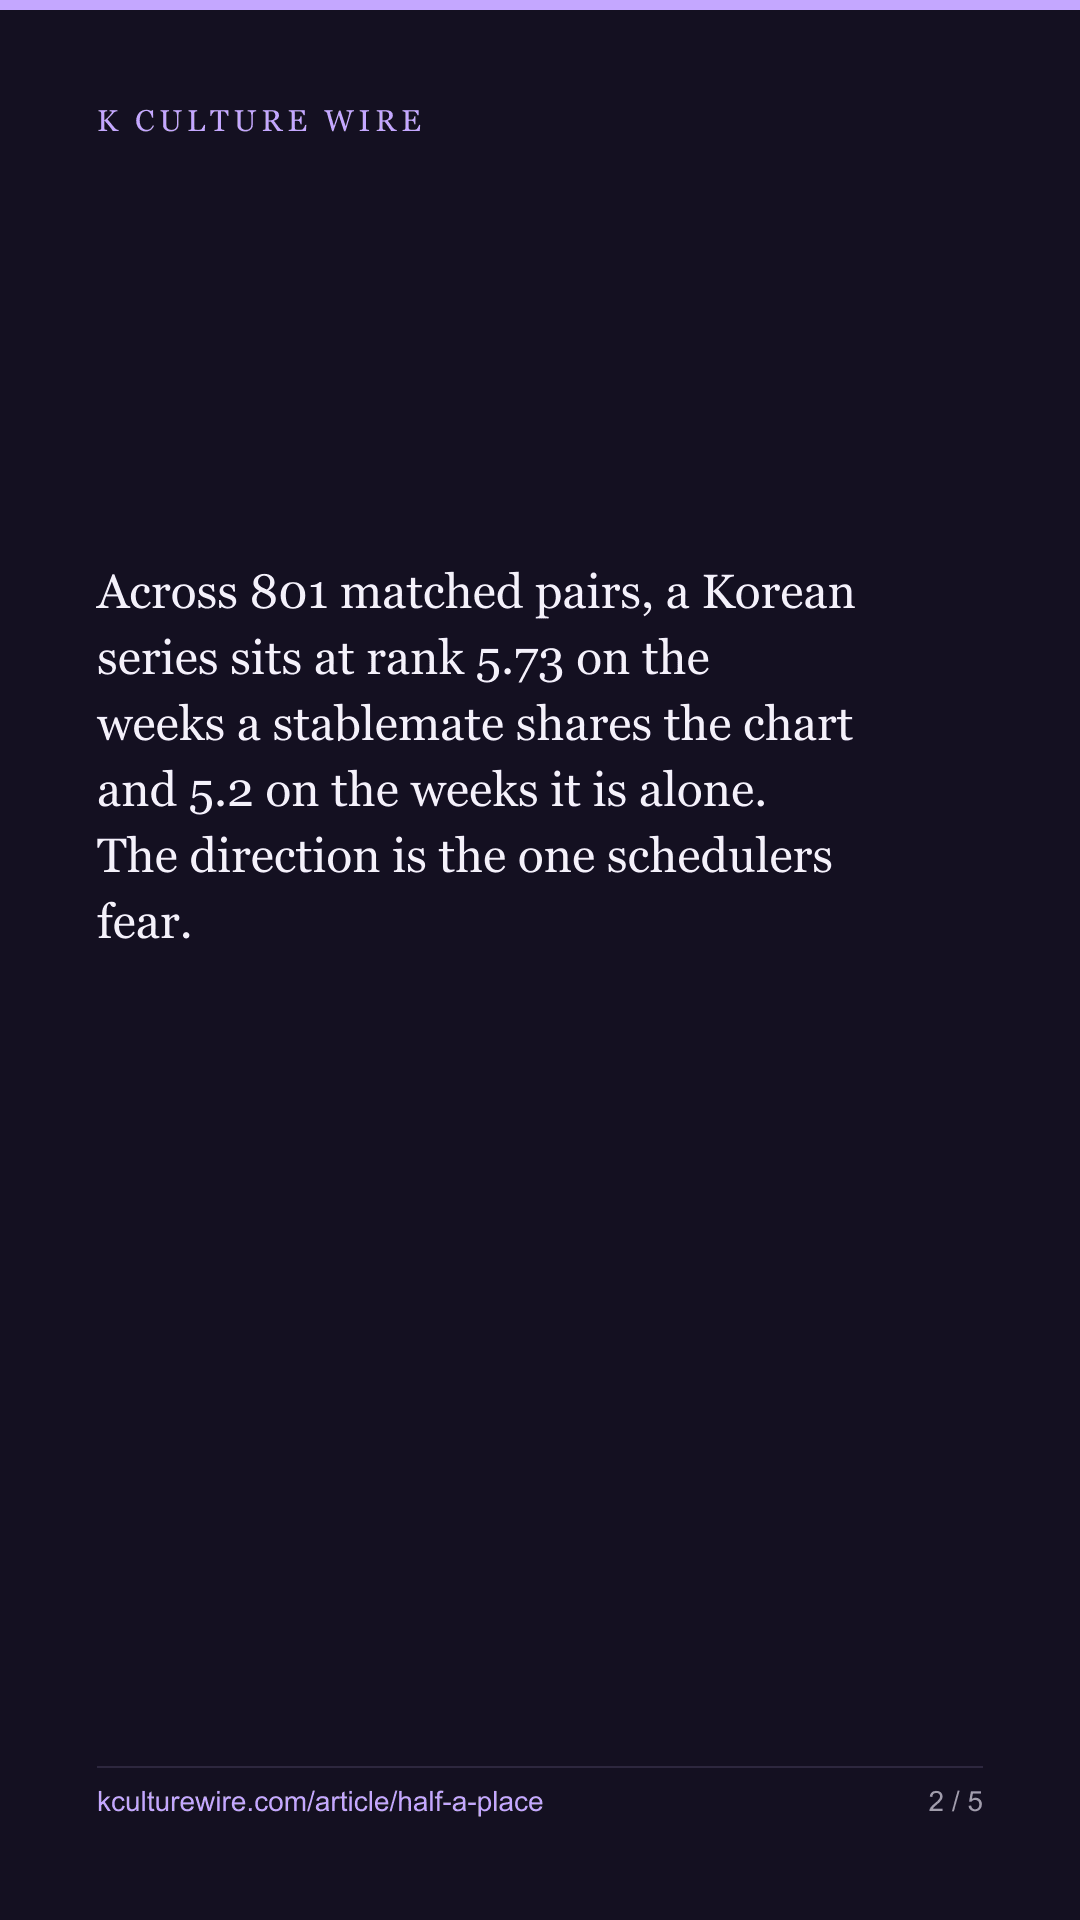
Across 801 matched pairs, a Korean series sits at rank 5.73 on the weeks a stablemate shares the chart and 5.2 on the weeks it is alone. The direction is the one schedulers fear. The size is half of one place out of ten.
The table this is written from: /siblings
A country’s Netflix top 10 has ten places in it. A Korean company with two series charting at once is occupying two of them, and the fear inside a distribution meeting is obvious: our own shows are taking each other’s oxygen, so hold one back.
That fear is testable. Netflix publishes each country’s weekly chart with a rank and its own “weeks in top 10” counter; Wikidata records which company produced, first broadcast or distributed each Korean title. Put the two together and you can watch a single series in a single country and ask what happened on the weeks a stablemate was beside it.
The answer is half a place.
| A Korean series on a country’s chart | Average rank |
|---|---|
| On the weeks it was there alone | 5.2 |
| On the weeks a series from the same company was also there | 5.73 |
| Difference | 0.53 |
Rank 1 is the top of the chart, so a bigger number is a worse position: a series sits lower when its stablemate is beside it. The direction is the one schedulers fear. The size is half of one rank out of ten.
The control that matters is age, not company
The obvious way to get this wrong is to compare a company’s crowded weeks against its uncrowded ones and forget that they are not the same weeks.
A title’s rank falls as its run goes on — it opens high and slides. A company’s second title usually arrives after the first has been out a while. So “weeks with a sibling” and “weeks later in the run” are largely the same weeks, and a naive comparison would hand the slide to the sibling and call it cannibalisation.
Netflix supplies the fix in its own data: a weeks-in-top-10 column. Every comparison here is between weeks at a comparable age of the same title in the same country. Split by age band, all four point the same way:
| Age of the title | Pairs | Alone | With a sibling | Difference |
|---|---|---|---|---|
| Weeks 1–2 | 275 | 5.12 | 5.64 | 0.52 |
| Weeks 3–4 | 189 | 5.05 | 5.14 | 0.09 |
| Weeks 5–8 | 261 | 5.29 | 6.13 | 0.84 |
| Week 9 and later | 76 | 5.53 | 6.17 | 0.64 |
No band reaches a whole place. The largest gap is in weeks 5–8, and the smallest is in weeks 3–4, and we are not going to build a story on the difference between 0.09 and 0.84 across a few hundred pairs — the honest summary is that all four are small and all four have the same sign.
The version of this that was wrong
We started by matching weeks at exactly the same age: week 4 against week 4 of the same title in the same country. That produced 205 pairs, and it looked like a small sample.
It was not a small sample. It was a strange one. A title does not reach week 4 twice in one country, so an exact-age match is impossible by construction — the only pairs that survived were runs where Netflix’s week counter had reset, which is not a random subset of anything. Matching inside age bands instead gives 801 pairs across 647 title-and-country runs, at the cost of allowing up to a week of slack within a band. That is the trade we made, and it is the reason the numbers above exist at all.
What was thrown away
| Chart rows read | 499,180 |
| Korean series rows with a company attached | 25,701 |
| Of those, rows with a sibling on the same chart | 5,585 |
| Weeks discarded — no comparable week to match against | 22,684 |
| Pairs that survived | 801 |
Far more was discarded than kept, and that is not a footnote. A week only counts if the same series, in the same country, at a comparable age, also spent a week without a stablemate. Most runs never overlap a stablemate at all, and a run that is always crowded contributes nothing either. What survives is the set of titles that experienced both conditions — which is the only set that can answer the question, and is not the whole catalogue.
What this cannot tell you
It cannot tell you whether a sibling took the other title’s place or whether both rose together and one simply had to sit below the other. Netflix publishes a rank, not the viewing behind it, and never publishes what was not watched. A half-place gap is consistent with mild competition for attention and equally consistent with a company that releases its weaker titles alongside its stronger ones — nothing here separates those.
Why we bothered
Because “don’t release two at once” is a rule of thumb that costs money when it is followed too hard, and nobody had put a number on it. The number is half a place. That is real, it is in the direction the rule assumes, and it is small enough that a company delaying a launch a month to avoid it should want a second reason.
The full tables — all four age bands, the discard counts, and the failed exact-age design set beside the one we used: what happens when stablemates share a chart.
Where these numbers come from
Sources
- Netflix — Tudum weekly Top 10 country lists, series only, 265 weeks to 2026-07-26, 493,600 chart rows, including the weeks-in-top-10 column used to hold a title's age fixed · https://www.netflix.com/tudum/top10
- Wikidata — Production company (P272), original broadcaster (P449) and distributor (P750) on Korean titles, retrieved by item number rather than by name · https://query.wikidata.org
What we checked
- Every comparison is made inside one series in one country, so the title's own strength, its company and that country's appetite for Korean shows are held fixed by construction
- Weeks are matched inside age bands using Netflix's own weeks-in-top-10 column, because a title's rank falls as its run goes on and a company's second title usually arrives later
- All four age bands are reported separately and all four point the same way
- The number of weeks discarded for having no comparable partner is reported beside the number kept, and it is much larger
What we left out, and why
- Films, because Wikidata attaches a company to 92% of Korean series but only 37.7% of films
- Korean series with no company recorded in Wikidata, which cannot be assigned a stablemate either way
- Russia, excluded across this publication because Netflix withdrew and the remaining weeks are not comparable
The data behind this
Written from the same data
Take this away — 10 cards
The figures in this article, as images. Free to repost with the address on them.








If you work in this business
Everything on this page is measured from the same weekly Netflix lists, per market and per title. We publish the pages free; what we sell is the same measurement cut to one company's catalogue — including the figures behind /siblings.
What a company sheet contains, and what it cannot tell you →