A Korean company that charts once charts there 4x as often
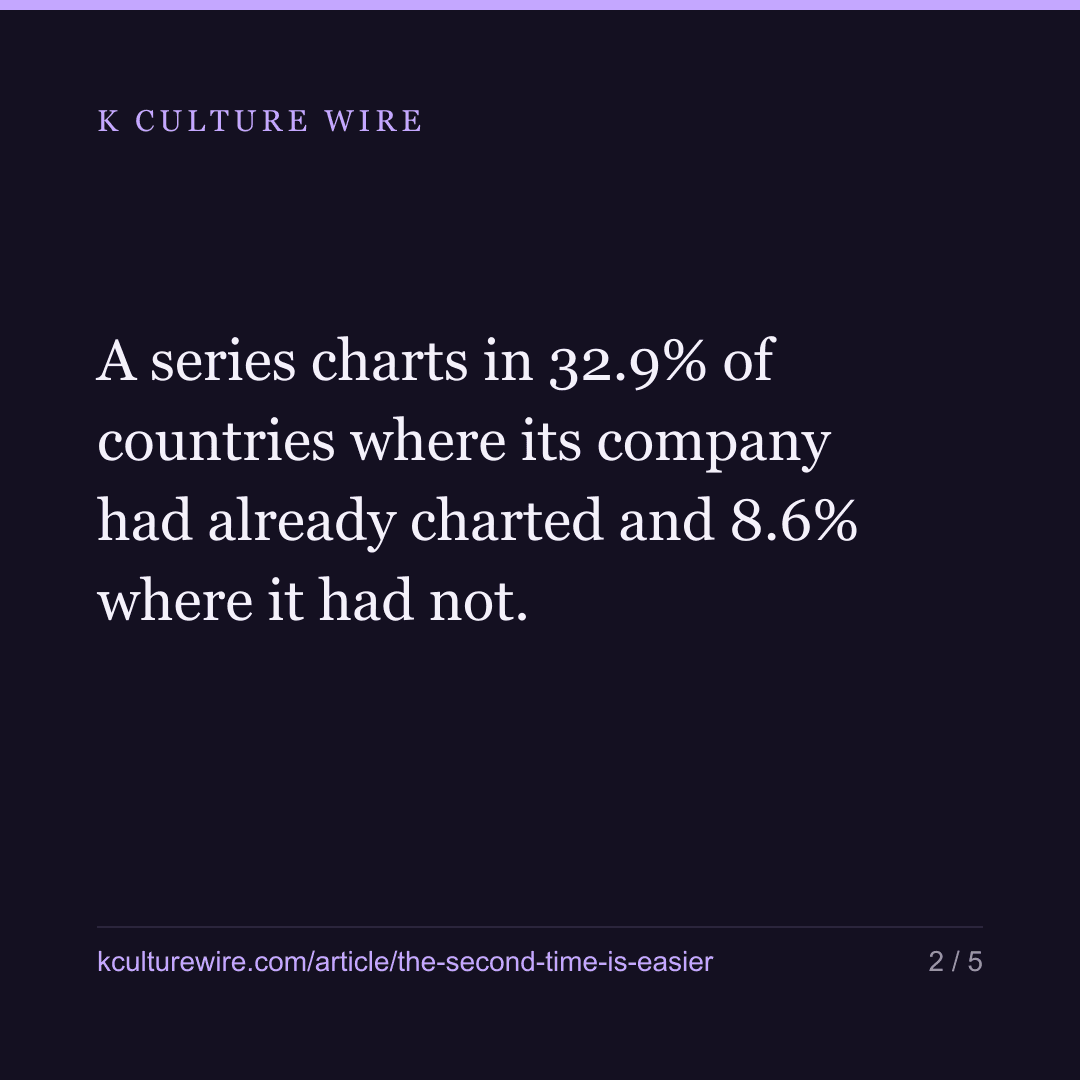
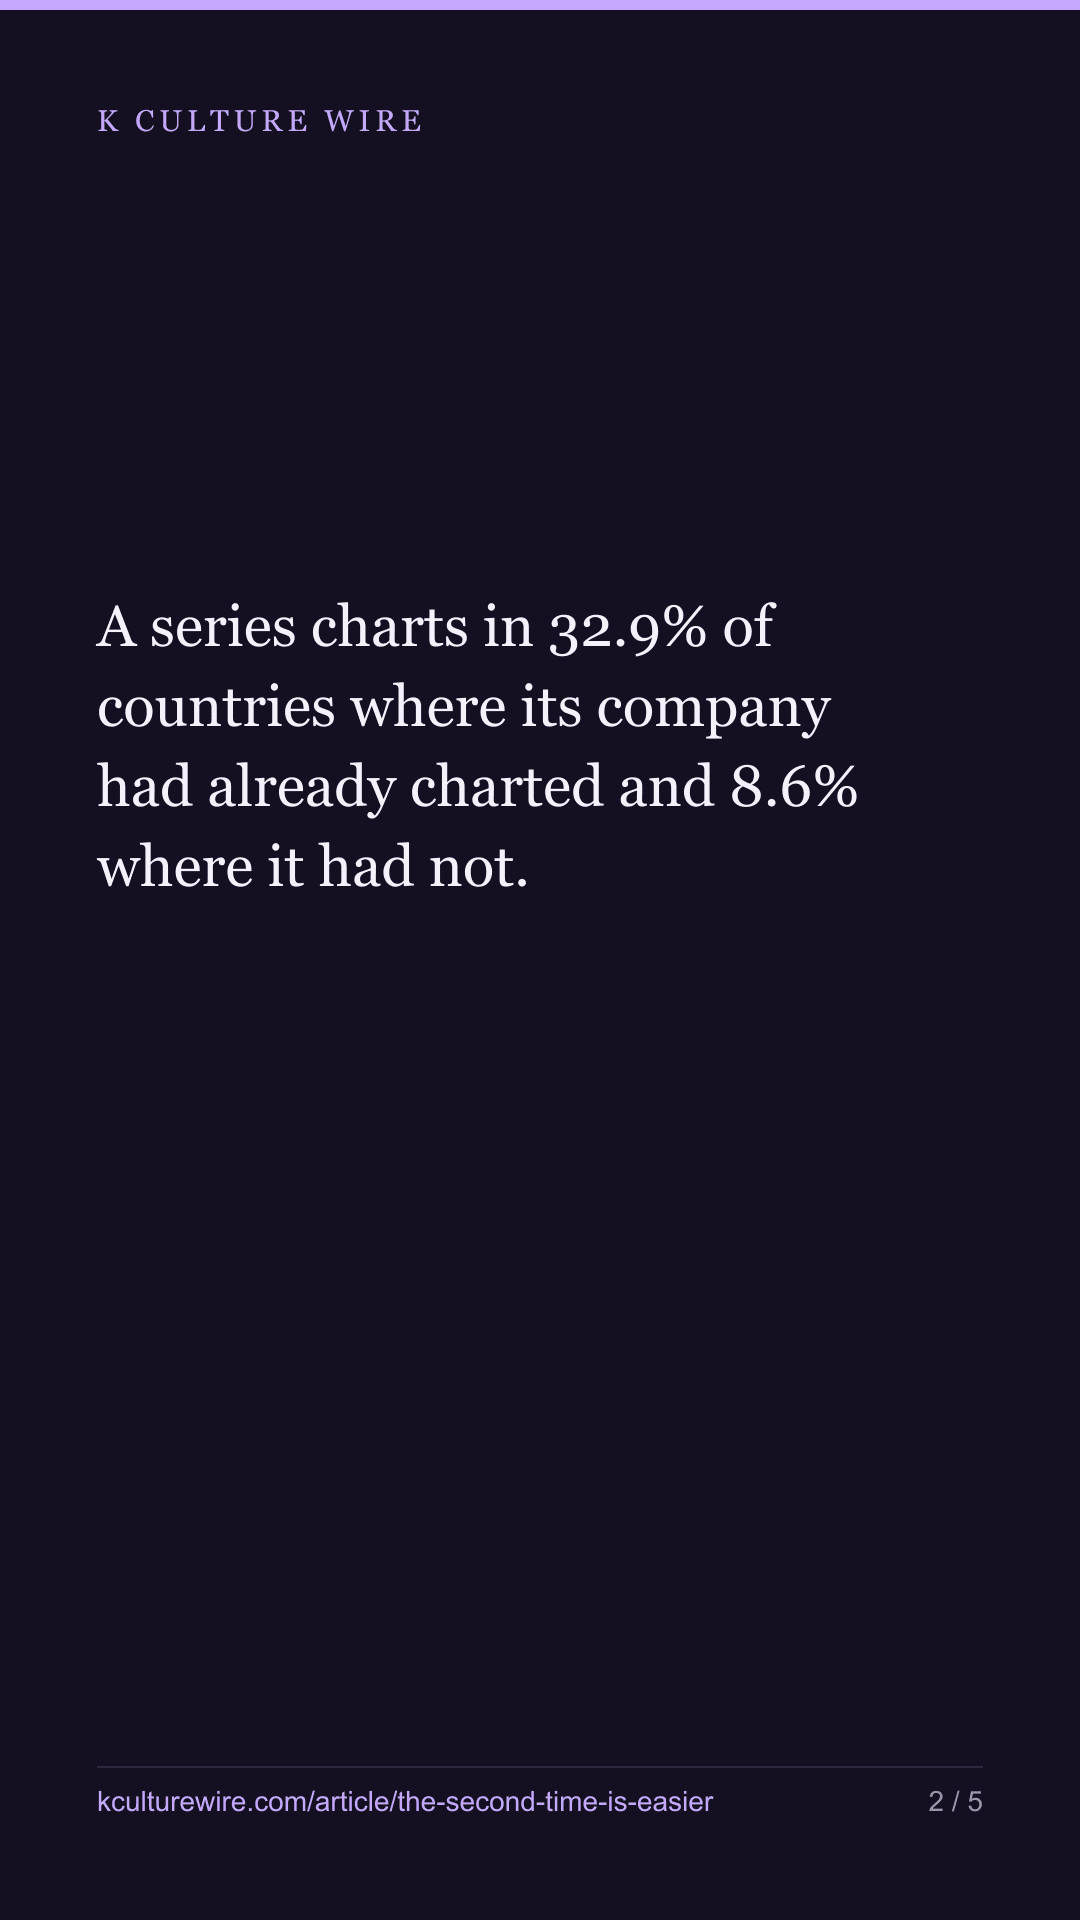
A series charts in 32.9% of countries where its company had already charted and 8.6% where it had not. Comparing each series against itself removes age, strength and size, and the gap widens. It reverses in seven markets, five English.
The table this is written from: /foothold
A Korean production company deciding where to push its next series has one piece of evidence it trusts more than any other: the last one. If a show landed in Vietnam, the thinking goes, the next one has a running start there.
We can check that. Netflix publishes a weekly top 10 for each country; Wikidata records which company produced, first broadcast or distributed each Korean title. Join the two — 499,180 chart rows against the catalogues of 72 Korean companies with more than one series that ever charted — and you can ask, for every company and every country, whether a series charted in the places its company had already reached, and whether that is different from the places it had not.
It is different. A series charts in 33.4% of the countries where its company had already charted, and 8.6% of the countries where it had not. Four times as often.
That number is easy to get wrong, so most of this article is about the three ways it could have been an artefact, and what happened to it when we removed them.
The first objection: bigger companies
The obvious complaint is that this measures company size. A company with twenty charting series has footholds nearly everywhere and also has twenty chances to chart again; a company with two has neither. Line those up together and you will find that footholds “predict” success, when all you have found is that large catalogues are large.
So no comparison here is ever made between two companies. Every figure compares one company’s countries against that same company’s other countries — the ones it had reached against the ones it had not, at the moment its next series arrived. The company is held fixed by construction.
Split the companies into size bands and the gap is in all four:
| Company size (series that charted) | Companies | With a foothold | Without |
|---|---|---|---|
| 2–3 series | 43 | 44.4% | 16.6% |
| 4–6 series | 17 | 43.2% | 12.4% |
| 7–12 series | 5 | 49.7% | 12.8% |
| 13 or more | 9 | 28.9% | 4.3% |
The largest band has the lowest rates on both sides, which is worth a sentence of its own. A company with a big catalogue has many series that chart in only a handful of countries, and those drag both columns down together. What they do not do is close the distance between the columns.
The second objection: the calendar
This one is harder, and it is the one that nearly killed the finding.
A series that has a foothold behind it is, by definition, a later series — the company had to chart somewhere first. Netflix’s country lists grew over the 268 weeks measured here, and Korean titles grew with them. So “with a foothold” and “arrived later” are the same set of series wearing two names, and a rising tide would produce exactly the gap we found.
The fix is to stop comparing series to each other at all.
Take one series. On the weeks it charted, it had a chance in all 93 countries at once. Some of those countries were places its company had already reached; the rest were not. Compare those two groups inside that single series. Same title, same weeks, same company — age cannot differ, strength cannot differ, size cannot differ. Only the foothold does.
455 series can be measured that way.
| Inside one series, on its own weeks | Charted | Chances | Rate |
|---|---|---|---|
| Countries where its company had already charted | 5,426 | 16,488 | 32.9% |
| Countries where it had not | 2,223 | 25,827 | 8.6% |
The gap is 24.3 points. It did not shrink when we removed the calendar — it stayed at 3.8× to 3.8×. Whatever this is, it is not that the world got easier.
The third objection: easy countries
The last complaint is the subtlest. A company’s foothold countries are not a random sample of the world. They are the countries that took a Korean series once, which means they are disproportionately the countries that take Korean series generally. The comparison might be nothing more than good markets against bad ones.
Splitting by country removes that. Inside Vietnam, every chance faces the same Vietnam. Of the 81 markets with at least 30 chances on each side, 74 point the same way. Seven do not.
| Market | With a foothold | Without |
|---|---|---|
| CA | 0% | 3.1% |
| FI | 3.2% | 3.2% |
| GB | 1.3% | 3.8% |
| IE | 1.3% | 3.1% |
| LT | 3.4% | 4.2% |
| TT | 5% | 5.2% |
| US | 0% | 2.3% |
Alphabetical, not ranked. Four of the five are English-speaking, and the reversal is not marginal: in Canada, Great Britain and Ireland a company’s foothold countries did worse than its non-foothold ones by a factor of two or more.
The United States row is the one to sit with. 0% is not a rounding artefact — across every chance a Korean company had in the American chart after already charting there, it did not chart again. Not once. The comparison column, the countries where the same companies had no American history, ran at 2.4%.
We are not going to explain that, because this data does not contain the explanation. What we will say is that a company reasoning from an earlier American placement is reasoning from the single market where the pattern it is counting on runs backwards.
What this cannot tell you
It cannot tell you why. A foothold might genuinely help — a country’s audience remembers the company’s earlier show, or Netflix’s own promotion follows a producer that worked there before. Or a company whose sensibility suits one country may simply keep suiting it, in which case the foothold is a symptom rather than a cause and the second series was always going to land. Netflix publishes neither its promotion decisions nor its commissioning ones, and nothing in these lists separates the two stories.
Two limits are worth naming plainly. 64 companies are absent from every figure above — the ones whose catalogue contains a single series that ever charted. They have no next series, so the question cannot be put to them, and everything here therefore describes companies that have already charted twice. And films are excluded throughout: Wikidata names a company for 92% of Korean series but only 37.7% of films, and a half-empty list would make the less-documented companies look small rather than undocumented.
Why we bothered
Because this is the question a company pays to have answered, and the honest version of the answer is more useful than the confident one. “Your last hit helps the next one” is worth something. “Your last hit helps the next one, by a factor of four, everywhere except the seven markets where your board is most likely to be looking” is worth more.
The full tables — all four size bands, all 79 markets, the coverage figures, and the three controls laid out beside each other: does a foothold help.
Where these numbers come from
Sources
- Netflix — Tudum weekly Top 10 country lists, series only, 268 weeks to 2026-08-16, 499,180 chart rows across 93 markets · https://www.netflix.com/tudum/top10
- Wikidata — Production company (P272), original broadcaster (P449) and distributor (P750) on Korean titles, retrieved by item number rather than by name · https://query.wikidata.org
What we checked
- Every comparison is made inside a single company, never between two companies, because a bigger company has both more footholds and more chances and comparing companies would measure size instead
- The headline figure is measured inside a single series on a single set of weeks, so the age of the series, its strength and the size of its company are all held fixed and cannot produce the gap
- The four company-size bands are reported separately and the gap appears in all four, including the band with the lowest rates on both sides
- Every market with at least 30 chances on each side is reported, and the five where the pattern reverses are named rather than dropped
What we left out, and why
- Films, because Wikidata attaches a company to 92% of Korean series but only 37.7% of films, and measuring on a half-empty list would make less-documented companies look smaller
- 64 companies whose catalogue contains only one series that ever charted, because a company with no next series cannot be asked whether the next one was easier
- Russia, excluded across this publication because Netflix withdrew and the remaining weeks are not comparable
The data behind this
Written from the same data
Take this away — 10 cards
The figures in this article, as images. Free to repost with the address on them.






If you work in this business
Everything on this page is measured from the same weekly Netflix lists, per market and per title. We publish the pages free; what we sell is the same measurement cut to one company's catalogue — including the figures behind /foothold.
What a company sheet contains, and what it cannot tell you →