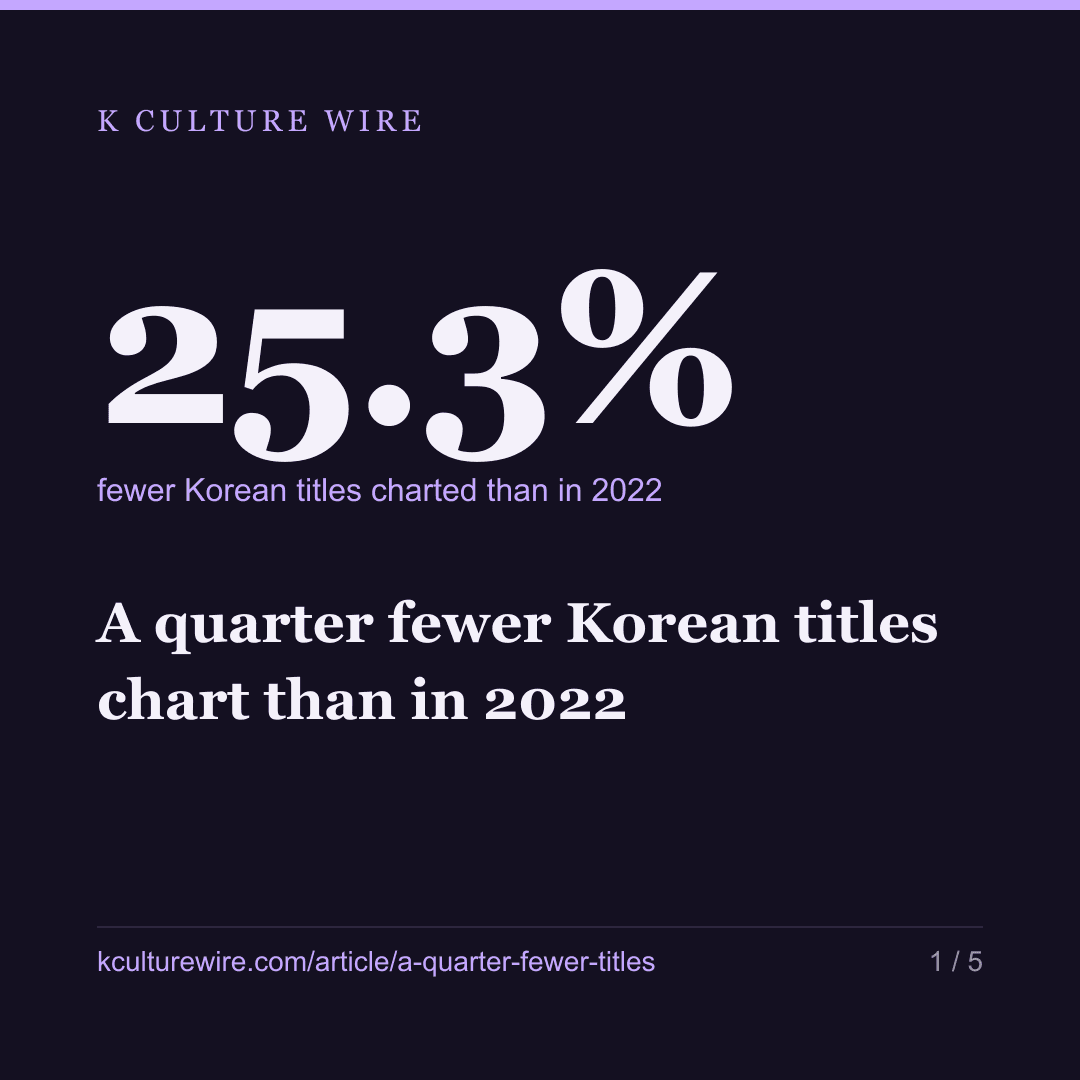
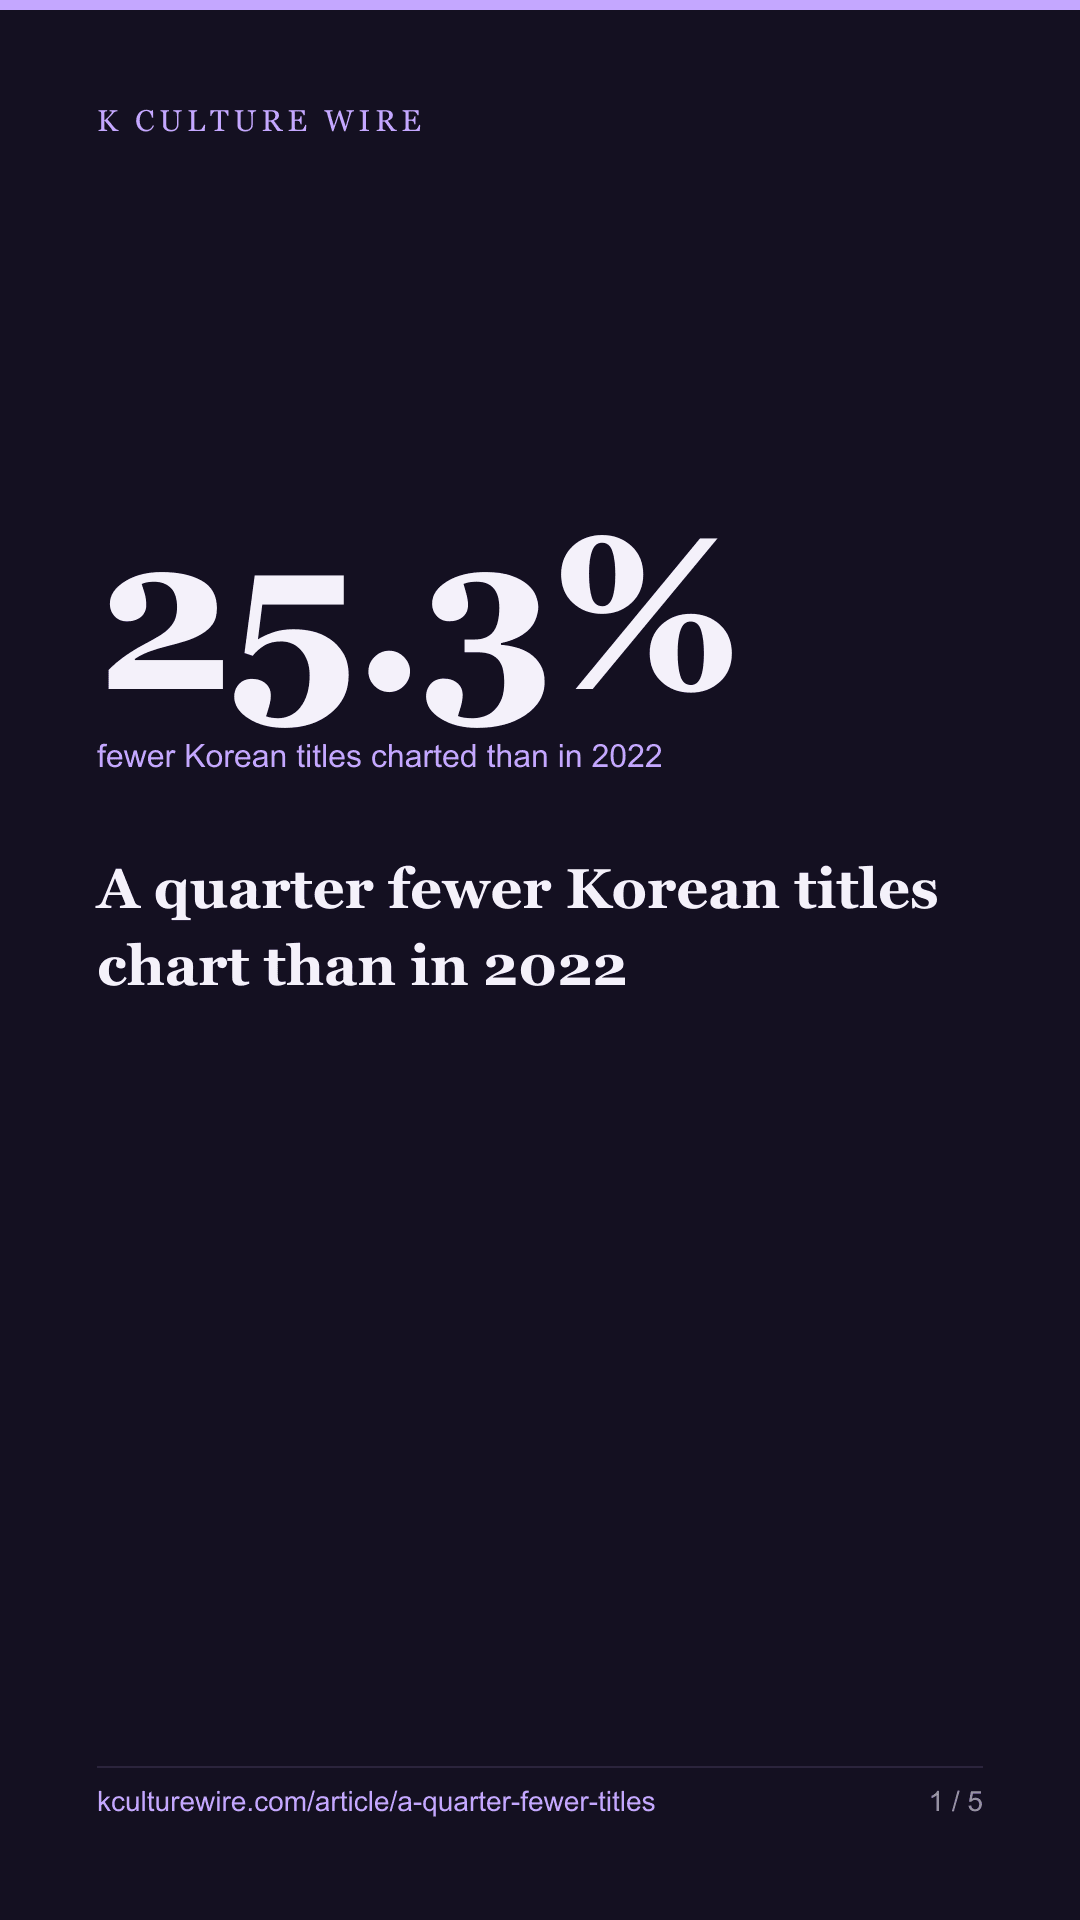
A quarter fewer Korean titles chart than in 2022
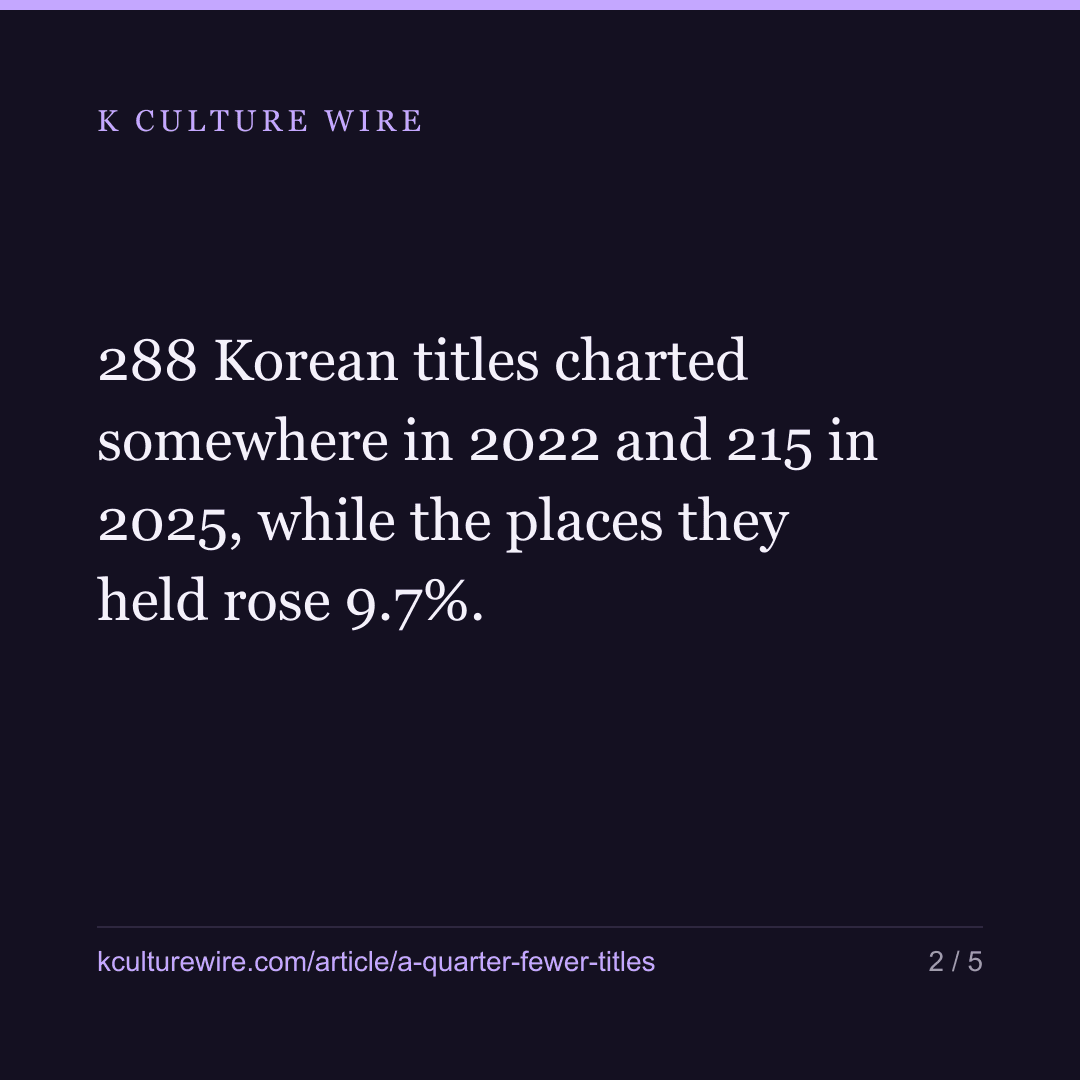
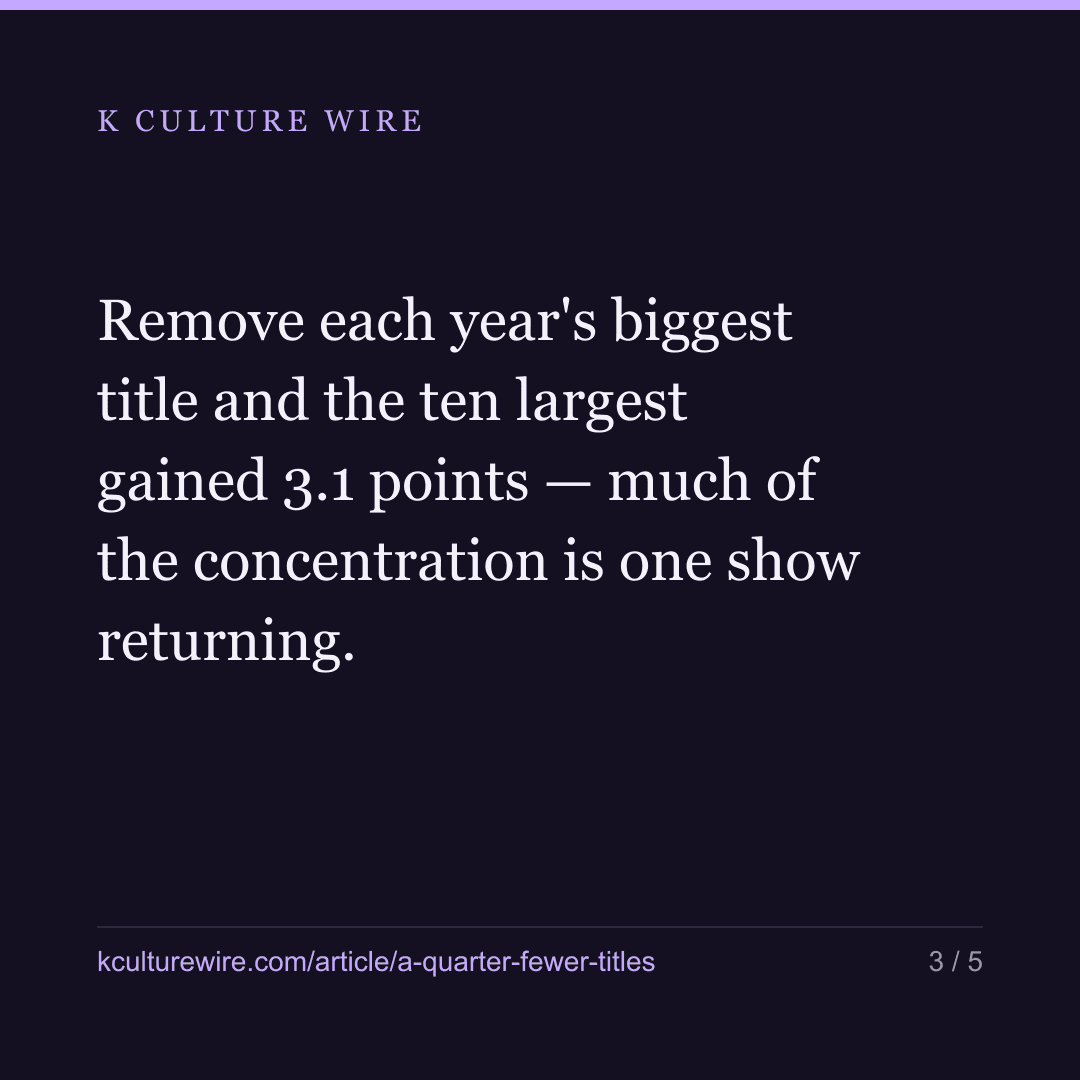
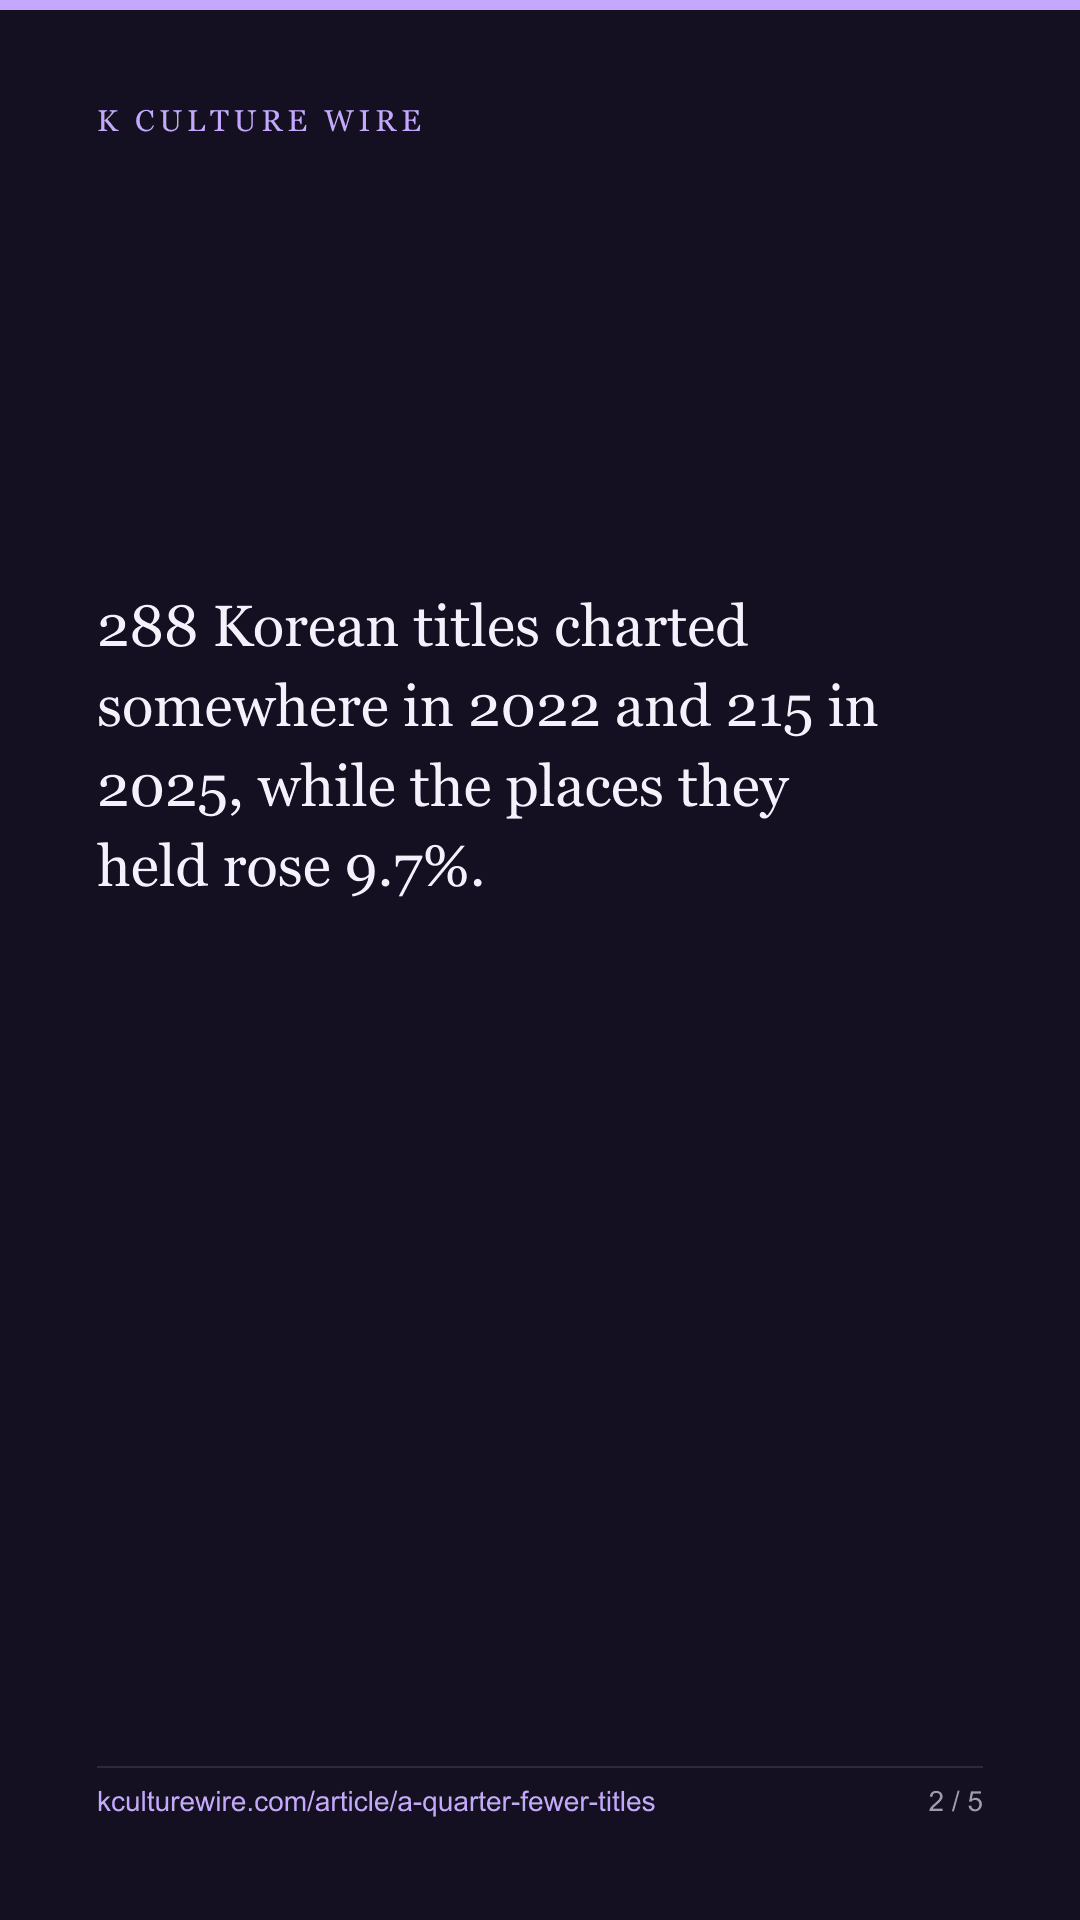
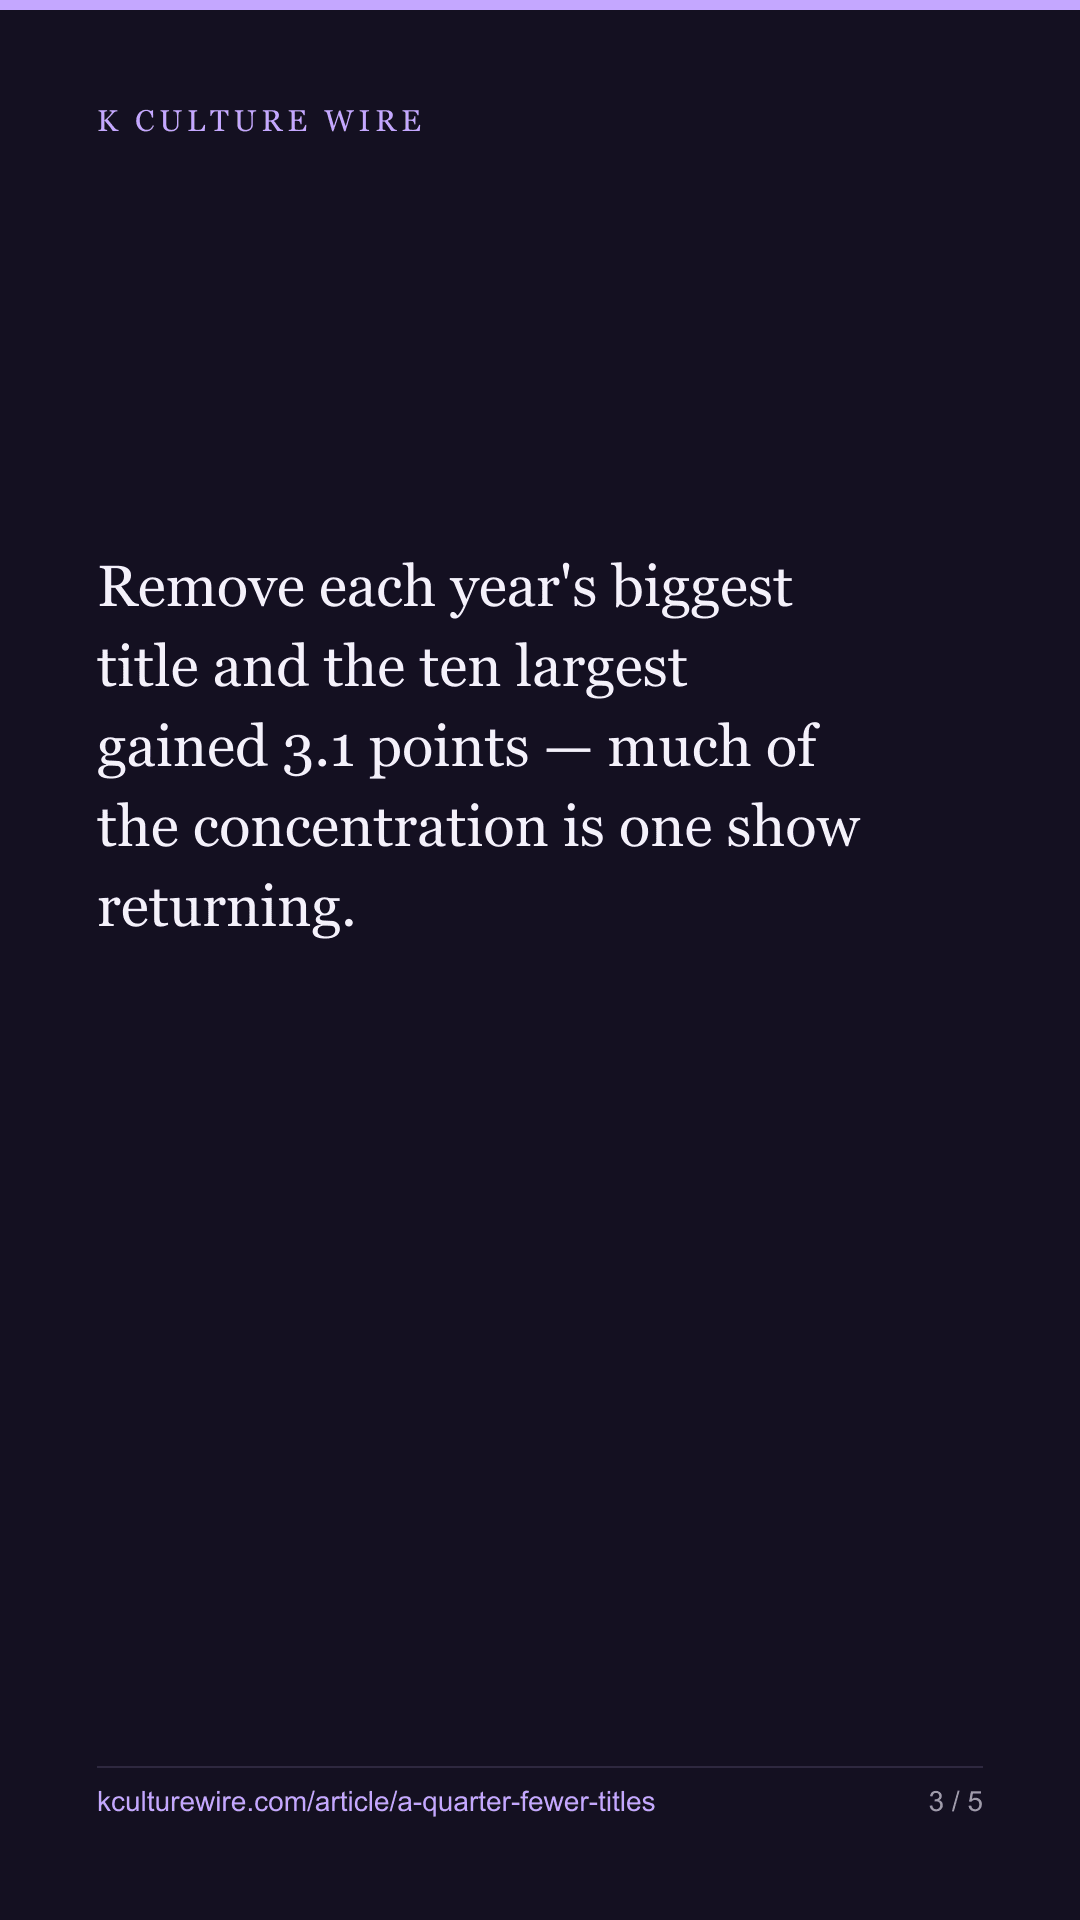
288 Korean titles charted somewhere in 2022 and 215 in 2025, while the places they held rose 9.7%. Remove each year's biggest title and the ten largest gained 3.1 points — much of the concentration is one show returning.
The table this is written from: /fewer-titles
Netflix has announced a larger Korean slate for 2026. Its own charts have been moving the other way: 289 Korean titles reached a country top 10 somewhere in 2022, and 216 did in 2025 — a fall of 25.3% across the four full years we hold.
The obvious reading is that Korean titles are losing ground. They are not. The places those titles held went up. The full table, every year including the part years, is at fewer titles, same shelf; the company-level version of the same question is at did the charts concentrate.
| Year | Titles that charted | Chart places held | Places per title |
|---|---|---|---|
| 2021 (part year) | 177 | 4,131 | 23.3 |
| 2022 | 288 | 7,223 | 25.1 |
| 2023 | 291 | 8,123 | 27.9 |
| 2024 | 236 | 6,645 | 28.2 |
| 2025 | 215 | 7,923 | 36.9 |
| 2026 (part year) | 167 | 5,094 | 30.5 |
Same shelf, a quarter fewer titles on it. Places per title rose from 25.1 to 36.9.
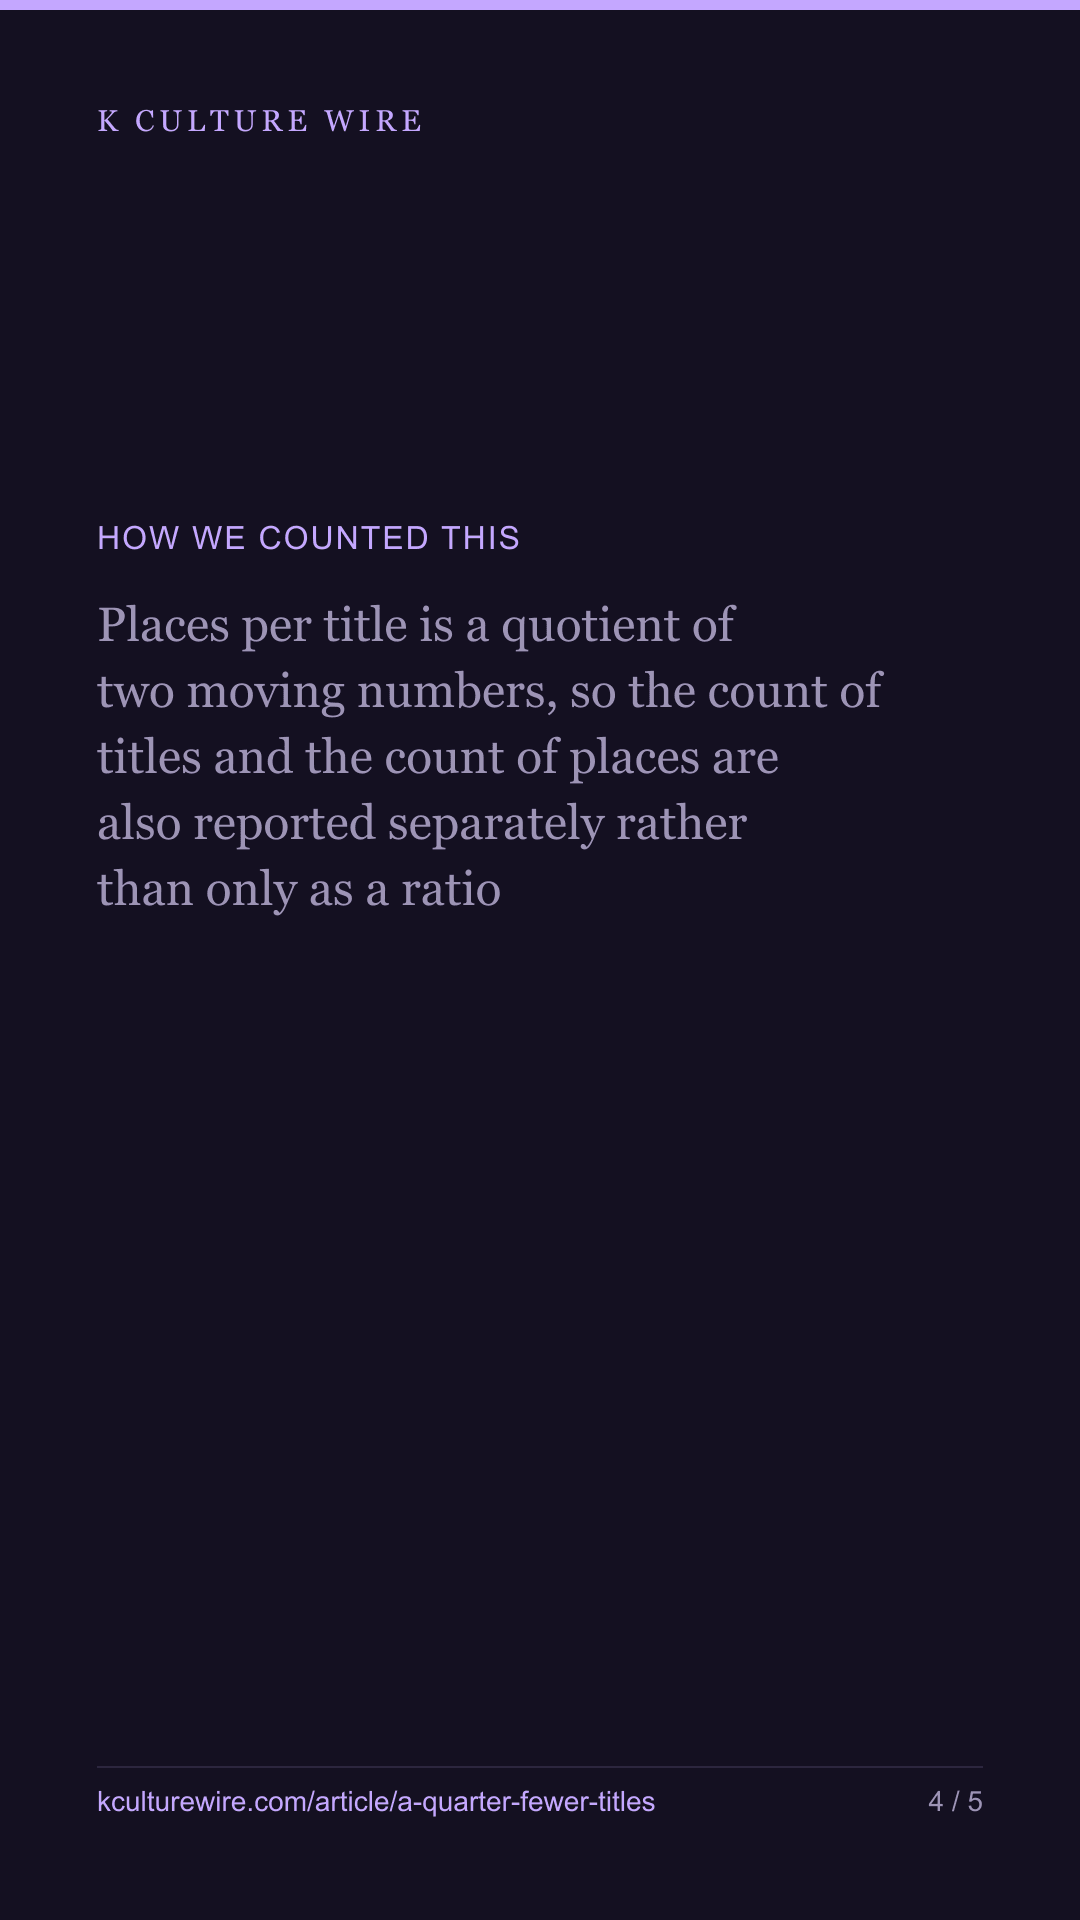
That last column is the one to distrust. It is one number divided by another, both of which moved, and on its own it cannot say which. So we took it apart.
Where the places went
| Year | Ten biggest titles hold | Same, biggest title removed | Everyone outside the top ten, per title |
|---|---|---|---|
| 2022 | 45.8% | 43.2% | 14.1 |
| 2023 | 38.6% | 36.6% | 17.7 |
| 2024 | 42% | 41.1% | 17.1 |
| 2025 | 56.4% | 46.3% | 16.9 |
The first column looks like a field closing up: the ten biggest titles went from holding 44.9% of every Korean chart place to 56%.
The second column is the same measurement with each year’s single biggest title taken out, and it tells a much smaller story — 42.3% to 45.9%, a gain of 3.6 points rather than 11.1.
The third says the rest of the field barely moved at all. A title outside the top ten held 14.6 places in 2022 and 17 in 2025.
So the concentration is not a thicker head. It is one title:
| Year | Biggest single title | Its share of all Korean chart places |
|---|---|---|
| 2021 (part year) | Squid Game | 27.1% |
| 2022 | All of Us Are Dead | 8.4% |
| 2023 | The Glory | 7.3% |
| 2024 | Queen of Tears | 6.7% |
| 2025 | Squid Game | 23% |
Between 2022 and 2024 the largest Korean title of the year took 6.7% to 8.4% of all Korean chart places. In 2025 one show took a quarter of them, and it is the same show that took 27.1% in 2021.
We are not naming a second or a third. One title holding a quarter of a year’s places is a fact about the shape of the chart; a list of the ones behind it would be a ranking, and we do not publish those.
What actually changed
Strip out the year that Squid Game returned and what is left is narrow but real:
- 73 fewer Korean titles reached a top 10 in 2025 than in 2022, and the number falling into the smallest band — five chart places or fewer across an entire year — went from 175 to 123.
- The places did not follow them out. Korean titles held 7,388 places in 2022 and 7,972 in 2025.
- The middle did not absorb them either. Places per title outside the top ten went from 14.6 to 17, which is a 16% rise across four years.
Fewer titles, the same shelf space, and no obvious beneficiary among the titles that are still there. The one place the arithmetic lands is the top: 2025’s biggest title held roughly 1,800 chart places against roughly 600 for 2022’s biggest.
That is the chart a 33-title slate is arriving into.
What this cannot tell you
It counts what reached a top 10, not what was released. A year with fewer charting titles may have had fewer Korean titles released, or the same number with fewer of them charting, and Netflix publishes no release counts by country of origin that would separate those. We cannot tell you whether the supply shrank or the chart got harder to reach.
It also says nothing about viewing. A top 10 is a rank list; a title just outside it is invisible here at any level of viewing, and the 71 titles that stopped charting may not have stopped being watched.
And a note on our own arithmetic: seasons of one show are counted as that show. Netflix lists seasons separately on its charts, and if we counted them separately a returning show would look like several new titles — which is exactly the thing this article is trying to measure.
What changed on 3 September 2026
Our list of Korean titles had been frozen at 8 August. We rebuilt it, it went from 397 titles to 420, and one title we had been counting as Korean (Dangerous Liaisons, the 2022 French film) is not. 31 figures in this piece moved with it. None of them changed what the piece found. The ones a reader is most likely to have quoted:
| Was | Now | |
|---|---|---|
| Titles that charted in 2022 | 289 | 288 |
| Chart places held in 2022 | 7,388 | 7,223 |
| Places per title, 2022 | 25.6 | 25.1 |
| Places held, 2025 | 7,972 | 7,923 |
| Growth in places, 2022 to 2025 | 7.9% | 9.7% |
Every table above is now generated from the counted file rather than typed out, and a check reads each figure back out of that file on every build. We print what moved rather than swapping it quietly: one wrong number makes the correct ones beside it worth doubting.
Where these numbers come from
Sources
- Netflix — Tudum weekly Top 10 country lists, 499,180 rows read, 2021-07-04 to 2026-08-16, 93 markets, Russia excluded · https://www.netflix.com/tudum/top10
- Wikidata — Korean titles identified by item number and country of origin, using the same single rule as the rest of this publication · https://query.wikidata.org
What we checked
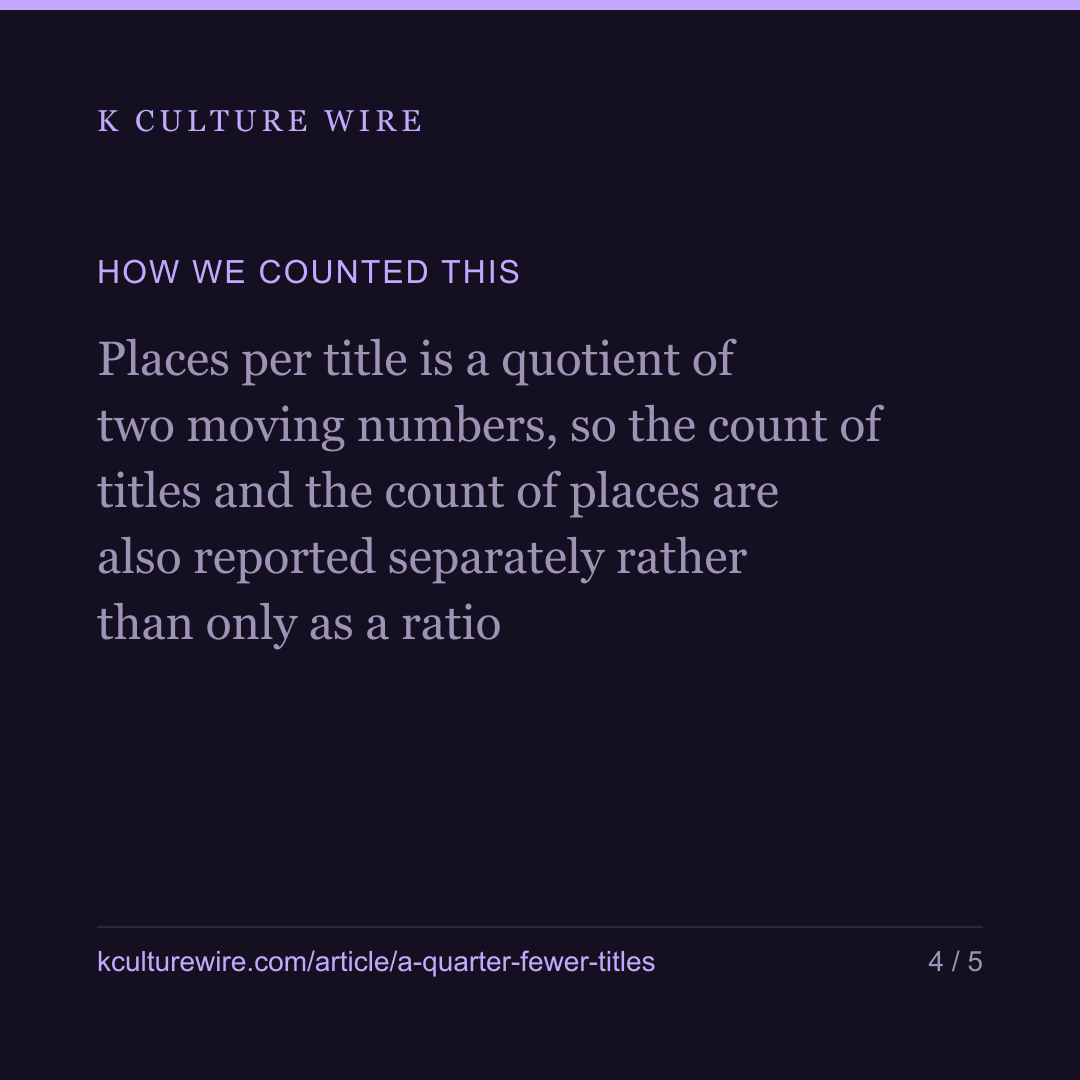
- Places per title is a quotient of two moving numbers, so the count of titles and the count of places are also reported separately rather than only as a ratio
- The share held by the ten biggest titles is repeated with each year's single biggest title removed, because one very large title would otherwise look like a thicker field
- Seasons of one show are counted as that show, so a change in how Netflix labels seasons cannot move the title count
- 2021 and 2026 are part years and are shown as such rather than folded into the comparison
What we left out, and why
- Russia, excluded across this publication because Netflix withdrew and the remaining weeks are not comparable
- Anything about releases: Netflix publishes no count of Korean titles released, so this counts only what charted
The data behind this
Written from the same data
Take this away — 10 cards
The figures in this article, as images. Free to repost with the address on them.

If you work in this business
Everything on this page is measured from the same weekly Netflix lists, per market and per title. We publish the pages free; what we sell is the same measurement cut to one company's catalogue — including the figures behind /fewer-titles.
What a company sheet contains, and what it cannot tell you →