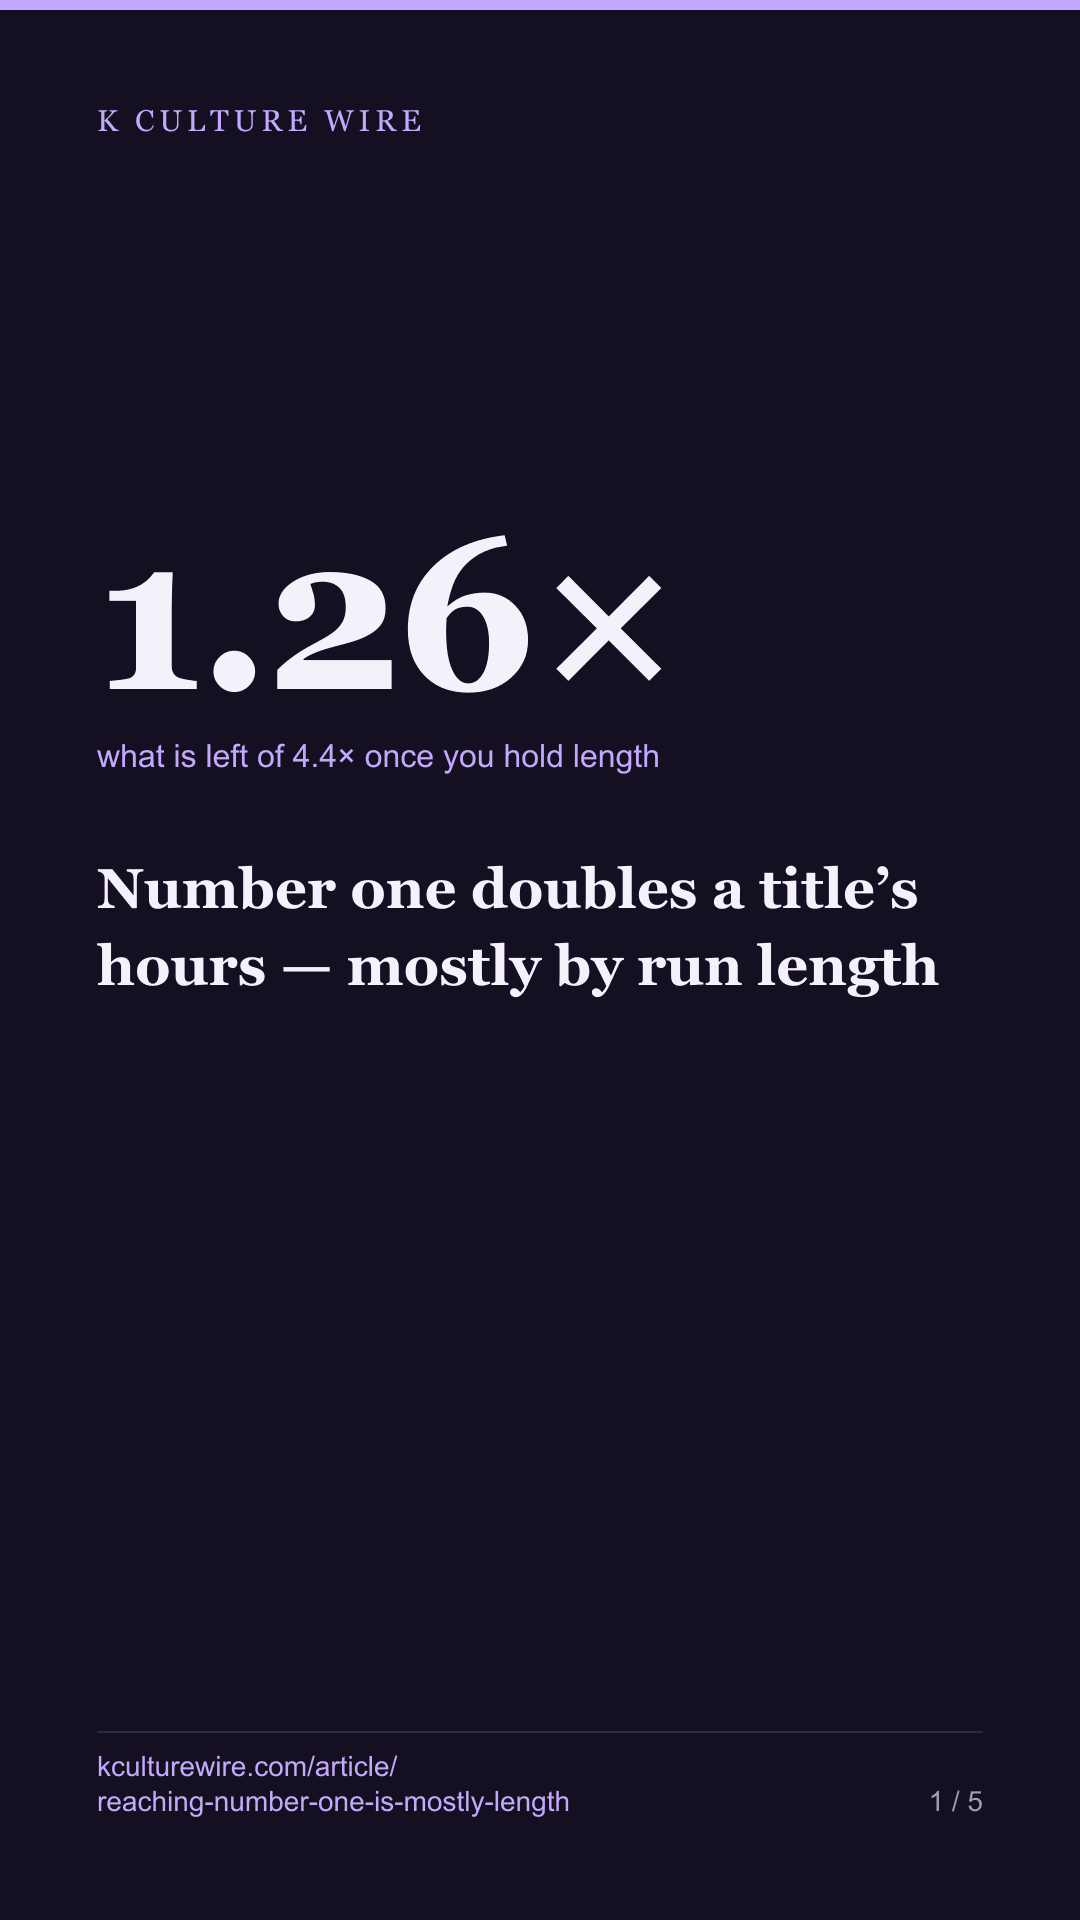
Number one doubles a title’s hours — mostly by run length
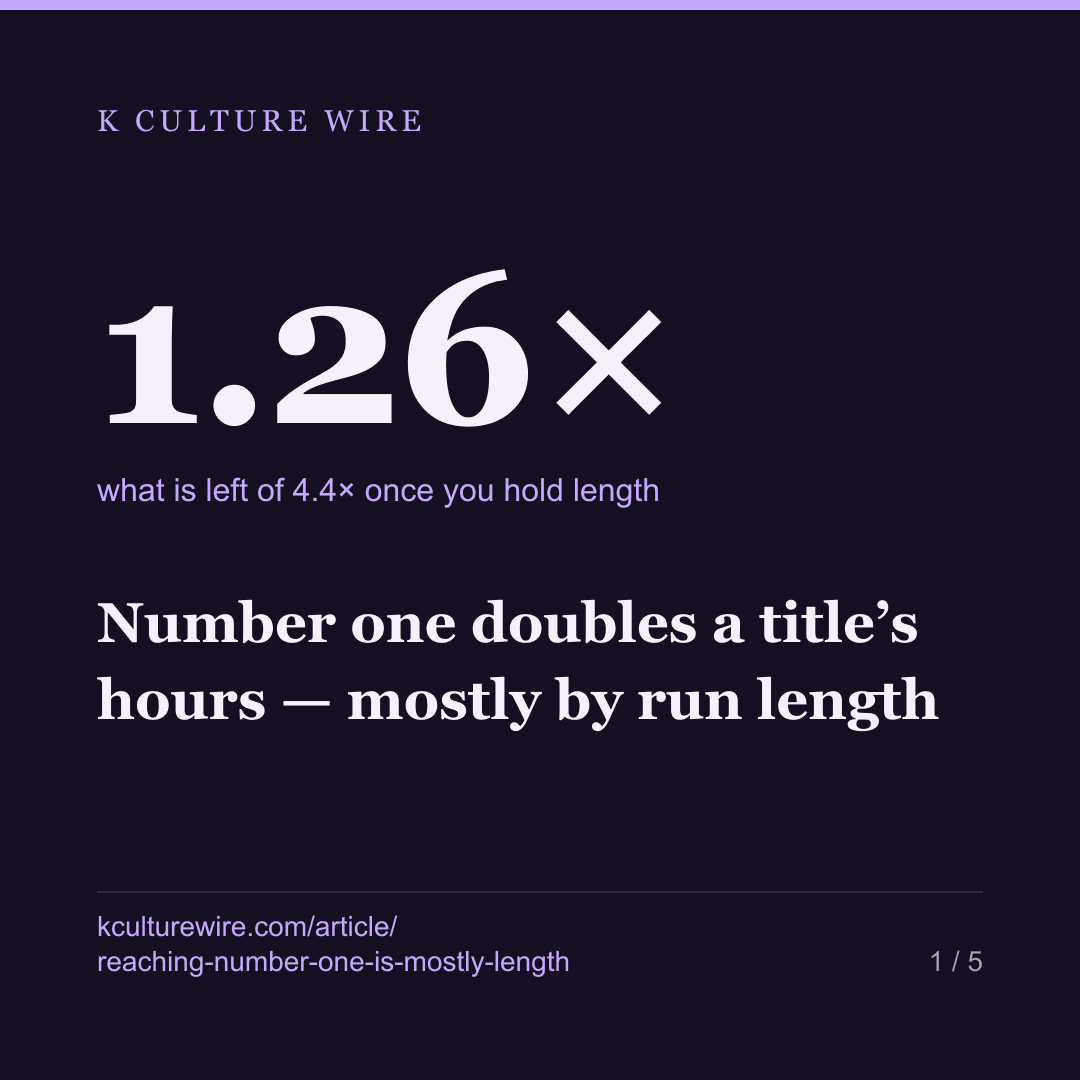
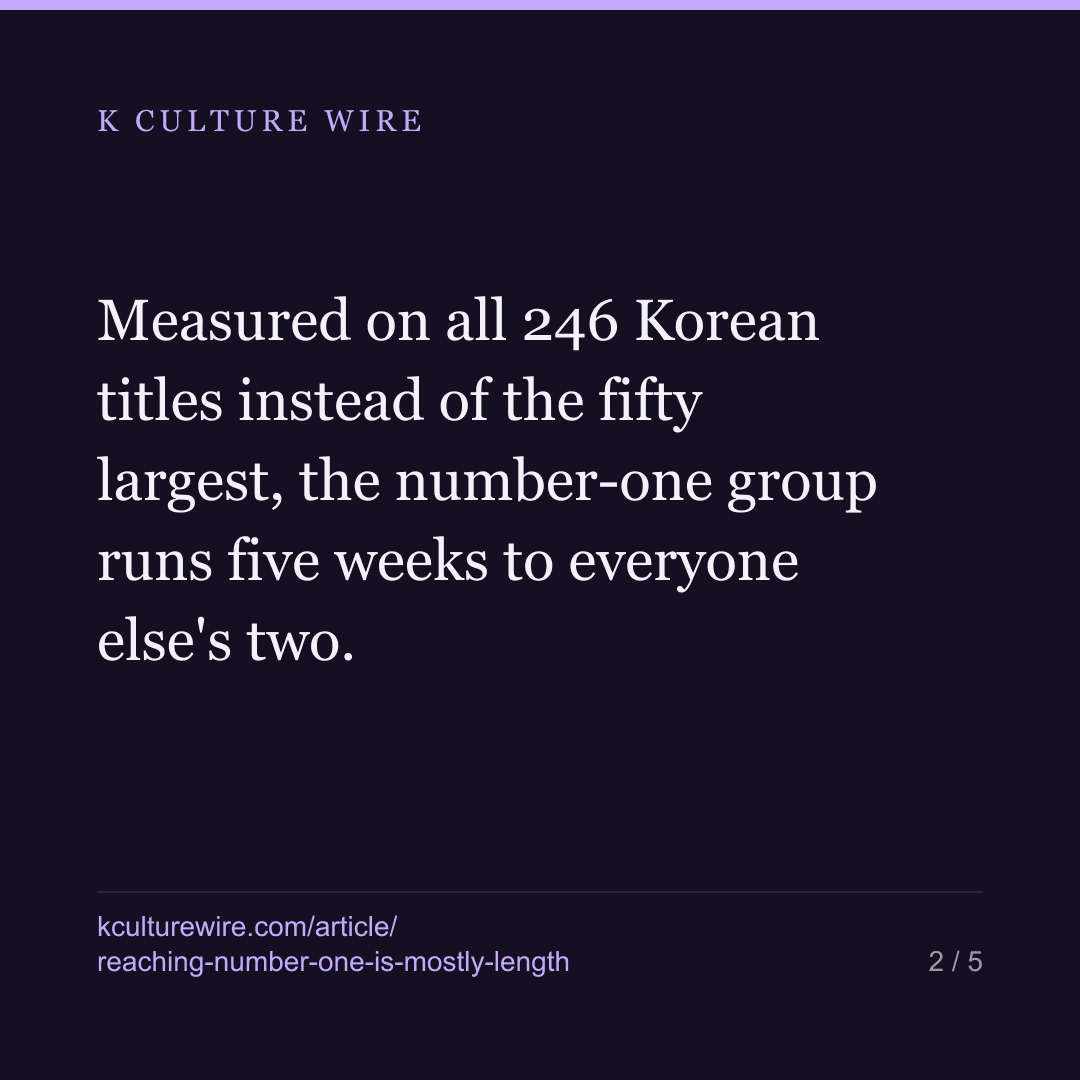
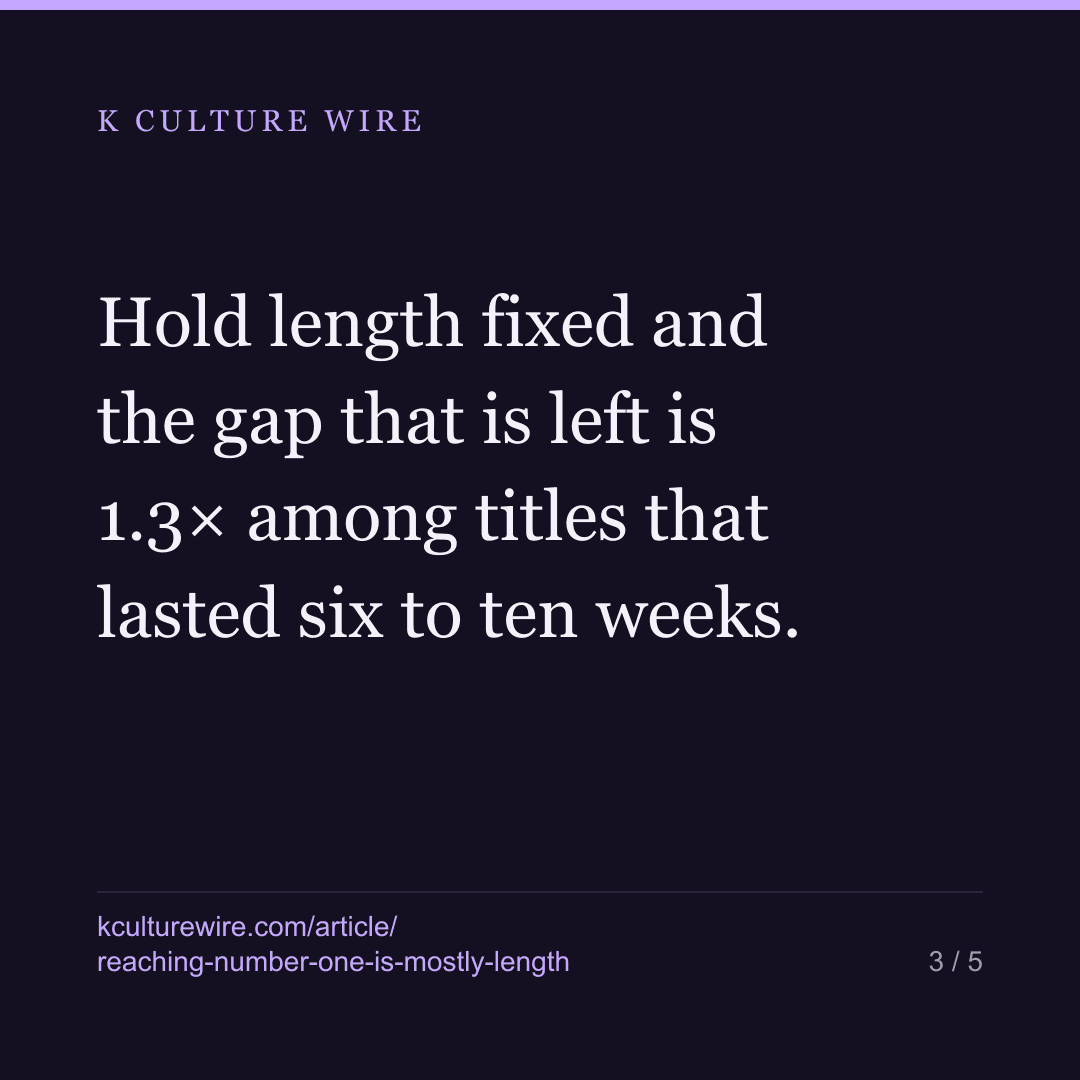
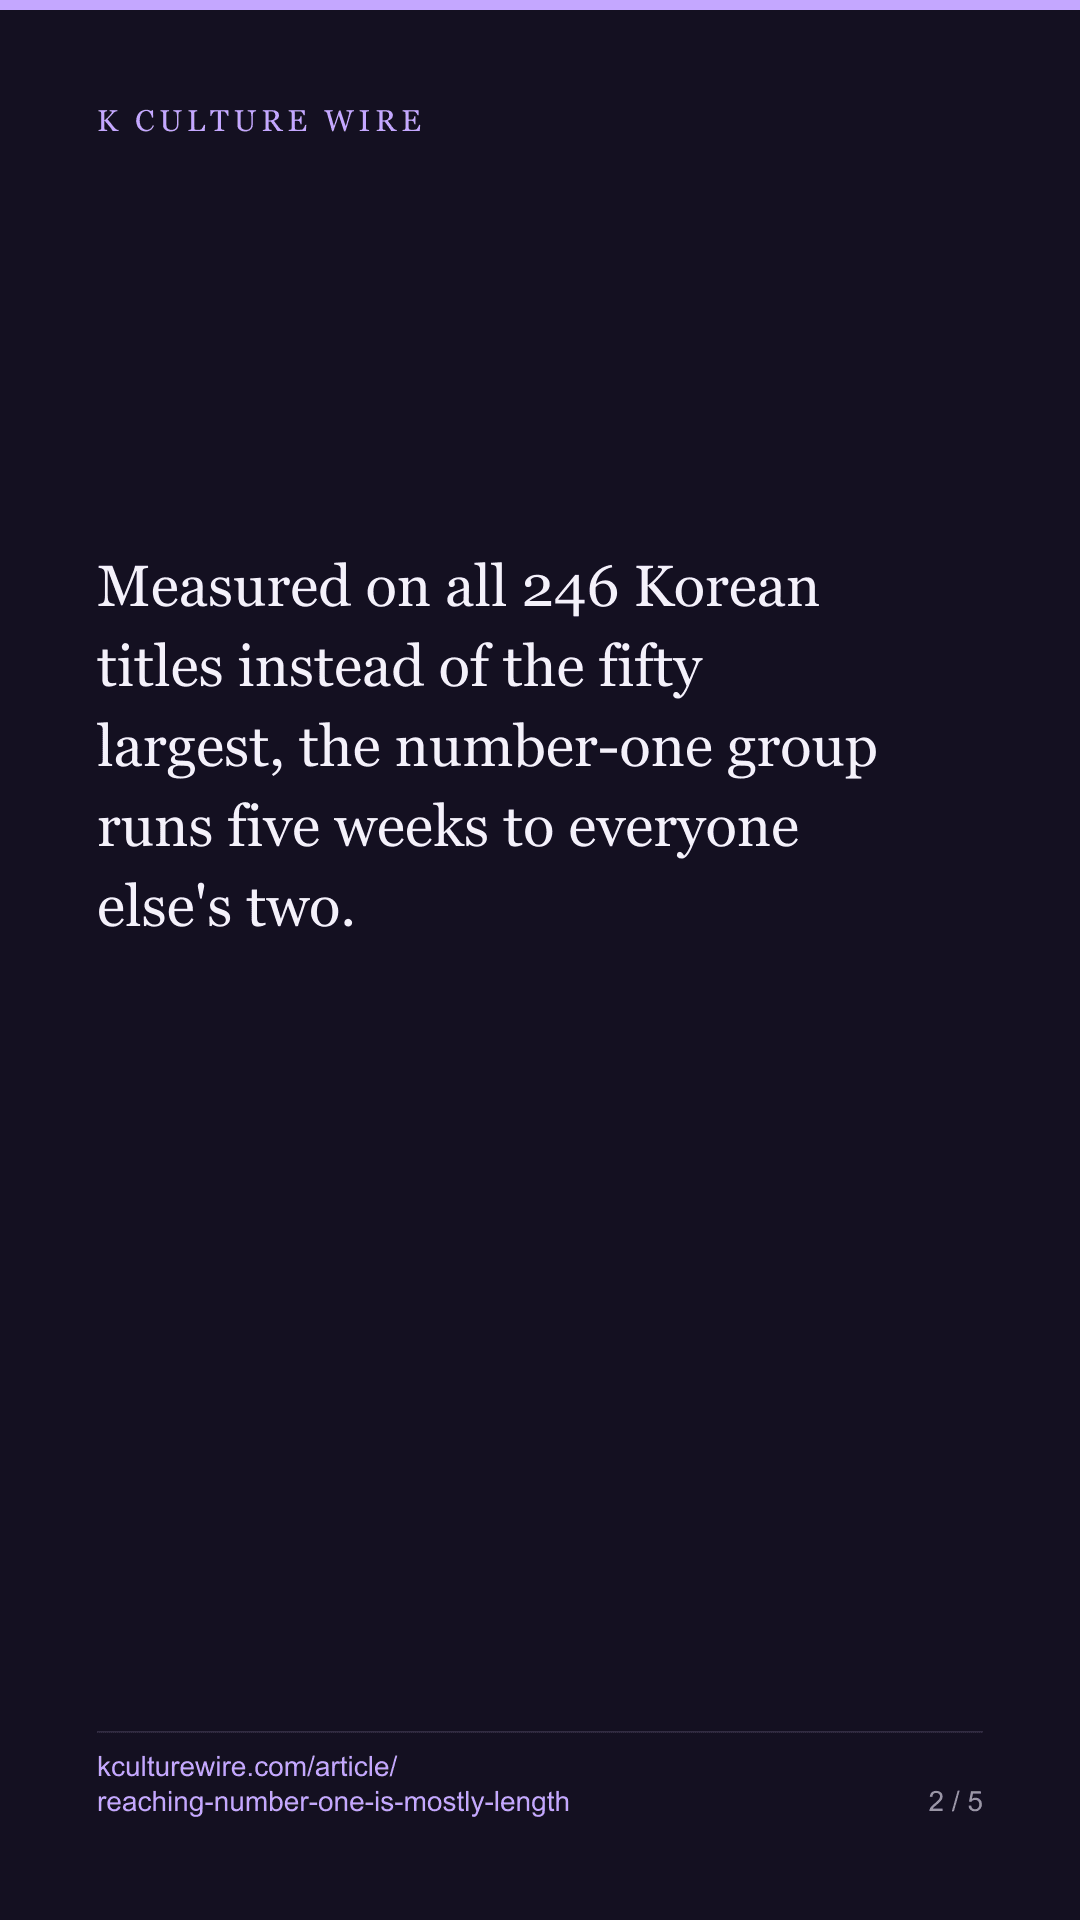
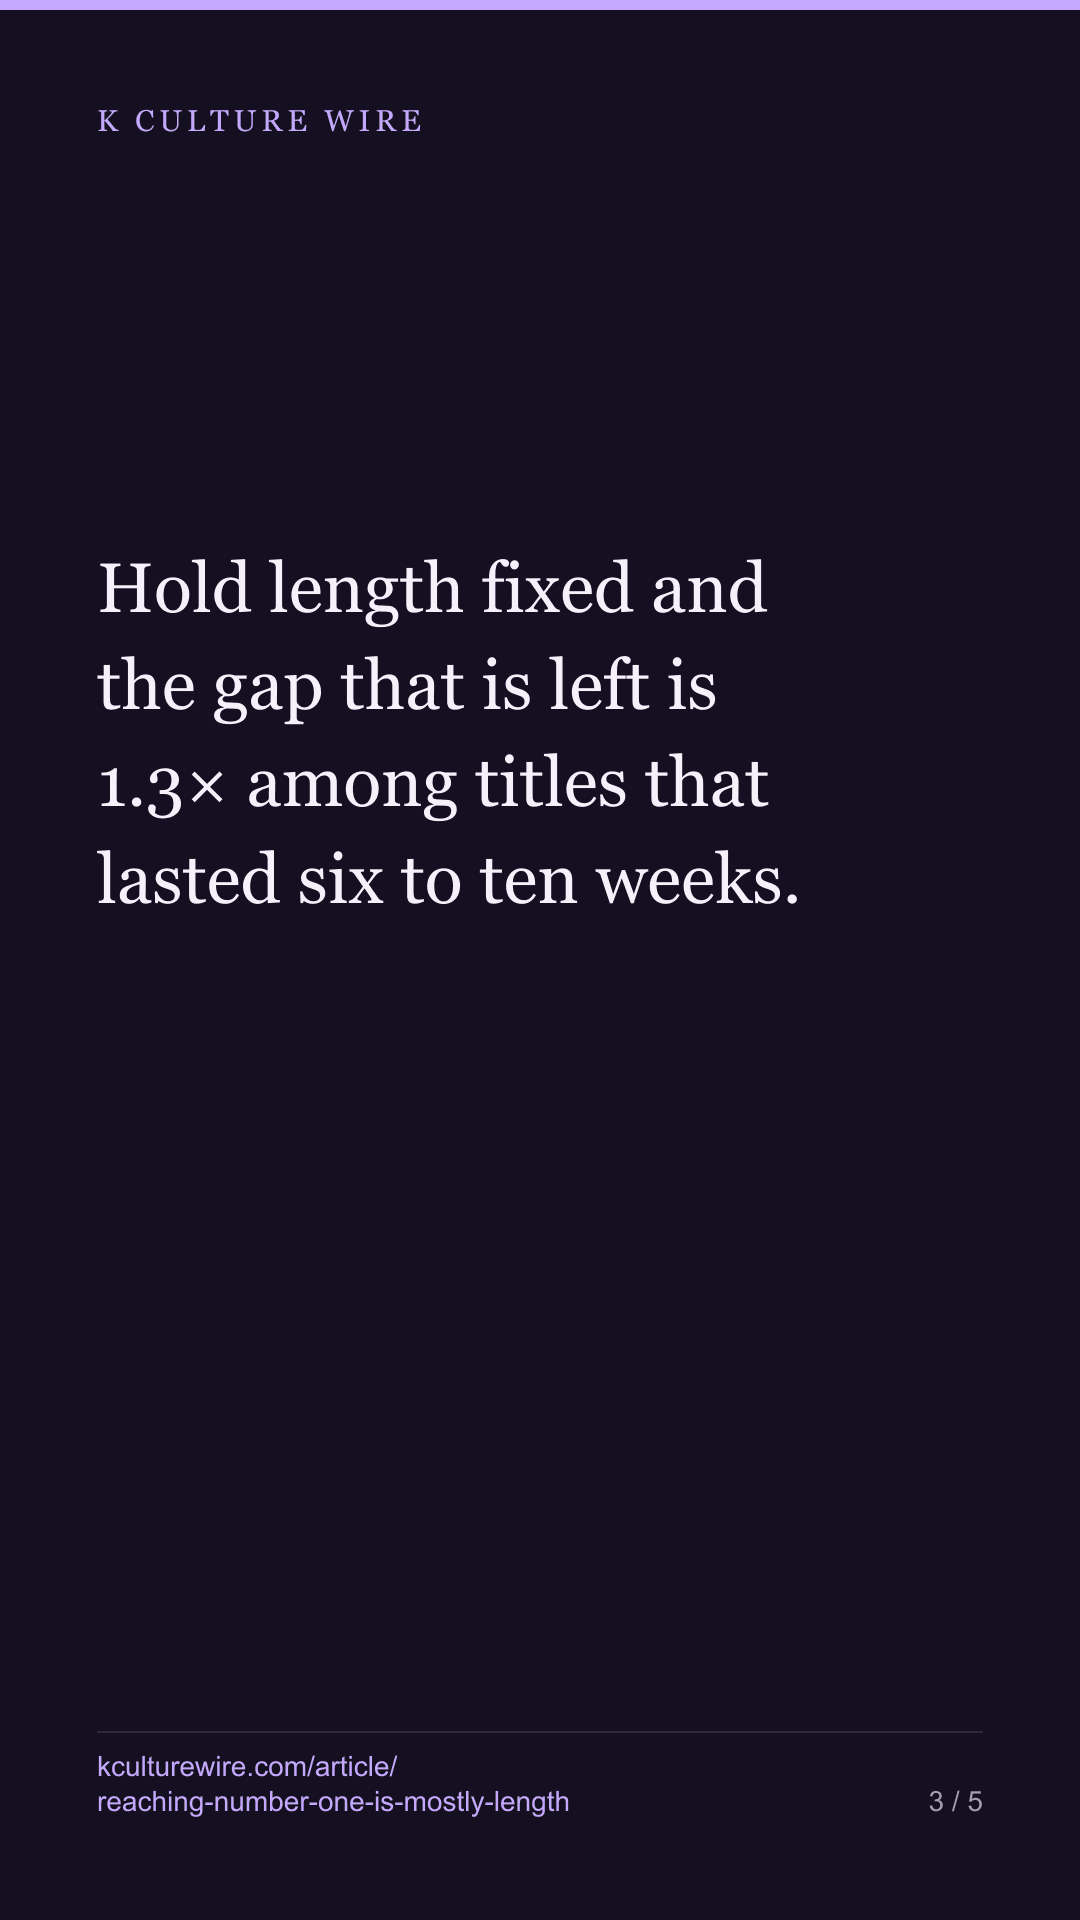
Measured on all 246 Korean titles instead of the fifty largest, the number-one group runs five weeks to everyone else's two. Hold length fixed and the gap that is left is 1.3× among titles that lasted six to ten weeks.
The table this is written from: /staying-power
On 7 August we put a heading on our staying-power page: “Reaching number one doubles the hours. It adds no weeks.”
The second sentence was wrong, the first was the right shape and the wrong size, and the reason is the same for both. We computed the comparison on the fifty largest titles by hours — a group selected on the very thing we were trying to explain.
What the selection did
Inside the top fifty, every title has already had a long run. The number-one group averaged 9.8 weeks and everyone else 9.0, so run length looked irrelevant. It is not irrelevant; it is what got those titles into the top fifty in the first place.
Here is the same comparison over the whole panel.
| Peaked at | Titles | Median hours | Median weeks | Mean hours |
|---|---|---|---|---|
| #1 | 65 | 103.4m | 5 | 233.8m |
| Below #1 | 178 | 24.5m | 2 | 51.3m |
The gap in hours is larger than we said — 4.2× on medians, against the 2.5× we reported on means of the top fifty. And the claim that it adds no weeks is simply false: the median number-one title runs five weeks against two.
We also report medians now. One title holds 5.05bn of the panel’s 23.72bn hours, so a mean of any group containing Squid Game is substantially a description of Squid Game.
Then most of the gap turns out to be length
If number-one titles run longer, part of that 4.2× is just more weeks in which to accumulate hours. So hold the length roughly fixed and look again.
| Titles that lasted | Reached #1 | Median hours | Did not | Median hours | Ratio |
|---|---|---|---|---|---|
| 1–2 weeks | 1 | 125.9m | 90 | 6.4m | 19.67× |
| 3–5 weeks | 42 | 79.4m | 57 | 46.0m | 1.73× |
| 6–10 weeks | 15 | 162.8m | 25 | 128.9m | 1.26× |
| 11 weeks or more | 7 | 653.9m | 6 | 331.1m | 1.97× |
Among titles that lasted six to ten weeks, reaching number one goes with 1.26× the median hours — not 4.2×, and not 2.5×. The 1–2 week row has one title on the left of it and we do not read it.
Most of what we had attributed to the peak was length.
The ranks do not run in order either
If the top spot were a ladder, median hours would fall as the peak rank rises. They do not.
| Peaked at | Titles | Median hours | Median weeks |
|---|---|---|---|
| #1 | 67 | 103.4m | 5 |
| #2 | 27 | 123.4m | 5 |
| #3 | 30 | 67.8m | 5 |
| #4 | 24 | 46.8m | 3 |
A title that peaked at number two has a higher median than one that peaked at number one. That is not a paradox and it is not a ranking: reaching number one in a quiet week is easier than reaching number two in a crowded one, and the chart position records the week it happened in, not the size of the audience.
Neither column is the cause of the other
Against log hours, weeks on chart correlates at 0.73 and peak rank at −0.754. They are the same strength. And they correlate with each other at −0.473, so a table showing one is partly showing the other. There is no version of this data in which we can hand you a single number and call it the driver, and we are not going to invent one.
What the panel does say plainly is that 21.8% of Korean titles that reached a global Non-English Top 10 were there for exactly one week — 53 of 243. The most common outcome for a title that charts at all is to chart once.
What we changed
The page now computes the peak groups on all 232 titles rather than fifty, reports medians beside means, and carries the banded table above. The old top-fifty figures stay in the data file under a different key so the mistake can be traced rather than quietly overwritten, which is the same rule we applied when one flaw in title matching moved figures on seven pages.
The general lesson is cheap to state and easy to repeat: if you cut a panel by the outcome and then explain the outcome, the cut will answer for you. We had the whole panel in the same file the whole time.
What changed on 3 September 2026
The panel moved from 246 titles to 243. On 25 August we removed three titles that were never Korean — Dangerous Liaisons, Breathless and One More Time — after confirming each against Wikidata, and every figure here was recounted on the smaller panel.
What moved: the hours gap between number-one titles and the rest went from 4.4× to 4.2× on medians, the 3–5 week band from 1.62× to 1.73×, and the share of titles that lasted exactly one week from 21.5% to 21.8%. The two correlations barely moved, from 0.731 to 0.73 and from −0.753 to −0.754.
We also filled in a cell we had left as an em dash. The 1–2 week band now shows its ratio, 19.67×, rather than a blank. It should still not be read as a finding — the left-hand side of that row is one title, and one title cannot carry a ratio. We are printing it because leaving a computed number out of a table is its own kind of hiding, and saying why not to trust it is better than saying nothing.
The finding did not change. Reaching number one is mostly length: band the titles by how long they ran and most of the hours gap goes away.
Where these numbers come from
Sources
- Netflix — Top 10 weekly global lists (Tudum), Non-English film and TV, 2021-07-04 to 2026-07-26, with hours viewed per title per week · https://www.netflix.com/tudum/top10
- Wikidata — Country of origin (P495 = Q884) for every charting title, used to decide which titles are Korean · https://query.wikidata.org
What we checked
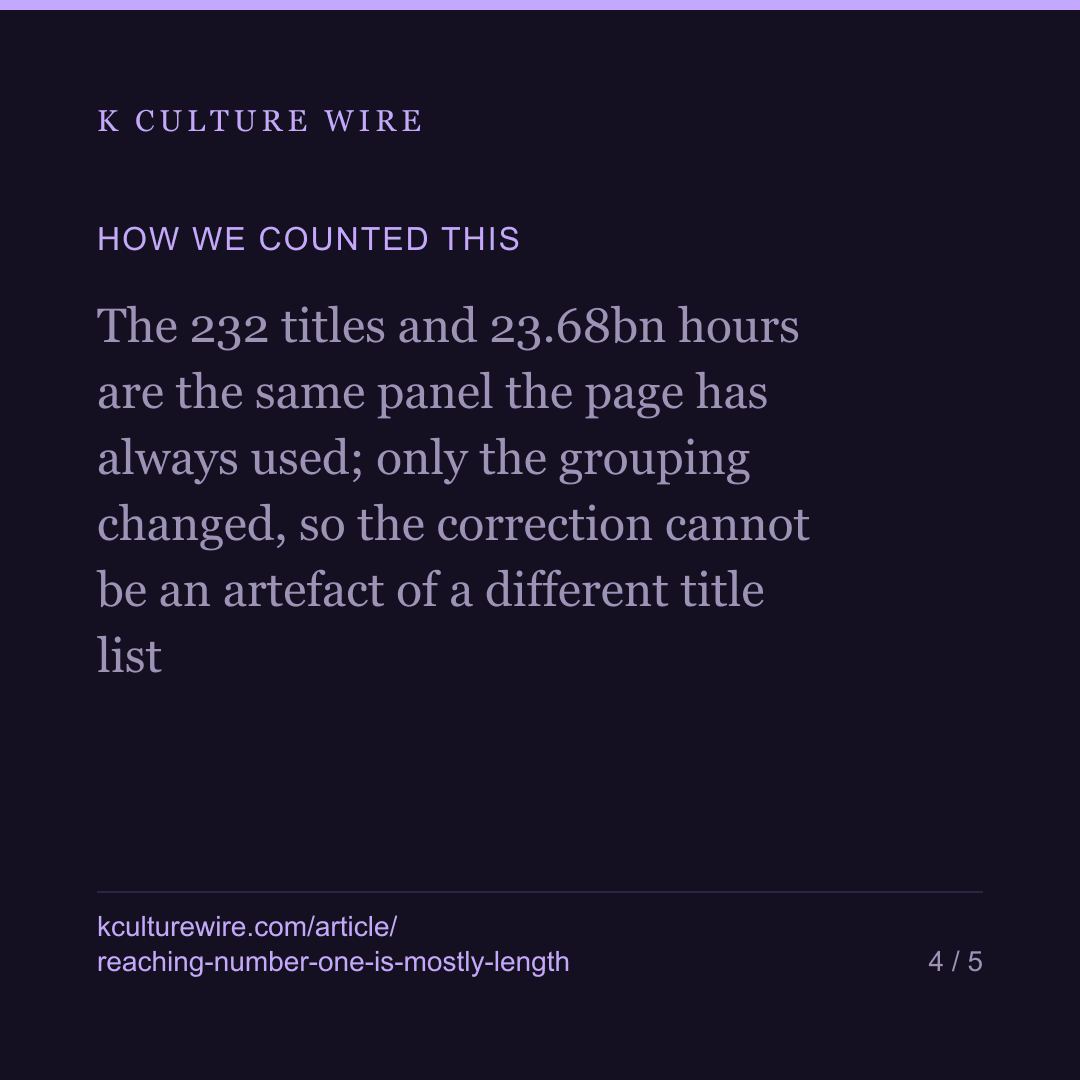
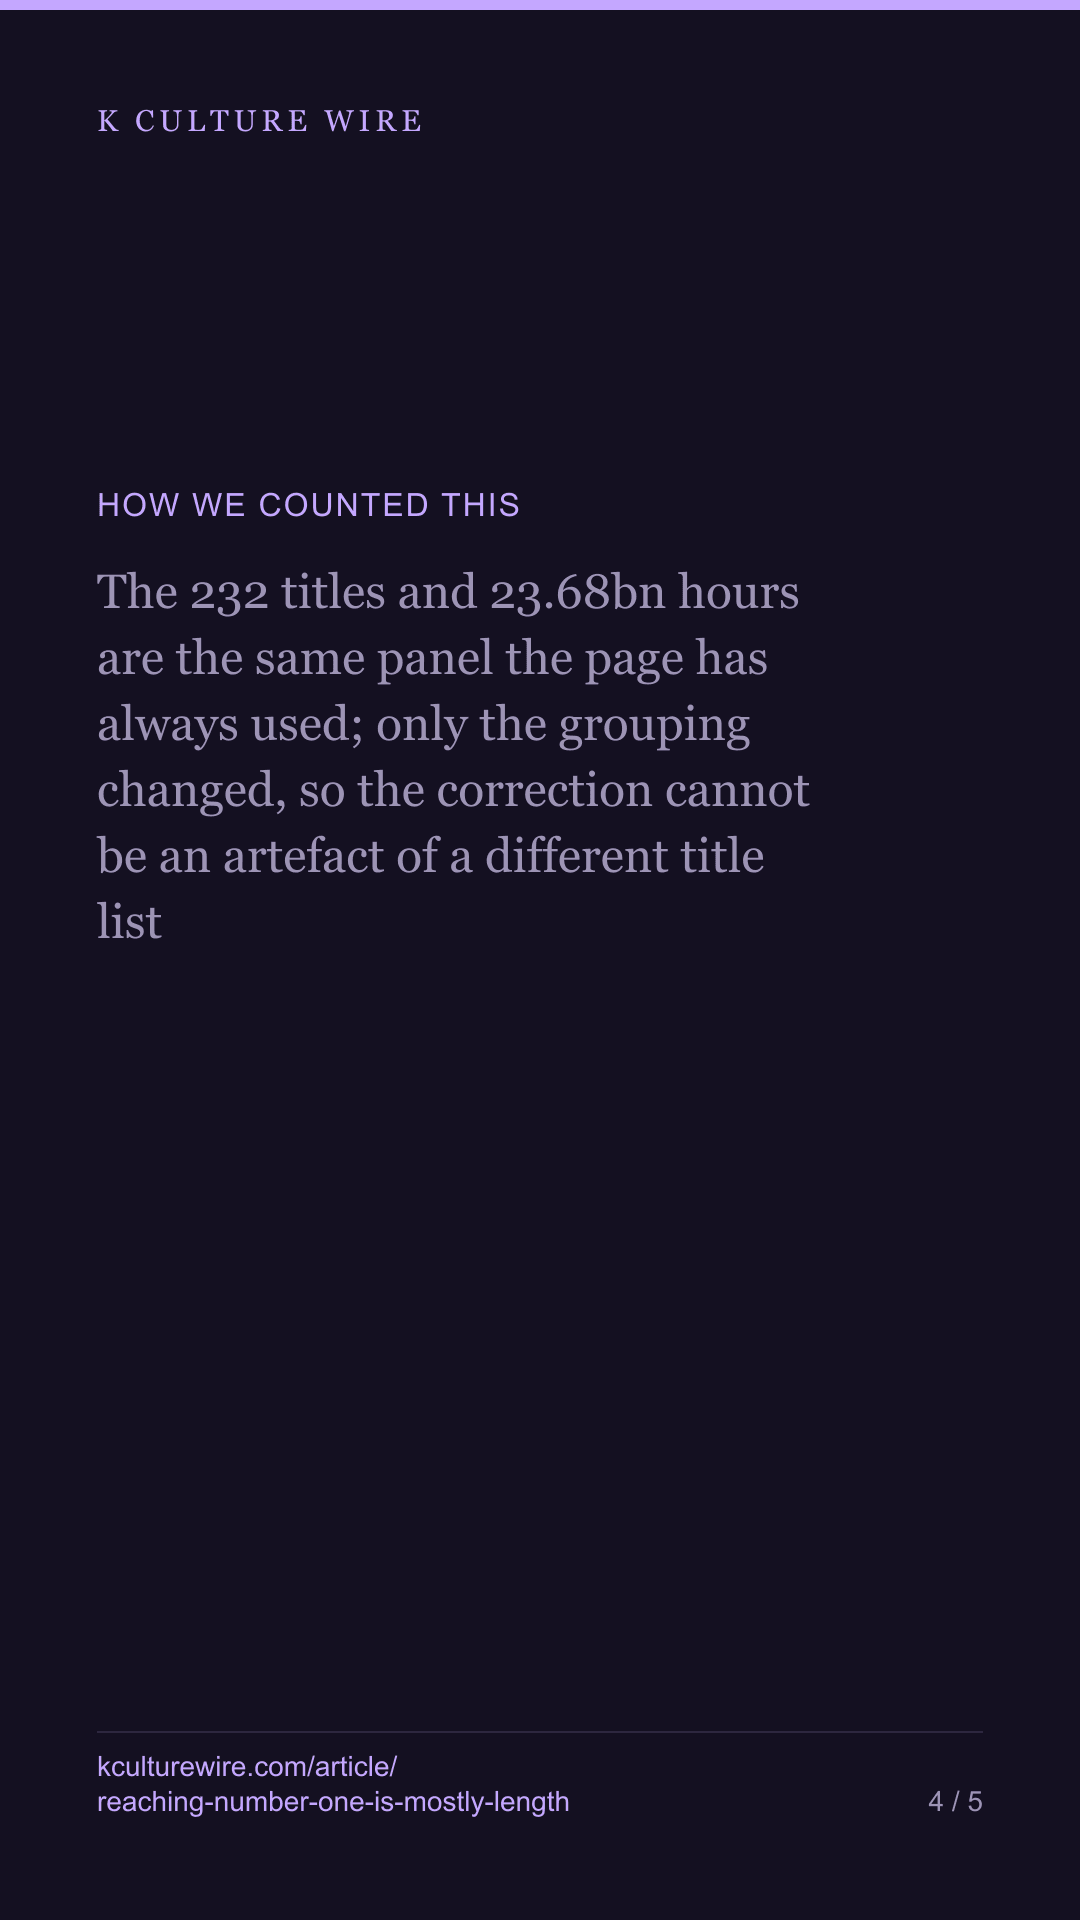
- The 232 titles and 23.68bn hours are the same panel the page has always used; only the grouping changed, so the correction cannot be an artefact of a different title list
- Medians are reported beside means because one title holds 5.05bn of the 23.72bn, and a mean of any group containing it describes that title
- Correlations are taken against log hours, since hours span three orders of magnitude and the raw scale would let the largest few titles set the coefficient
- The banded comparison uses the same peak definition as the headline one, so the shrinking gap is not a change of measure
What we left out, and why
- Any claim about causation. Nothing here says reaching number one produces hours or that hours produce a number one; both are measured after the fact from the same weekly rows
- The 1–2 week band as evidence. Exactly one title in it reached number one, so the 19.7× there rests on a single row and we do not read it
- Country-level runs. Netflix publishes hours for the global lists only, so every figure here is global
- Any ordering of titles by how well they did. The ranks are groups here, not a league table
The data behind this
Written from the same data
Take this away — 10 cards
The figures in this article, as images. Free to repost with the address on them.
If you work in this business
Everything on this page is measured from the same weekly Netflix lists, per market and per title. We publish the pages free; what we sell is the same measurement cut to one company's catalogue — including the figures behind /staying-power and /watched.
What a company sheet contains, and what it cannot tell you →