Titles · music
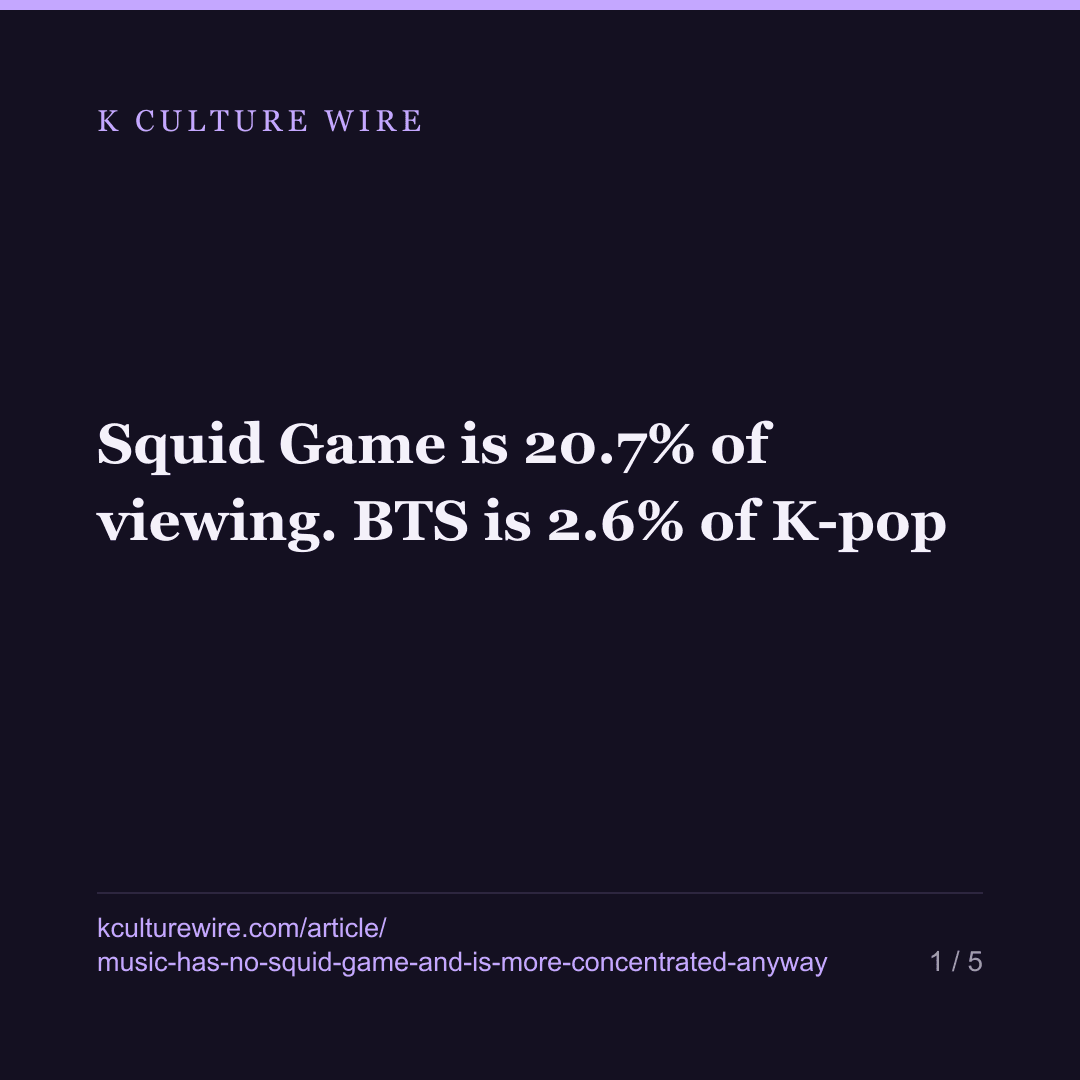
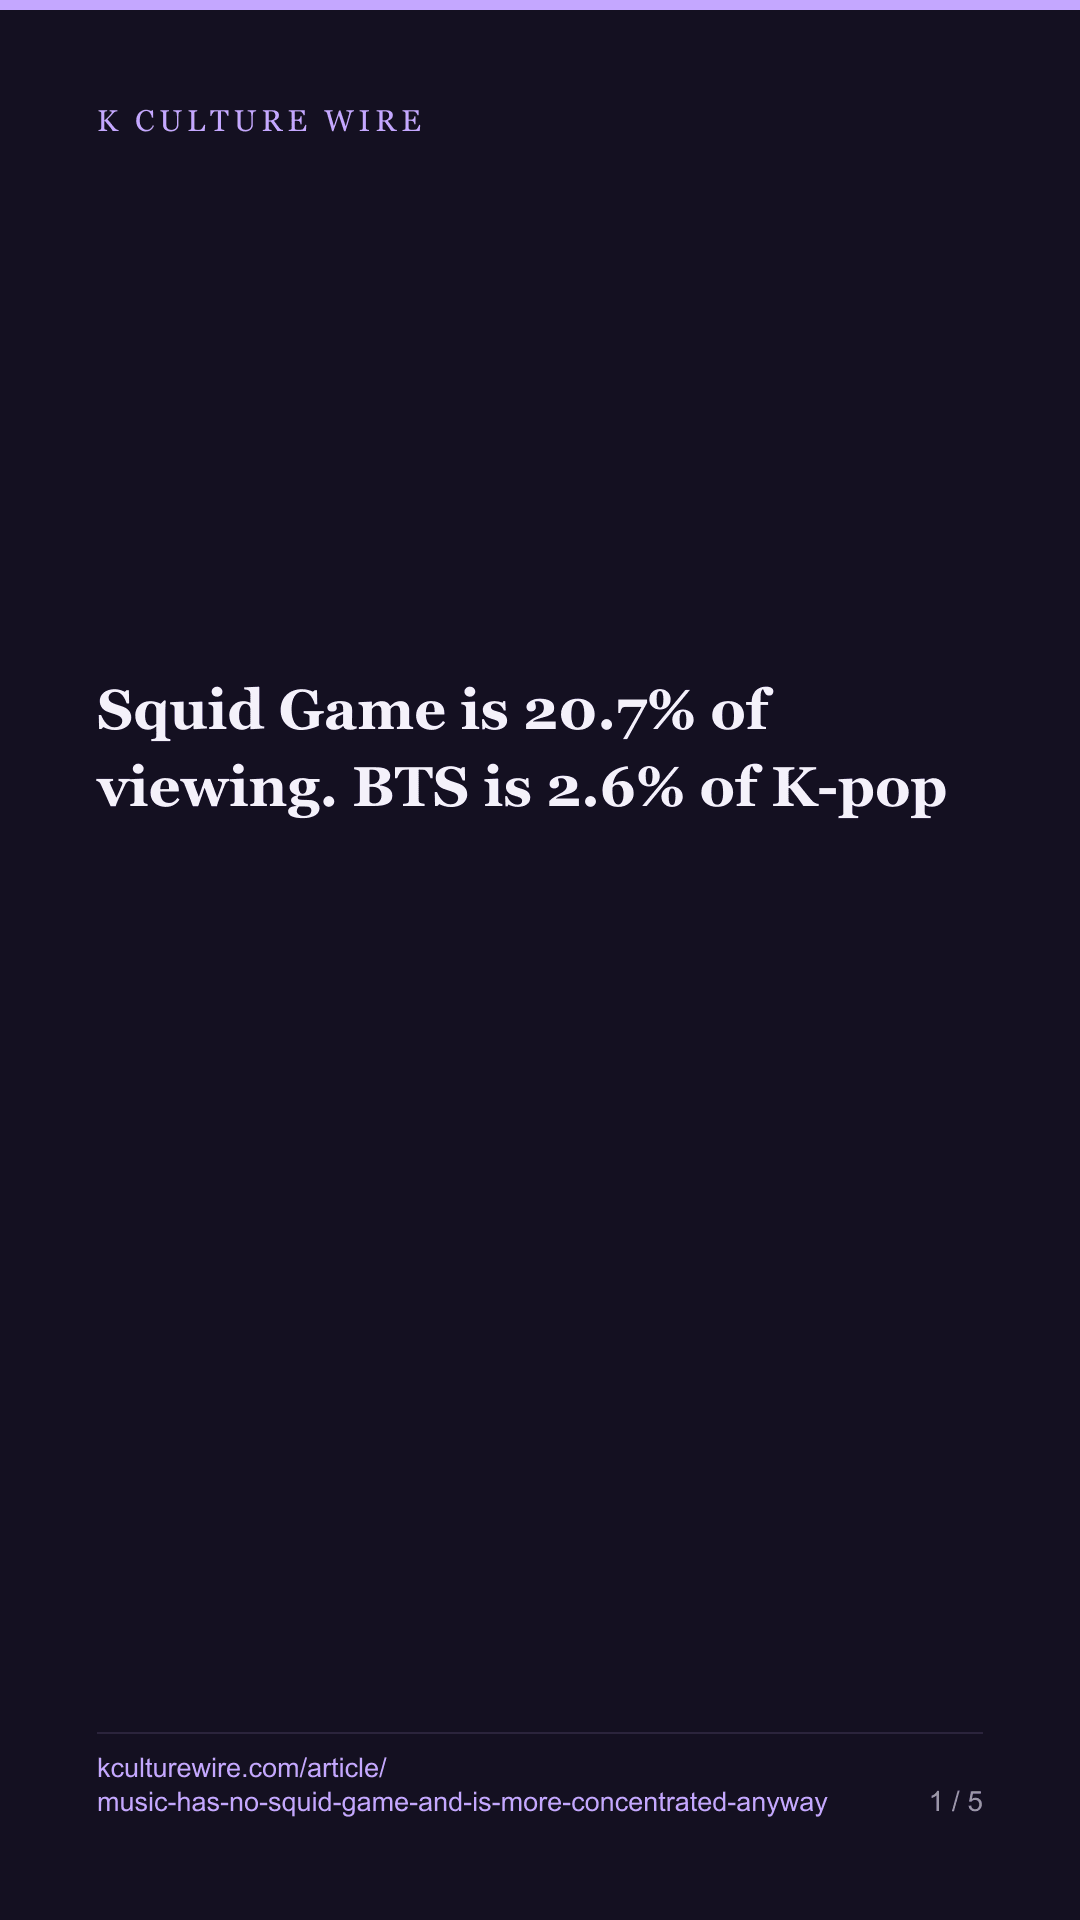
Squid Game is 20.7% of viewing. BTS is 2.6% of K-pop
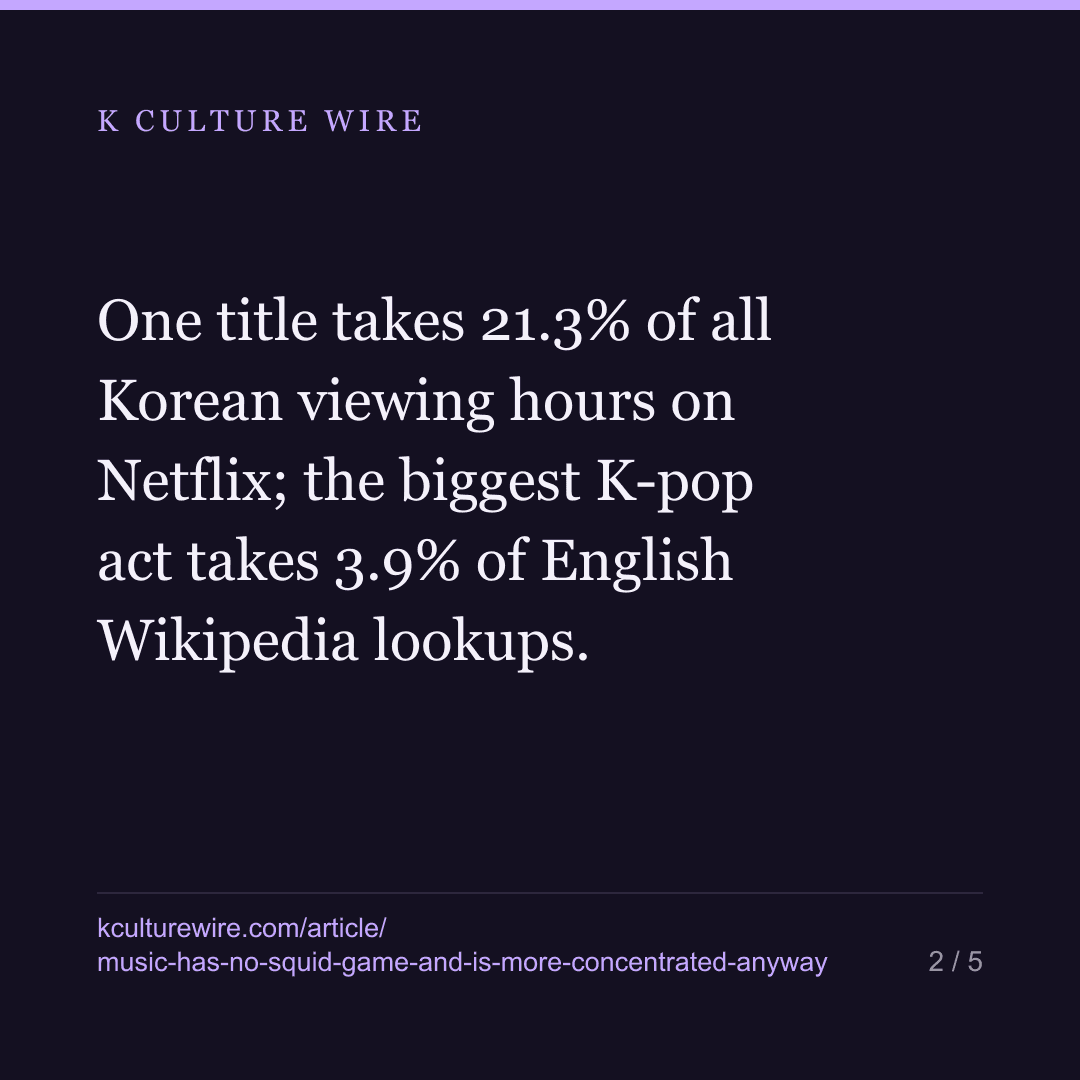
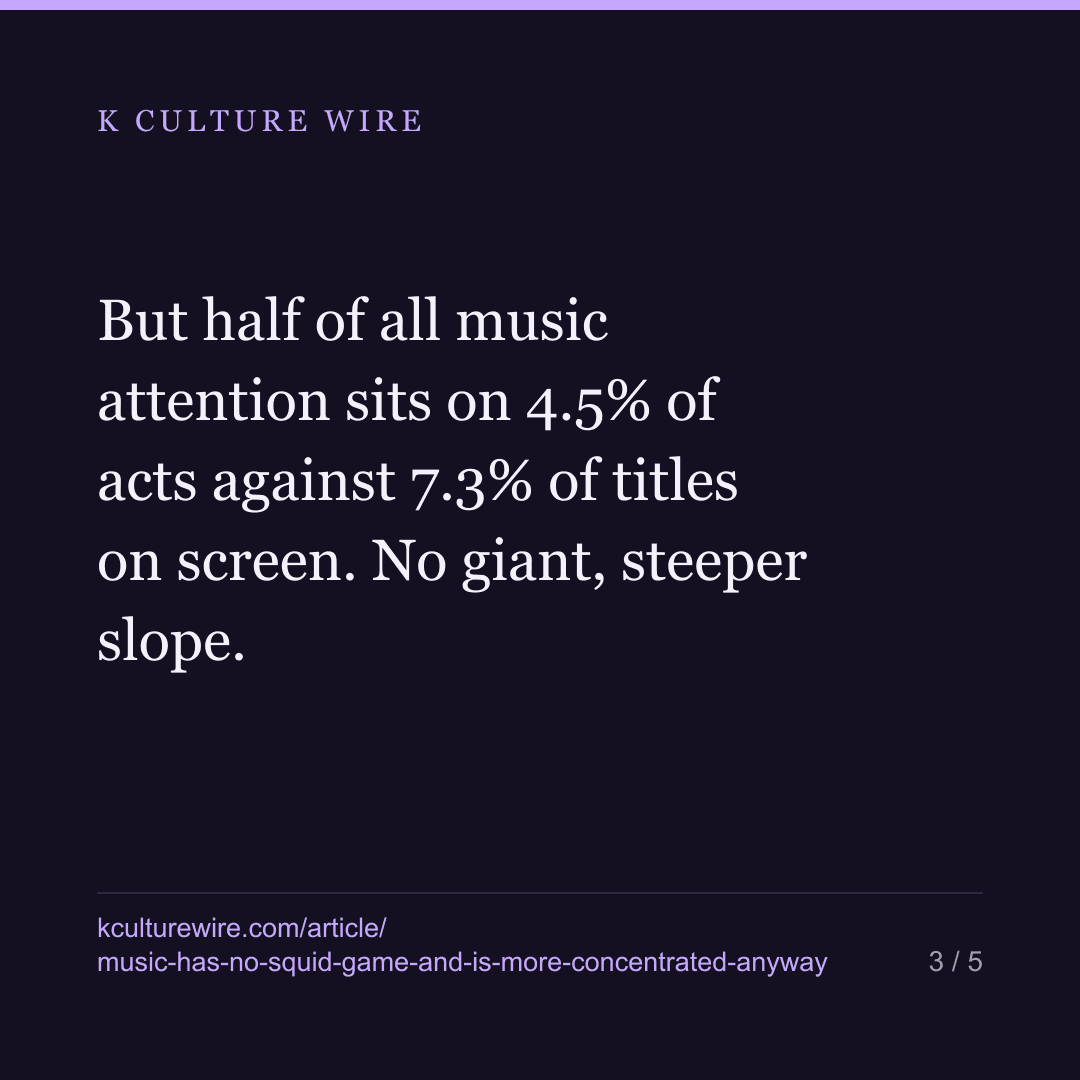
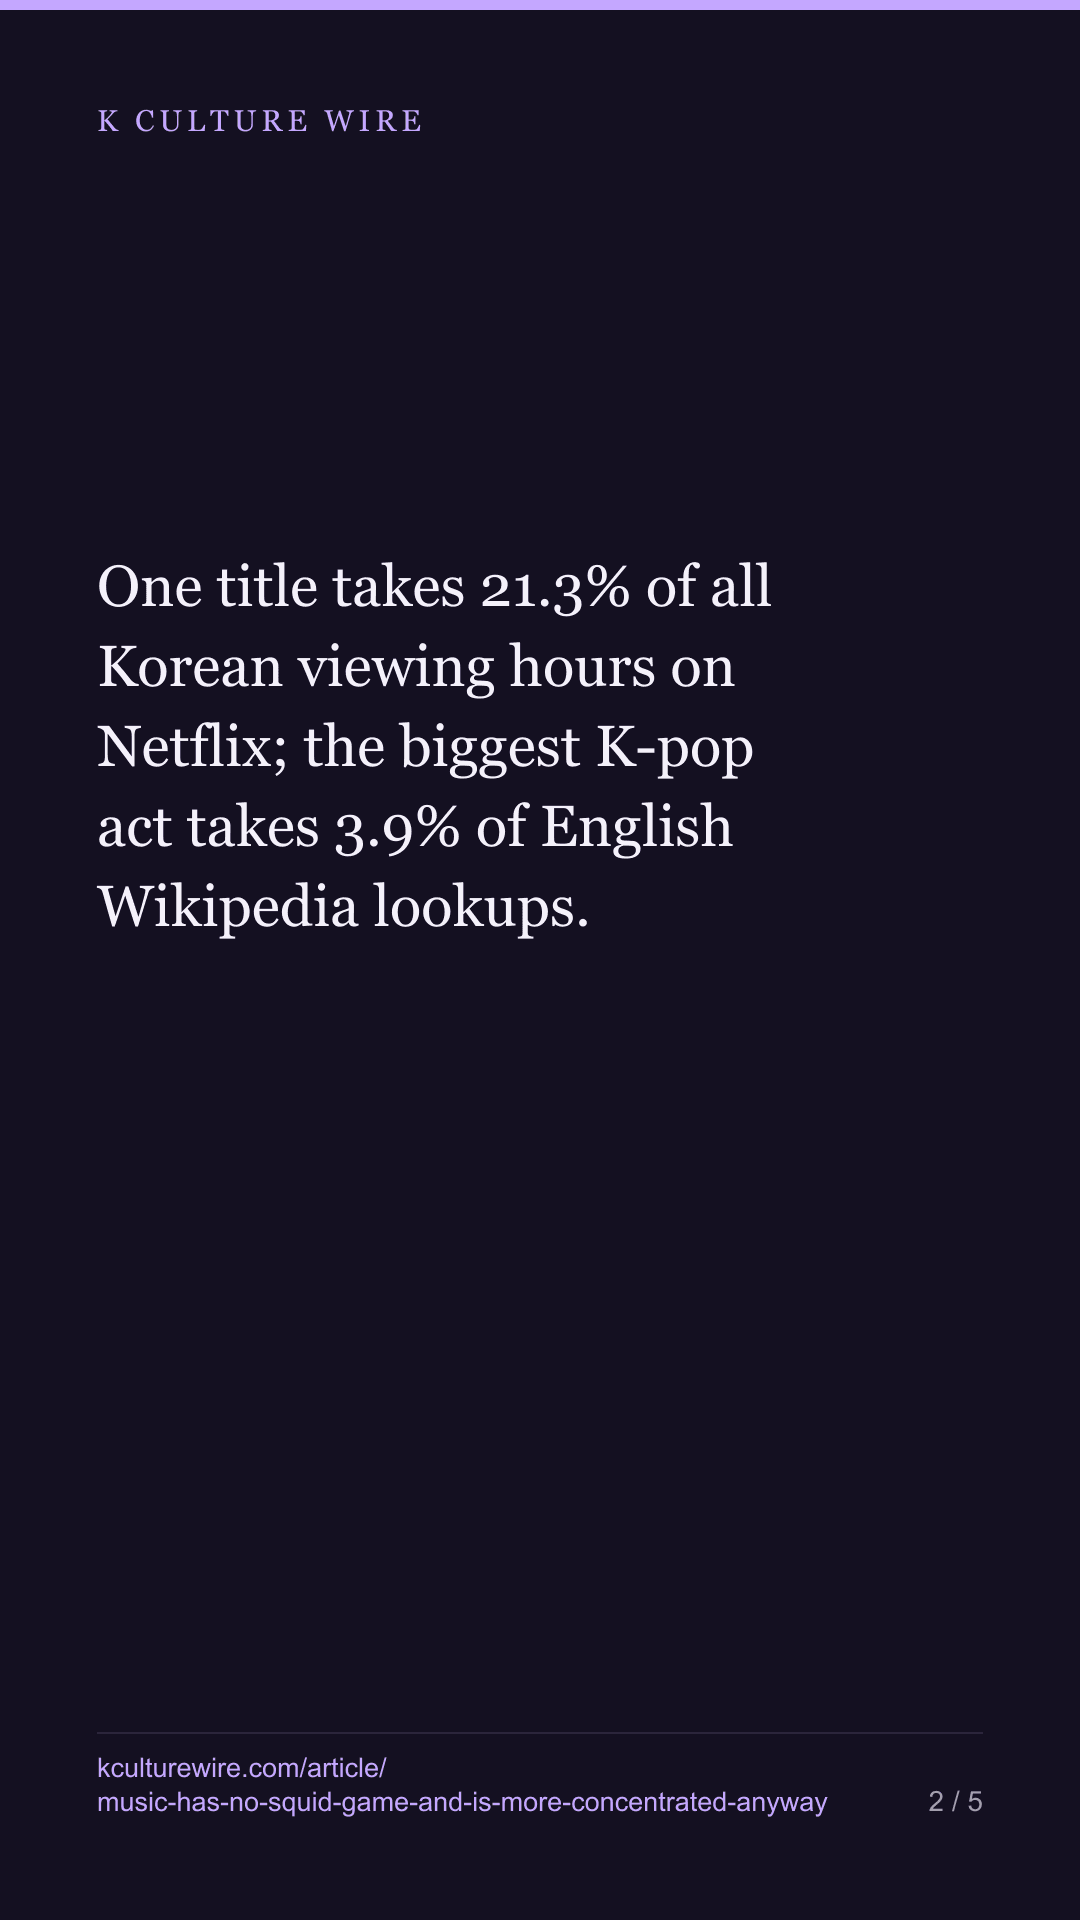
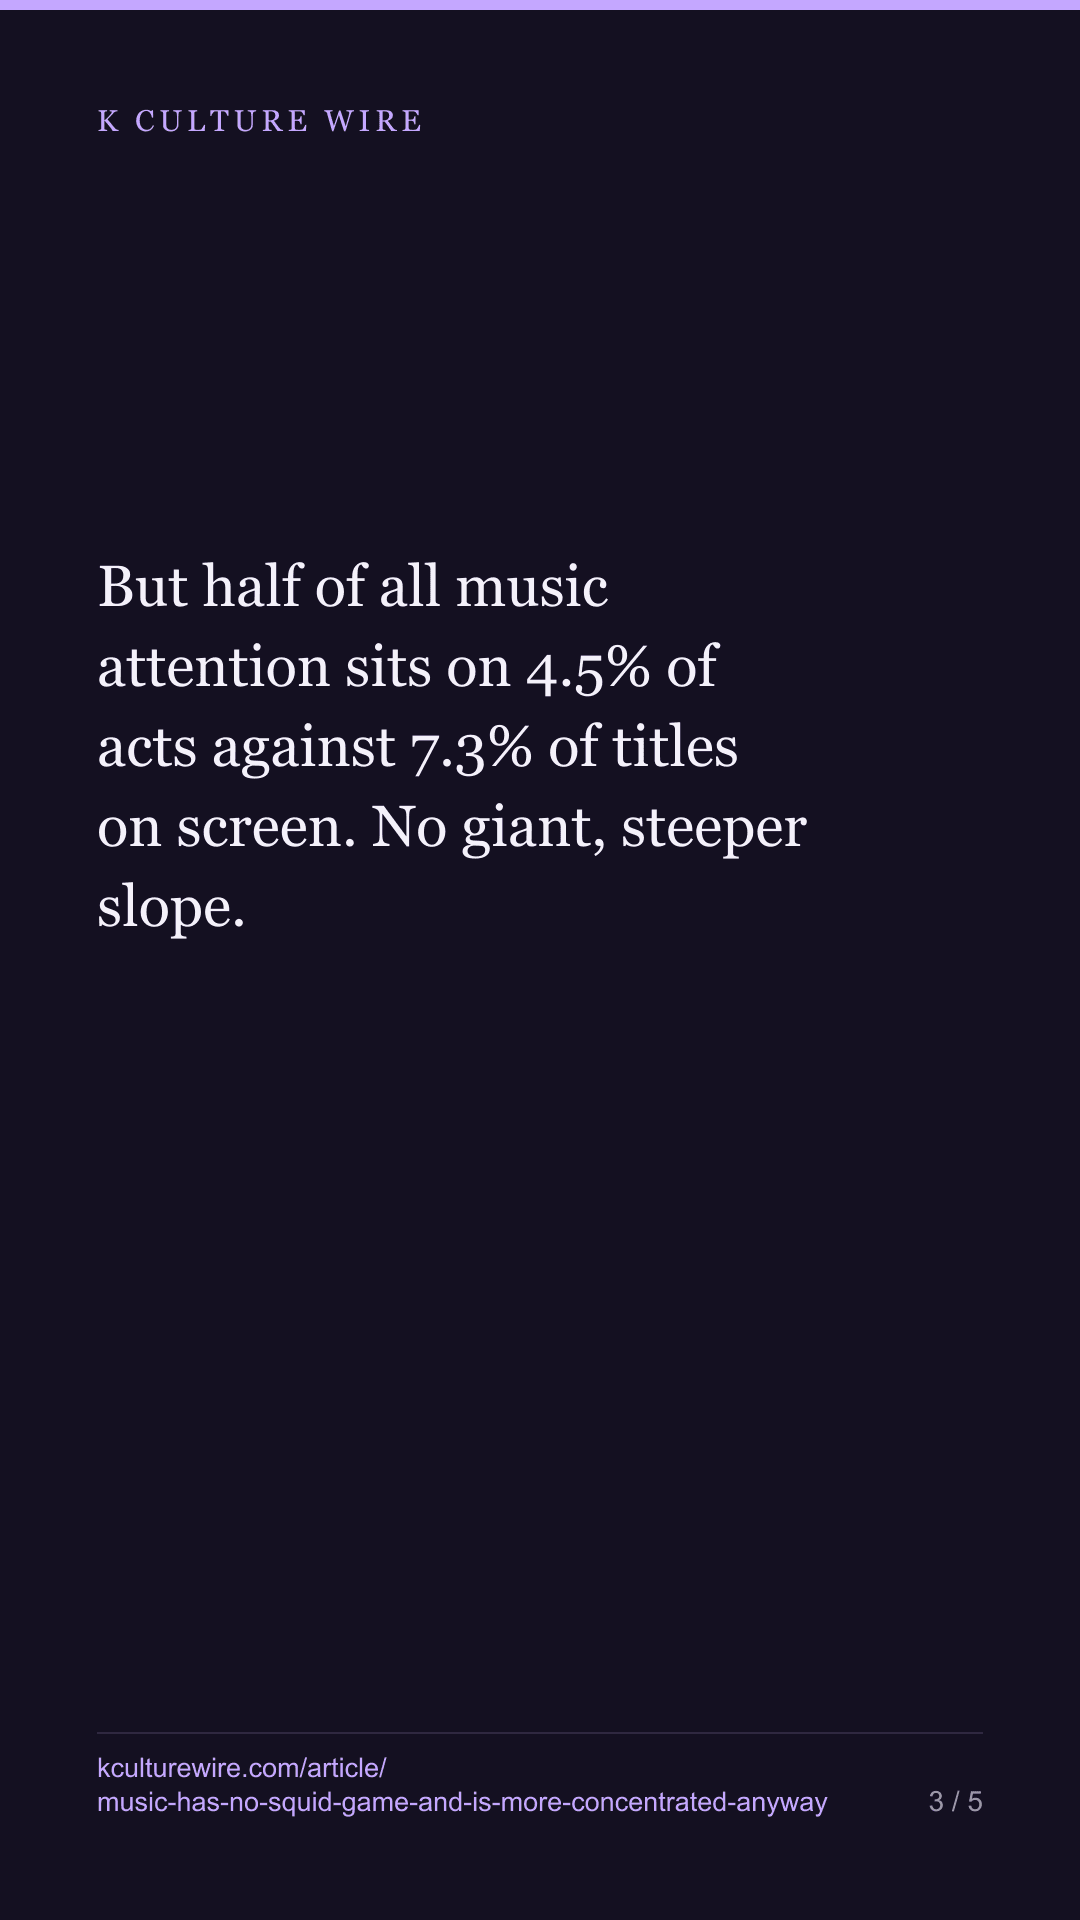
One title takes 21.3% of all Korean viewing hours on Netflix; the biggest K-pop act takes 3.9% of English Wikipedia lookups. But half of all music attention sits on 4.5% of acts against 7.3% of titles on screen. No giant, steeper slope.
The table this is written from: /kpop-attention
Squid Game is a fifth of everything Korea has put on Netflix’s global chart in five years. BTS is under three per cent of the attention its own field receives. Both figures come off the two instruments we have: 243 titles carrying five years of Netflix viewing hours, and 2,372 K-pop acts and members carrying thirty days of English Wikipedia lookups.
The obvious comparison says screen is the concentrated one:
| Biggest single unit | Share it holds | |
|---|---|---|
| Screen (viewing hours) | Squid Game | 20.7% |
| Music (page lookups) | BTS | 2.6% |
One drama is a fifth of everything Korea has put on Netflix’s global chart in five years. The biggest act in K-pop is under three per cent of the attention its own field receives.
That comparison is unfair, and correcting it reverses the answer.
The panels are ten times different in size
243 against 2,372. A top-50 share means something completely different in each. So ask the question that does not depend on panel size: how much of the field do you need before you have half the total?
| Half the total comes from | As a share of the panel | Top 10% of the panel holds | |
|---|---|---|---|
| Screen | 18 titles | 7.4% | 55.8% |
| Music | 118 acts | 5.0% | 66.1% |
Music is the steeper distribution. Its top tenth holds nearly ten points more of its field’s attention than screen’s top tenth holds of viewing. Half of all K-pop lookups sit on 118 of 2,372 acts.
So both statements are true and they are about different things. Screen has one giant; music has a steeper slope. Remove Squid Game and screen’s top tenth falls to 45.2% — flatter still against music’s 66.1%. Nothing in music is remotely as large as Squid Game relative to its field — and the field beneath it is still more unequal.
Why one giant and no giant
A drama is a single object that everyone watches at the same time. A chart position is winner-take-most by construction: there are ten slots a week, globally, and one show can hold the top one for months.
An act is a person or a group with a permanent presence. Attention to them accumulates in small amounts continuously — the median act in this panel drew 875 lookups in thirty days, which is about 29 a day, and not one of the 2,372 drew zero. There is no mechanism by which one act absorbs a fifth of that, because nobody stops looking up everyone else.
The shapes come from the measurement, not only from the culture, and we would rather say that than present the contrast as a fact about K-pop.
What this does and does not license
It does license a size-fair comparison of inequality, because the concentration shares are ratios inside each panel. A five-year window and a thirty-day window can both be asked what fraction of their own total sits in their own top tenth.
It does not license adding the two numbers together, or treating a lookup as a viewing hour. One is curiosity and the other is consumption. A person who looks up an act may never listen to them; a viewing hour is an hour.
And the music panel is only acts with an English Wikipedia article. An act without one produces no row at all, so it is invisible here — and we cannot say how many are missing, because counting them would require the list we do not have. If those acts are systematically small, the true music distribution is steeper still than 67.0%.
Screen has the giant. Whether a title is even Korean is the harder question underneath it. Read what we cannot verify about the catalogue →
What changed on 3 September 2026
The screen panel moved from 246 titles to 243. On 25 August we removed three titles that were never Korean — Dangerous Liaisons (French), Breathless (Spanish) and One More Time (Swedish) — after confirming each against Wikidata. They had entered our figures through the same title-text matching this site has corrected before.
Every share above was recounted on the smaller panel. Squid Game went from 20.6% of screen attention to 20.7%; the eighteen titles that reach half the attention are 7.4% of the panel rather than 7.3%; the ten largest hold 55.8% rather than 56.3%; and with Squid Game removed the top tenth falls to 45.2% rather than 45.9%.
The finding did not change, in direction or in size. Music is still the more concentrated of the two fields, and still more concentrated after Squid Game is taken off the screen side.
Where these numbers come from
Sources
- Netflix — Top 10 global weekly hours viewed (Tudum), 2021-07-04 to 2026-07-26, Korean titles on the Non-English charts · https://www.netflix.com/tudum/top10
- Wikimedia — Pageviews API, en.wikipedia, all-access, user agents only, 2026-07-08 to 2026-08-06, for every K-pop act and member with an English article · https://wikimedia.org/api/rest_v1/
What we checked
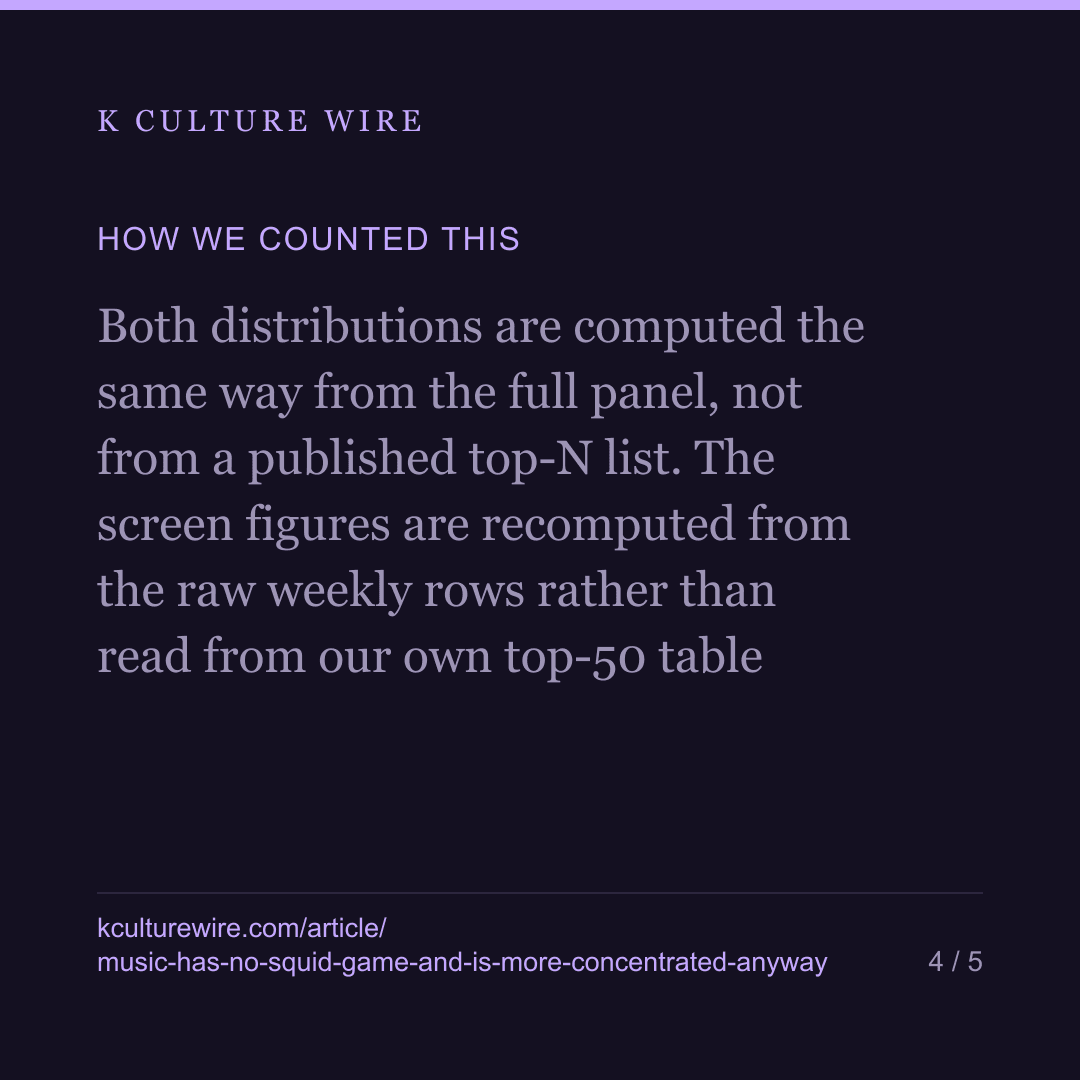
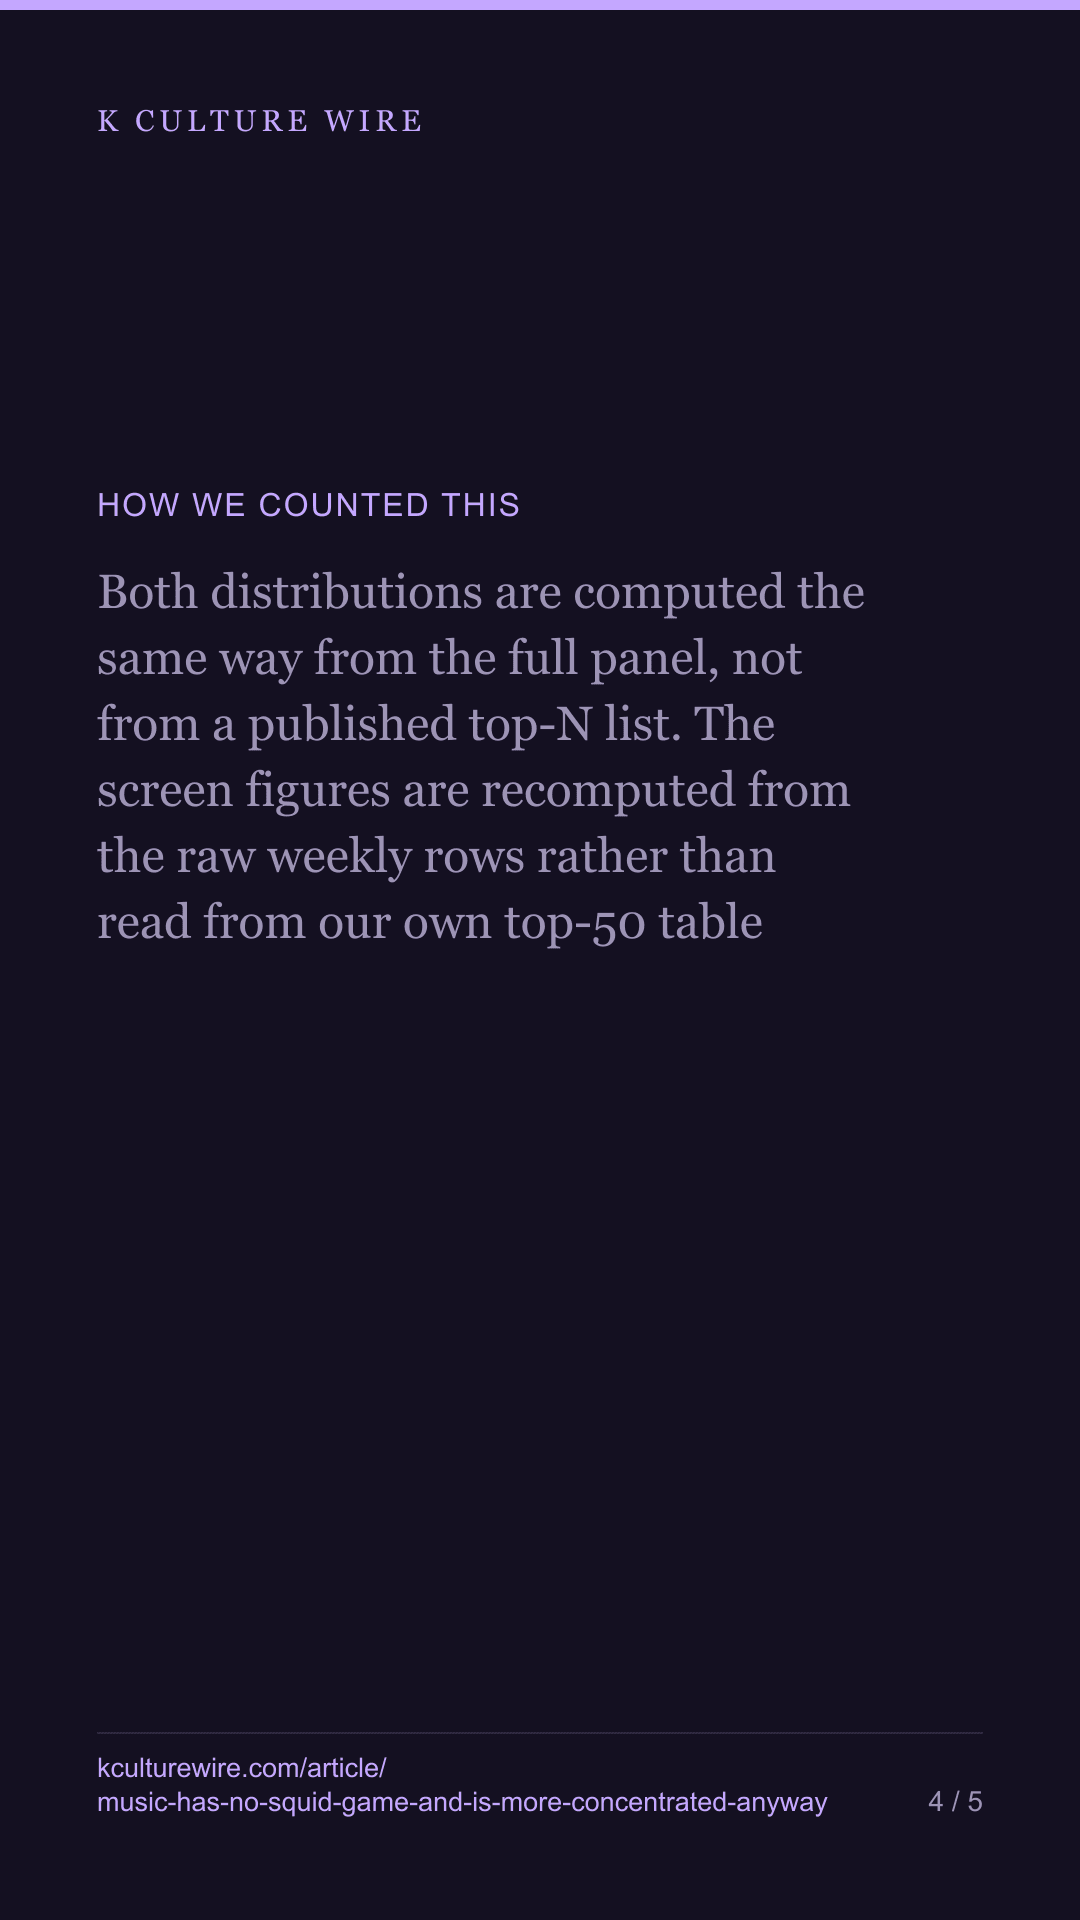
- Both distributions are computed the same way from the full panel, not from a published top-N list. The screen figures are recomputed from the raw weekly rows rather than read from our own top-50 table
- The two panels cover different spans by necessity: five years of viewing hours against thirty days of pageviews. Concentration shares are ratios within each panel, so the spans do not have to match for the comparison to hold
- No act in the music panel has zero views, so the flat end of that distribution is real and not an artefact of missing data
What we left out, and why
- Any claim that pageviews and viewing hours are the same quantity. One is curiosity, the other is consumption, and a ratio within each is all we compare
- Any K-pop act with no English Wikipedia article. They produce no row, so we cannot even count how many are missing
- Revenue, streams and sales. Nothing here is a money figure and none of these numbers should be read as one
The data behind this
Written from the same data
Take this away — 10 cards
The figures in this article, as images. Free to repost with the address on them.
If you work in this business
Everything on this page is measured from the same weekly Netflix lists, per market and per title. We publish the pages free; what we sell is the same measurement cut to one company's catalogue — including the figures behind /kpop-attention and /watched.
What a company sheet contains, and what it cannot tell you →