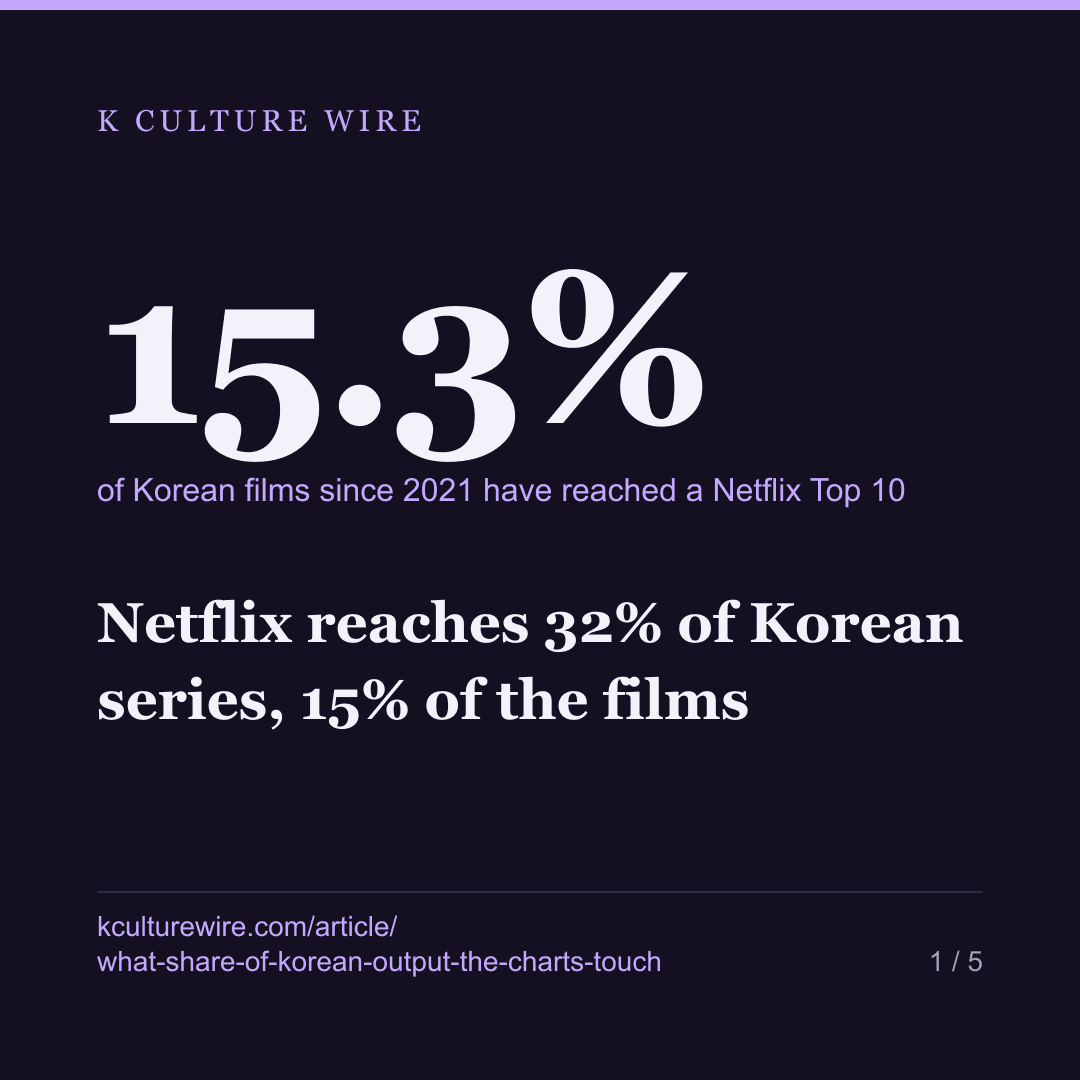
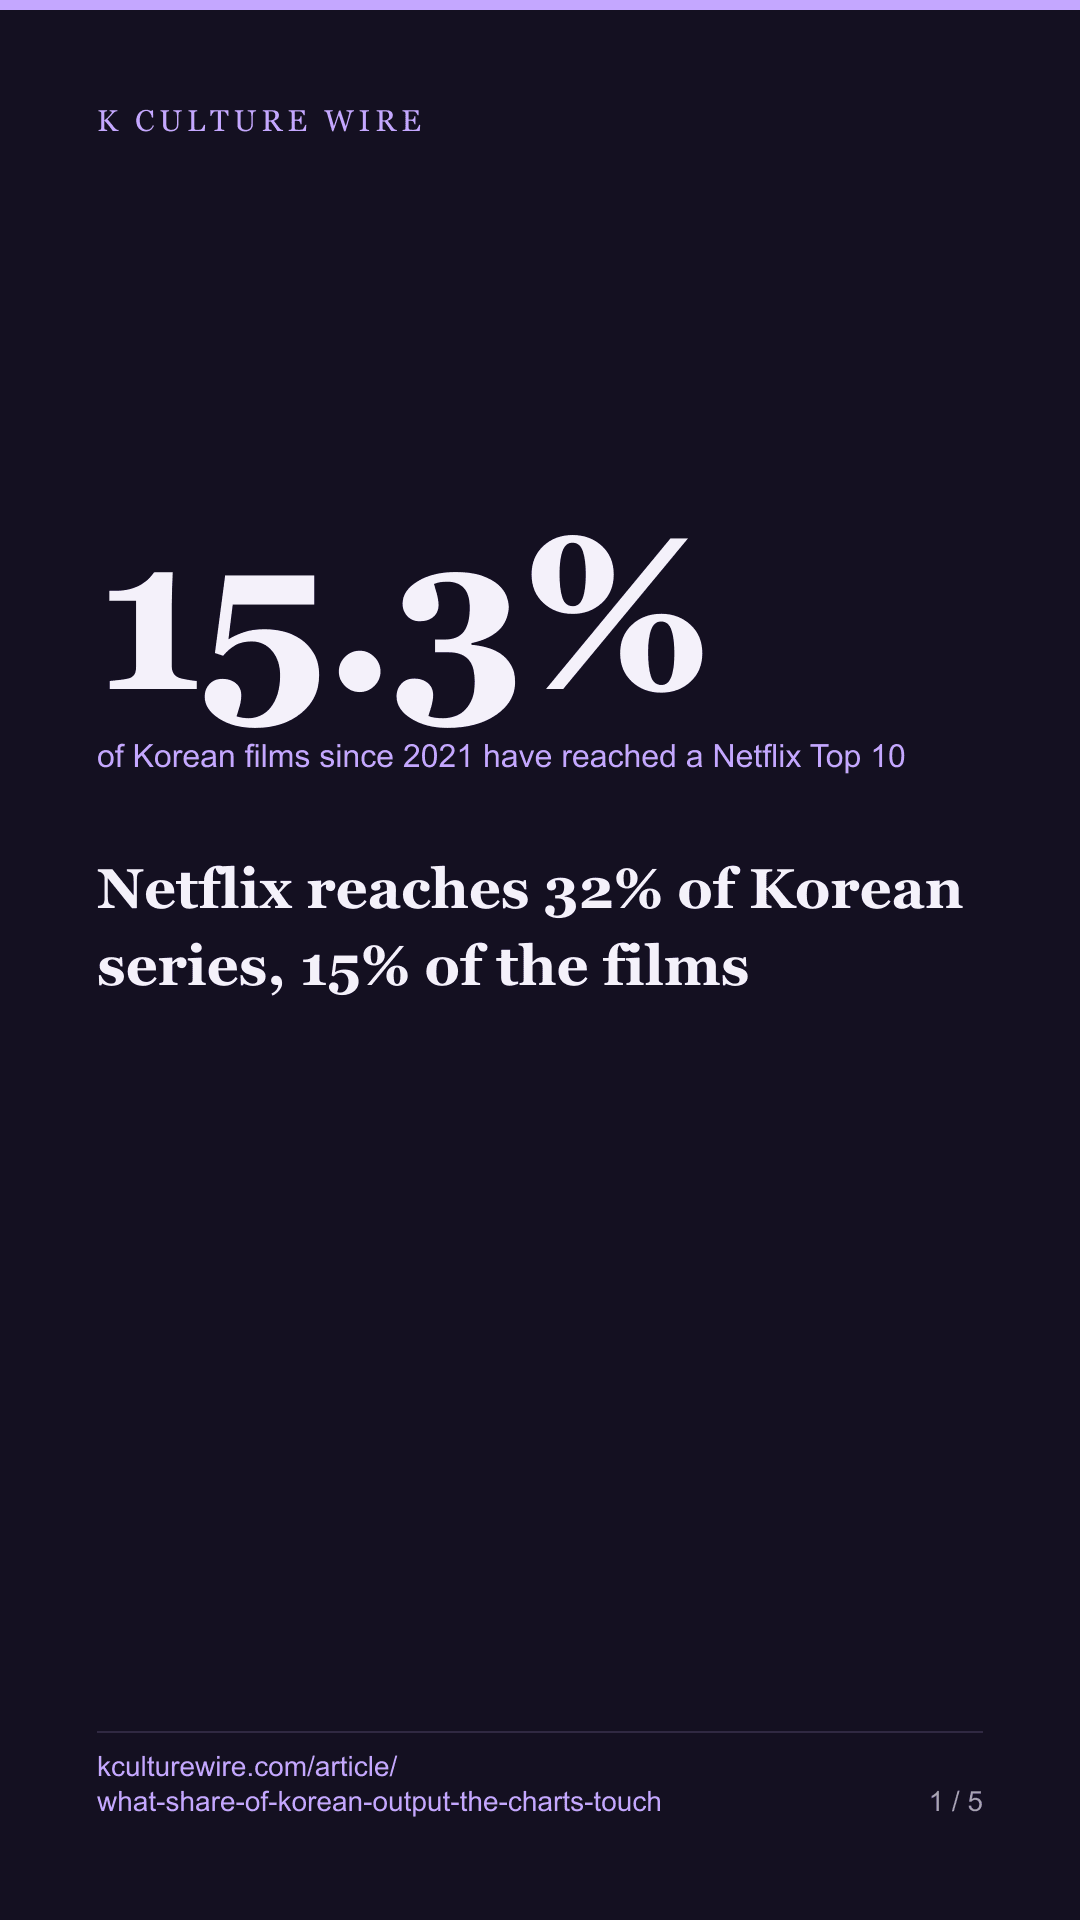
Netflix reaches 32% of Korean series, 15% of the films
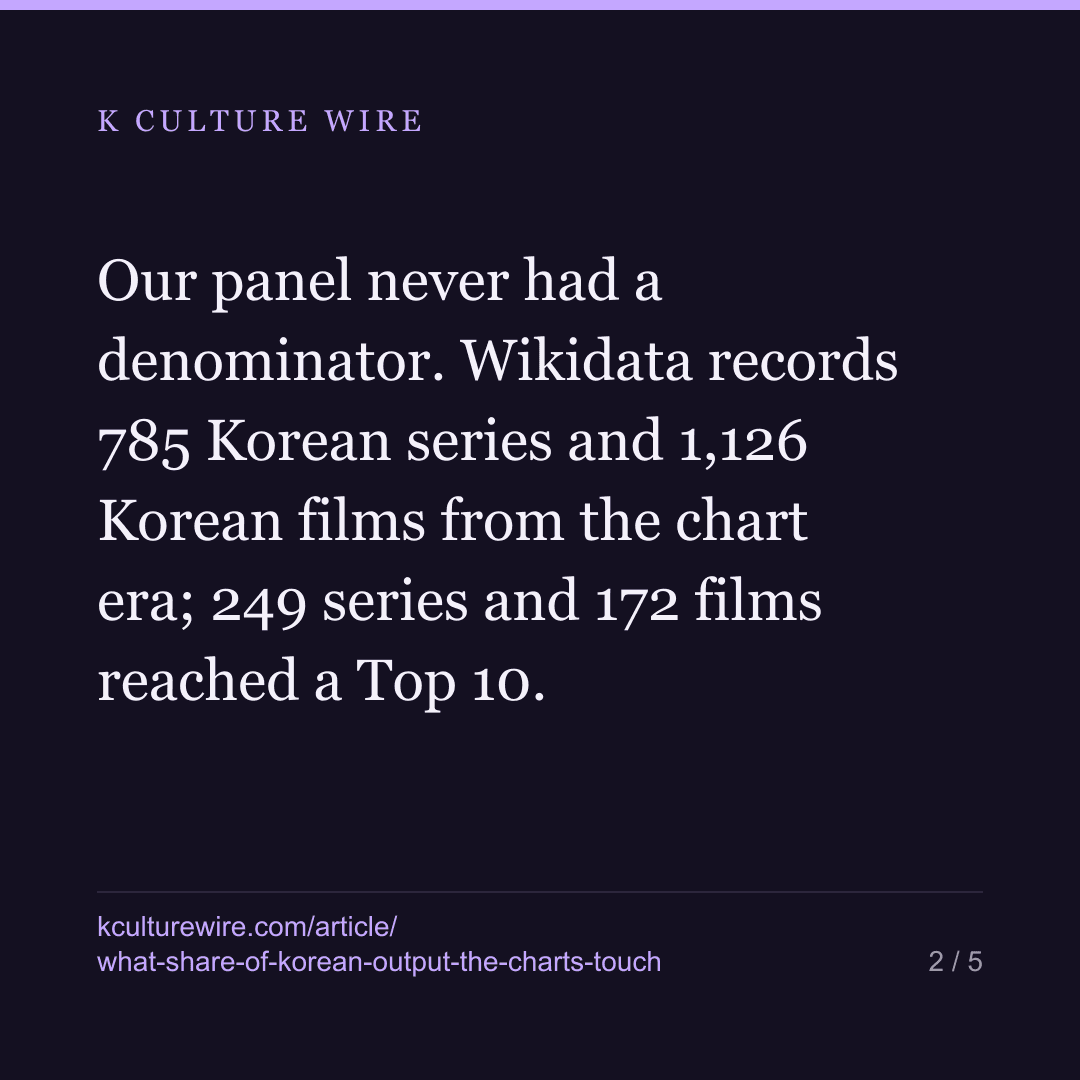
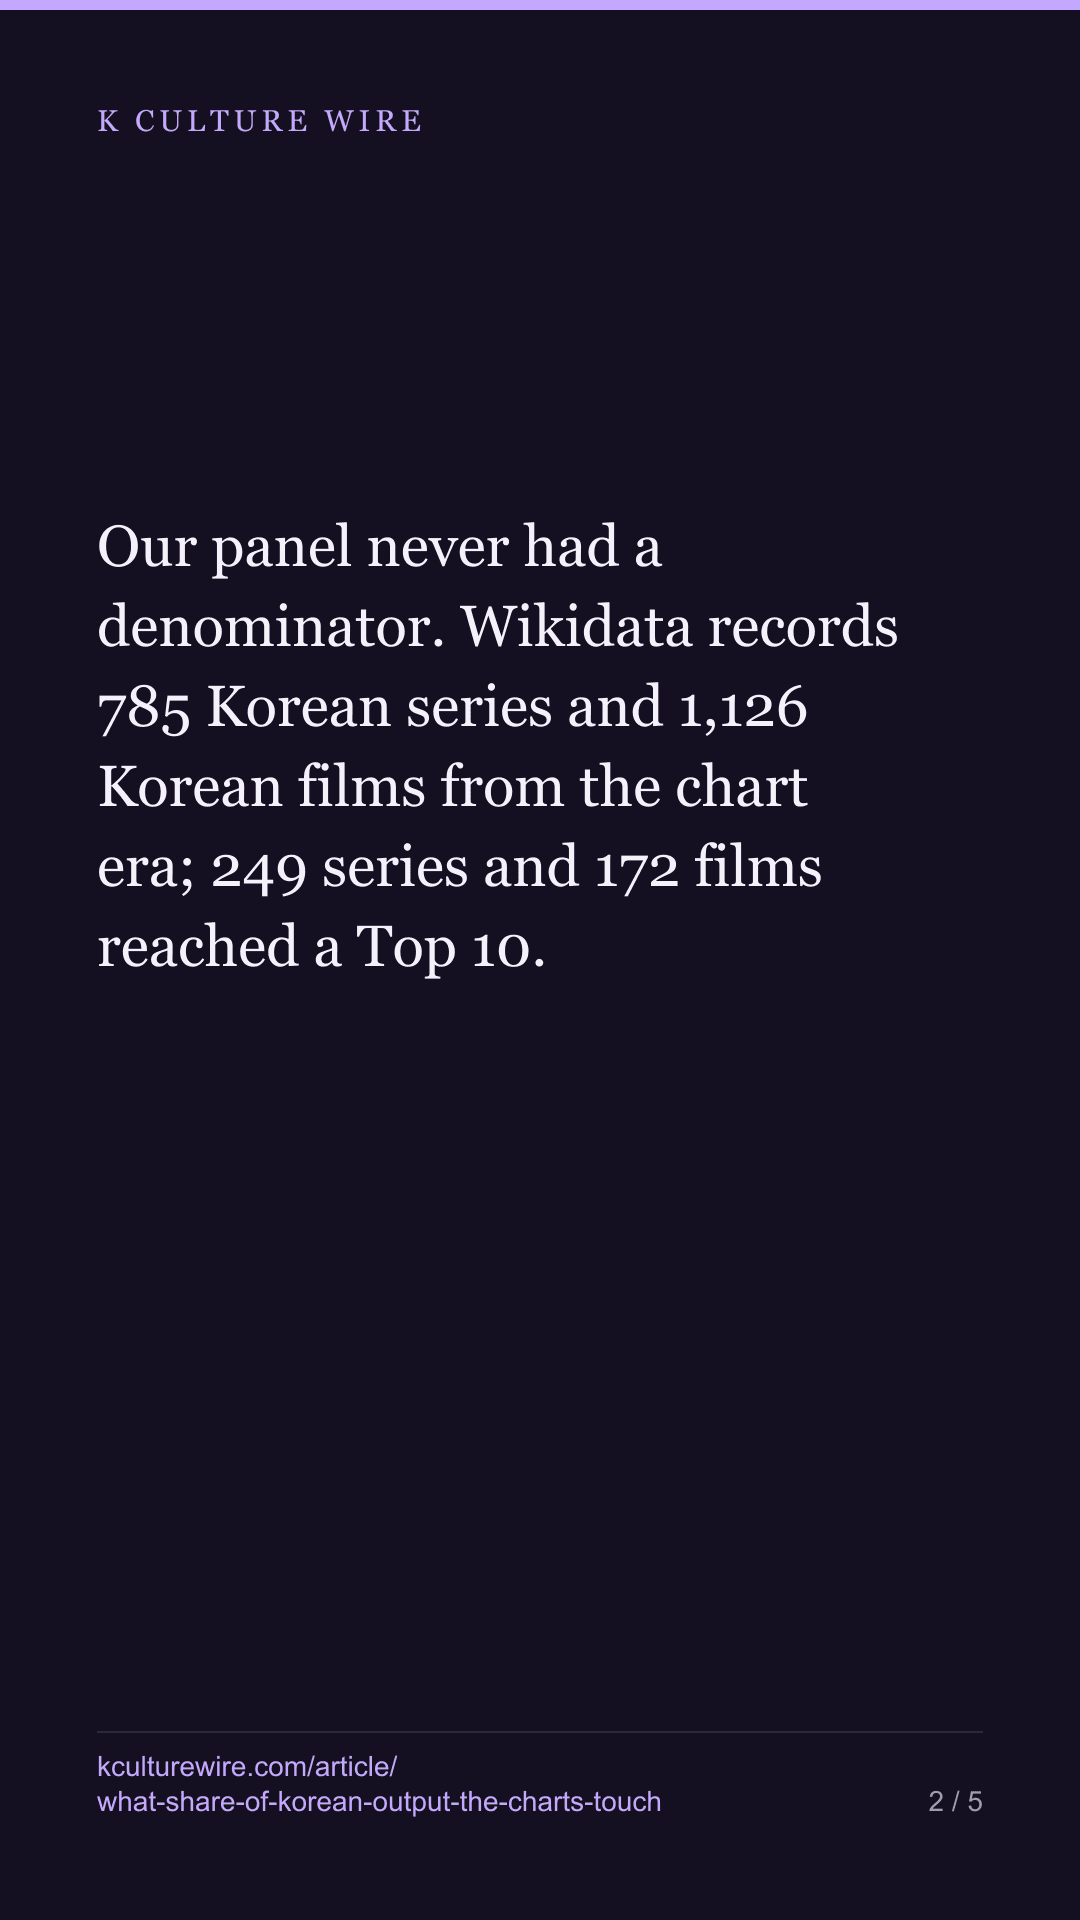
Our panel never had a denominator. Wikidata records 785 Korean series and 1,126 Korean films from the chart era; 249 series and 172 films reached a Top 10. Series are twice as likely to be seen at all.
The table this is written from: /titles
Every figure we publish about Korean titles on Netflix starts from the same place: 421 titles that reached a Top 10 in six Southeast Asian markets. Until today we had never said what that is 421 out of.
A share without a denominator is not a share. So we counted one.
What the charts touch
| Recorded in Wikidata | Made since 2021 | Reached a Top 10 | Share of the chart era | |
|---|---|---|---|---|
| Television series | 4,766 | 785 | 249 | 31.7% |
| Films | 10,253 | 1,126 | 172 | 15.3% |
Roughly three in ten Korean series made since the charts began have appeared on one in Southeast Asia. For films it is about one and a half in ten.
Against the whole recorded catalogue the shares are 5.2% and 1.7%, but those numbers describe an archive rather than a market: most of what Wikidata holds was made long before Netflix published a weekly list, and a 1979 film had no chance to appear on one.
The same asymmetry, again
A Korean series is twice as likely to reach a chart as a Korean film. That is not a new finding here so much as the same finding arriving from a new direction. We have already measured that the median Korean series charts in 35 countries and the median film in 11, and that films are far more likely to carry a name we cannot verify.
Now we can add the step before both: fewer films get onto the chart at all. Whatever is happening to Korean film abroad is happening at the door, not only after it.
We are not going to tell you why. Volume of Korean film output includes a long tail of small releases that were never licensed to a streaming service in Southeast Asia, and nothing in these counts separates that tail from a film that was available and simply not watched. Settling it needs a distribution record we do not have.
How we found our own mistake
The first version of this count asked Wikidata for a publication date (P577) and got 84 Korean
series from the chart era.
Our panel holds 237.
A coverage share cannot exceed 100%, so the error was in the denominator, not the panel: Korean
television series overwhelmingly carry start time (P580) rather than publication date. Counting
both fields raises the chart-era series from 84 to 782 and the ones with any date at all from 210 to
3,792.
The collector now refuses to emit a share above 100% and writes an empty cell instead. The impossible number was the only reason we looked, and if it had been merely implausible rather than impossible we would probably have published it.
What this does not mean
Wikidata is a record of what somebody wrote down, not a census of what was made. Its 10,233 films are a floor. If Korean cinema produced more than that — and it almost certainly did, once you count releases nobody catalogued — then our 14.3% is an upper bound that gets smaller, never larger.
We would rather hand you a ceiling and say so than hand you a number and let you assume it is a count.
What changed on 3 September 2026
The panel is 420 titles, not 421. This piece said 421. We removed Dangerous Liaisons — the 2022 French film — on 25 August after confirming against Wikidata that no Korean work carries that name, and one of the three titles we removed that day sat inside this panel.
We also re-ran the Wikidata denominator query the same day. It now records 785 Korean series and 1,126 Korean films from the chart era, against 784 and 1,122 before — Wikidata gains entries continuously, so this will keep moving. Films that reached a Top 10 went from 173 to 172 and the film share from 15.4% to 15.3%.
The finding did not change. Roughly three in ten Korean series made since the charts began have appeared on one in Southeast Asia, and about one and a half in ten films. Series are still about twice as likely to be seen at all.
What changed on 3 September 2026
We added the chart week of 23 August 2026, which had been in our archive while this panel still stopped at 16 August. One series entered the panel with it, and re-querying Wikidata on the same day returned six more recorded Korean series.
| Was | Now | |
|---|---|---|
| Titles in the panel | 420 | 421 |
| Series that reached a Top 10 | 248 | 249 |
| Films that reached a Top 10 | 172 | 172 (unchanged) |
| Korean series recorded on Wikidata | 4,760 | 4,766 |
| Chart-era series | 785 | 785 (unchanged) |
| Series coverage | 31.6% | 31.7% |
| Film coverage | 15.3% | 15.3% (unchanged) |
The point of the piece is unaffected and so is its size: series are still about twice as likely to be seen at all as films, 31.7% against 15.3%. And the ceiling argument still holds — these are upper bounds that shrink as Wikidata records more, not measurements of a market.
Where these numbers come from
Sources
- Wikidata — Works with country of origin P495 = Q884, split by type — film Q11424 and television series Q5398426 — counted whole, counted with a date, and counted from 2021 using publication date P577 or start time P580 · https://query.wikidata.org
- Netflix — Top 10 weekly country lists (Tudum) for Singapore, Malaysia, the Philippines, Thailand, Indonesia and Vietnam, 2021-07-04 to 2026-07-26 · https://www.netflix.com/tudum/top10
What we checked
- The panel side of every ratio is read from the same file the site is built from, not recounted, so the numerator here cannot drift from the numerator on our other pages
- The first version of this count used publication date alone and returned 84 chart-era series, fewer than the 249 in our own panel. A coverage share above 100% is impossible, which is how we found that series carry start time instead
- The collector now refuses to publish any share above 100% and records it as empty, so the same error cannot reach a page silently
What we left out, and why
- Any claim that these are production totals. Wikidata records what someone wrote down; if more was made than is recorded, our share is lower than shown and never higher
- The whole-catalogue shares as a measure of reach. Most of that catalogue predates the chart entirely, so 1.6% and 5.0% describe the archive, not the era
- Any comparison between the chart-era rows and the whole-catalogue rows. The first counts only items carrying a date and the second counts everything, so they have different denominators
- Documentaries, shorts, web series and anything Wikidata files under another class. Two classes are counted here and nothing else
The data behind this
Written from the same data
Take this away — 10 cards
The figures in this article, as images. Free to repost with the address on them.

If you work in this business
Everything on this page is measured from the same weekly Netflix lists, per market and per title. We publish the pages free; what we sell is the same measurement cut to one company's catalogue — including the figures behind /titles and /screen-split.
What a company sheet contains, and what it cannot tell you →