Our 7.9% is not one place a week — nothing, then several
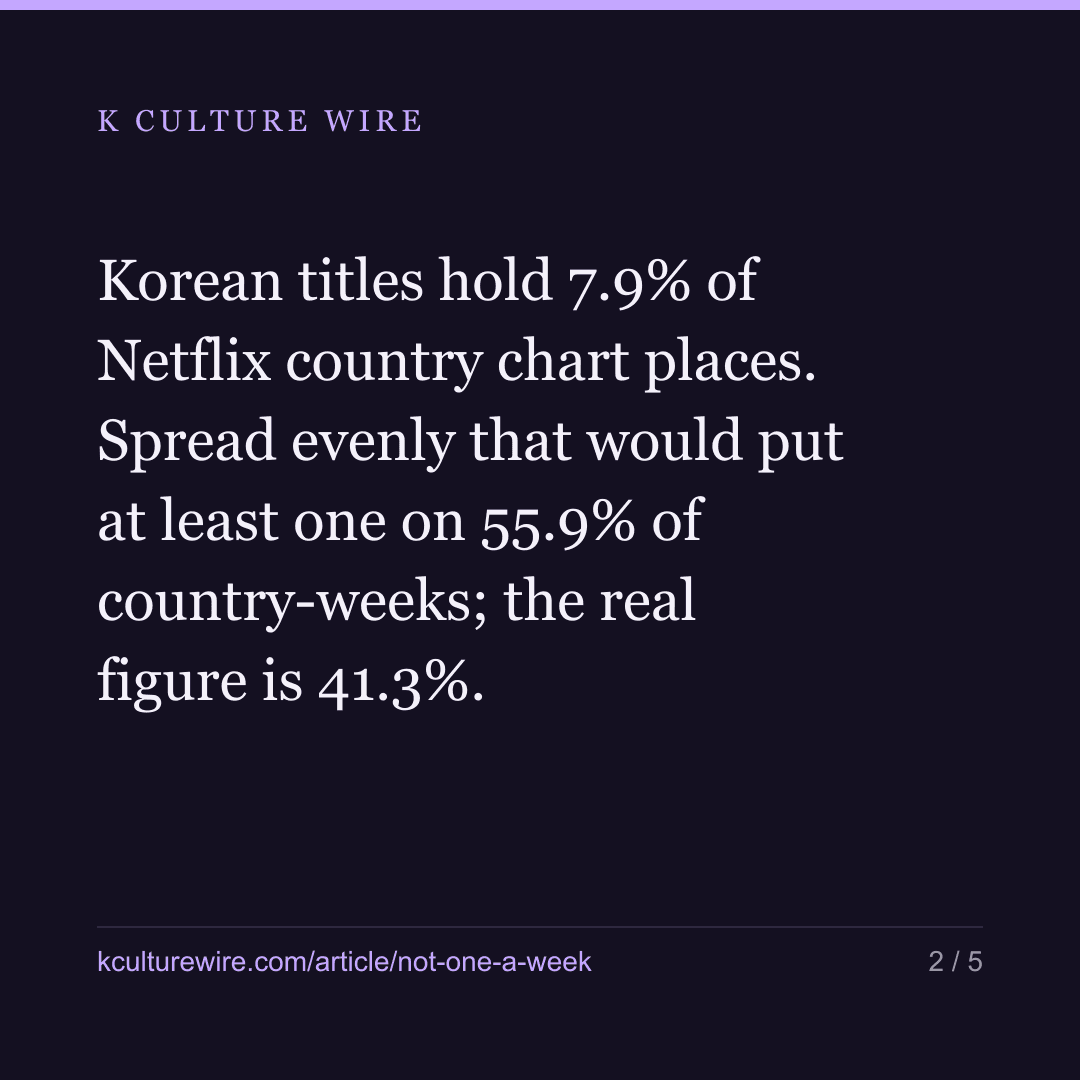
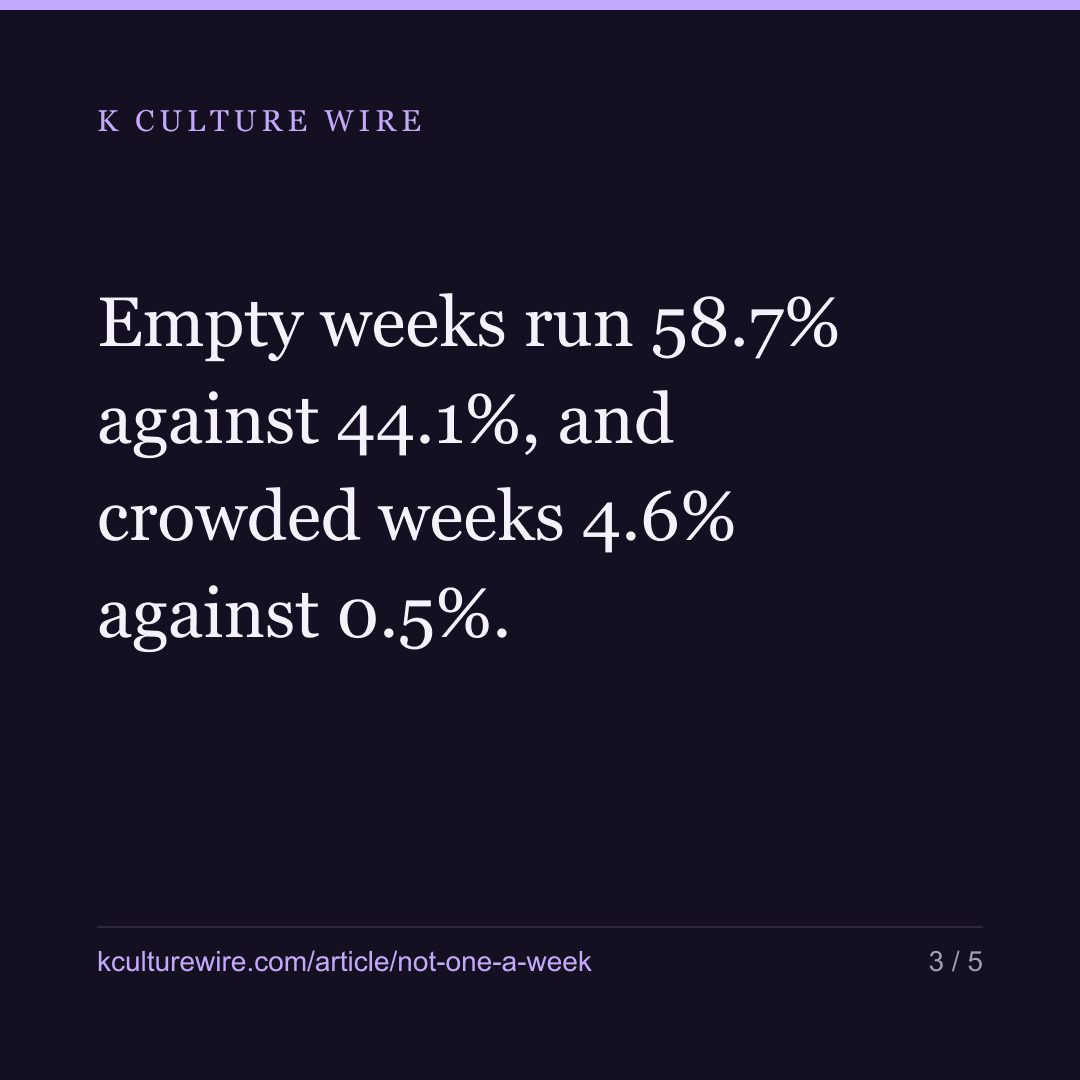
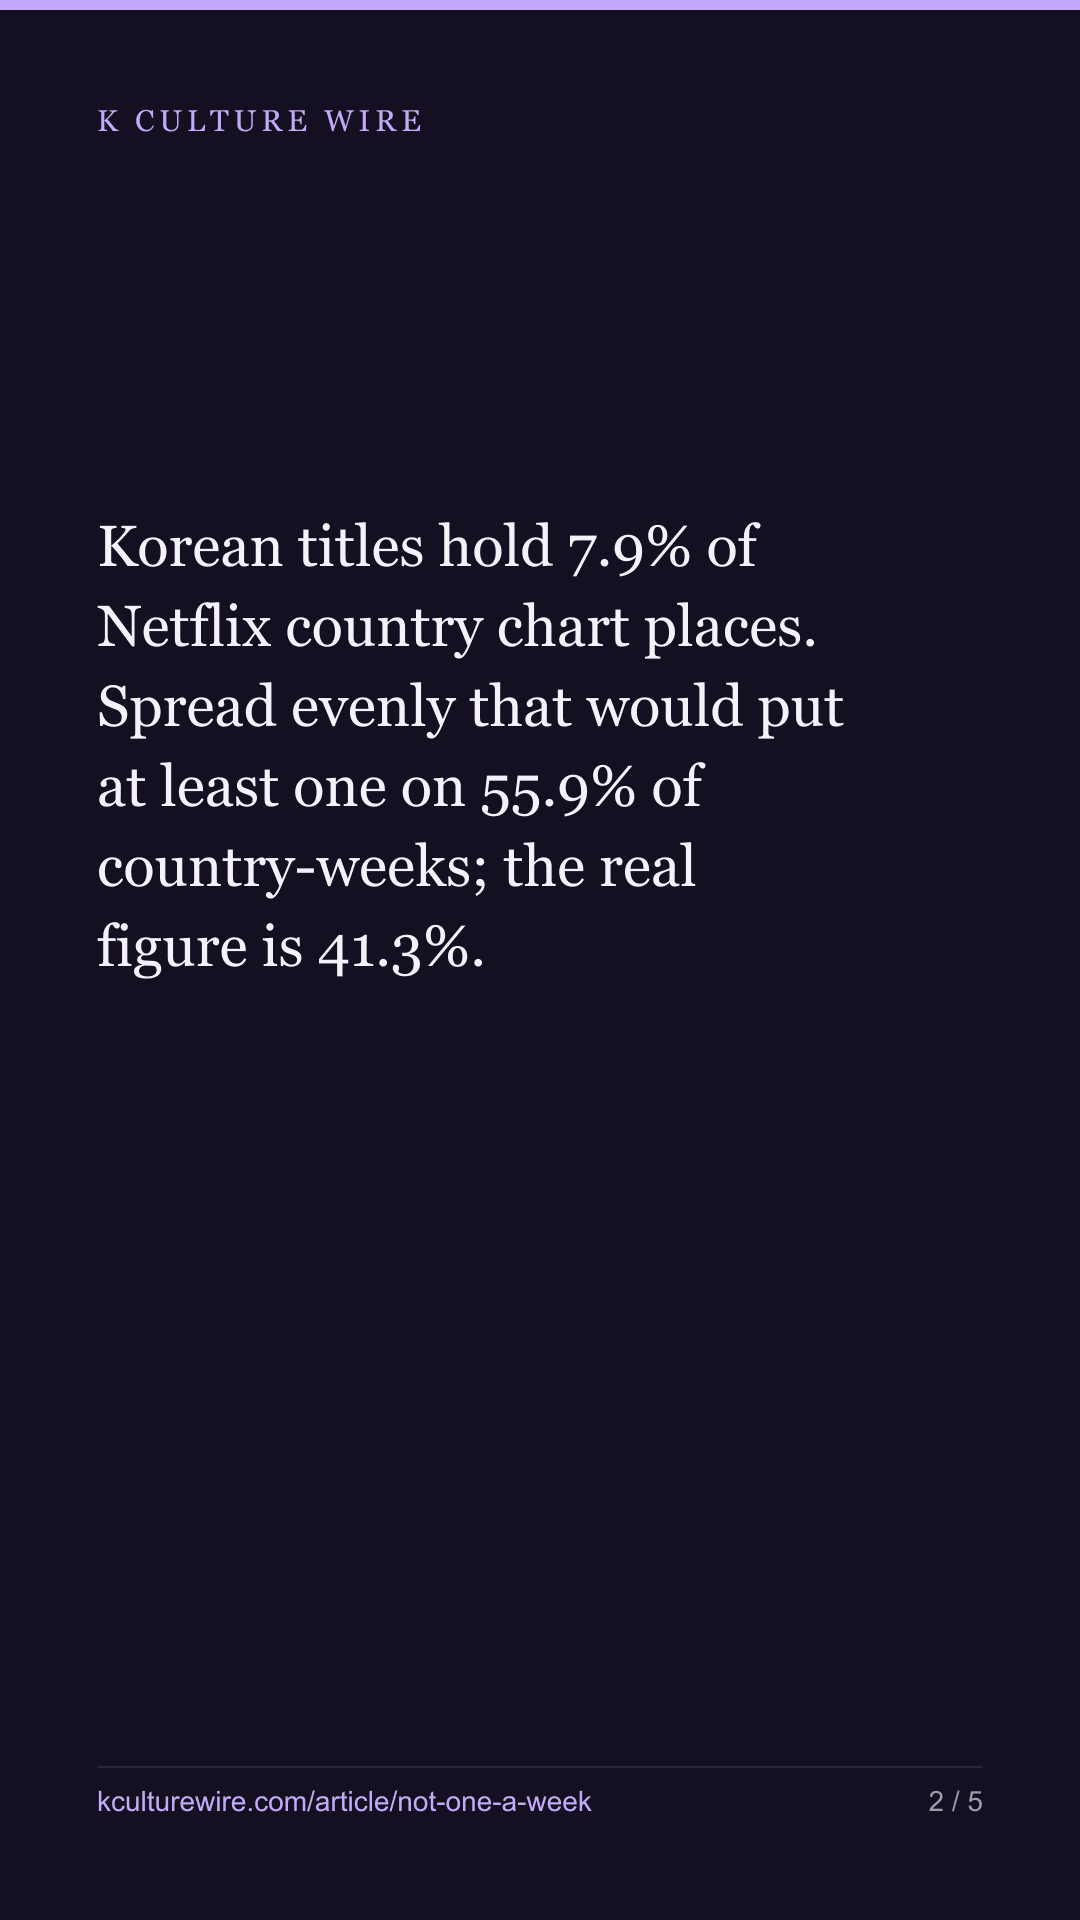
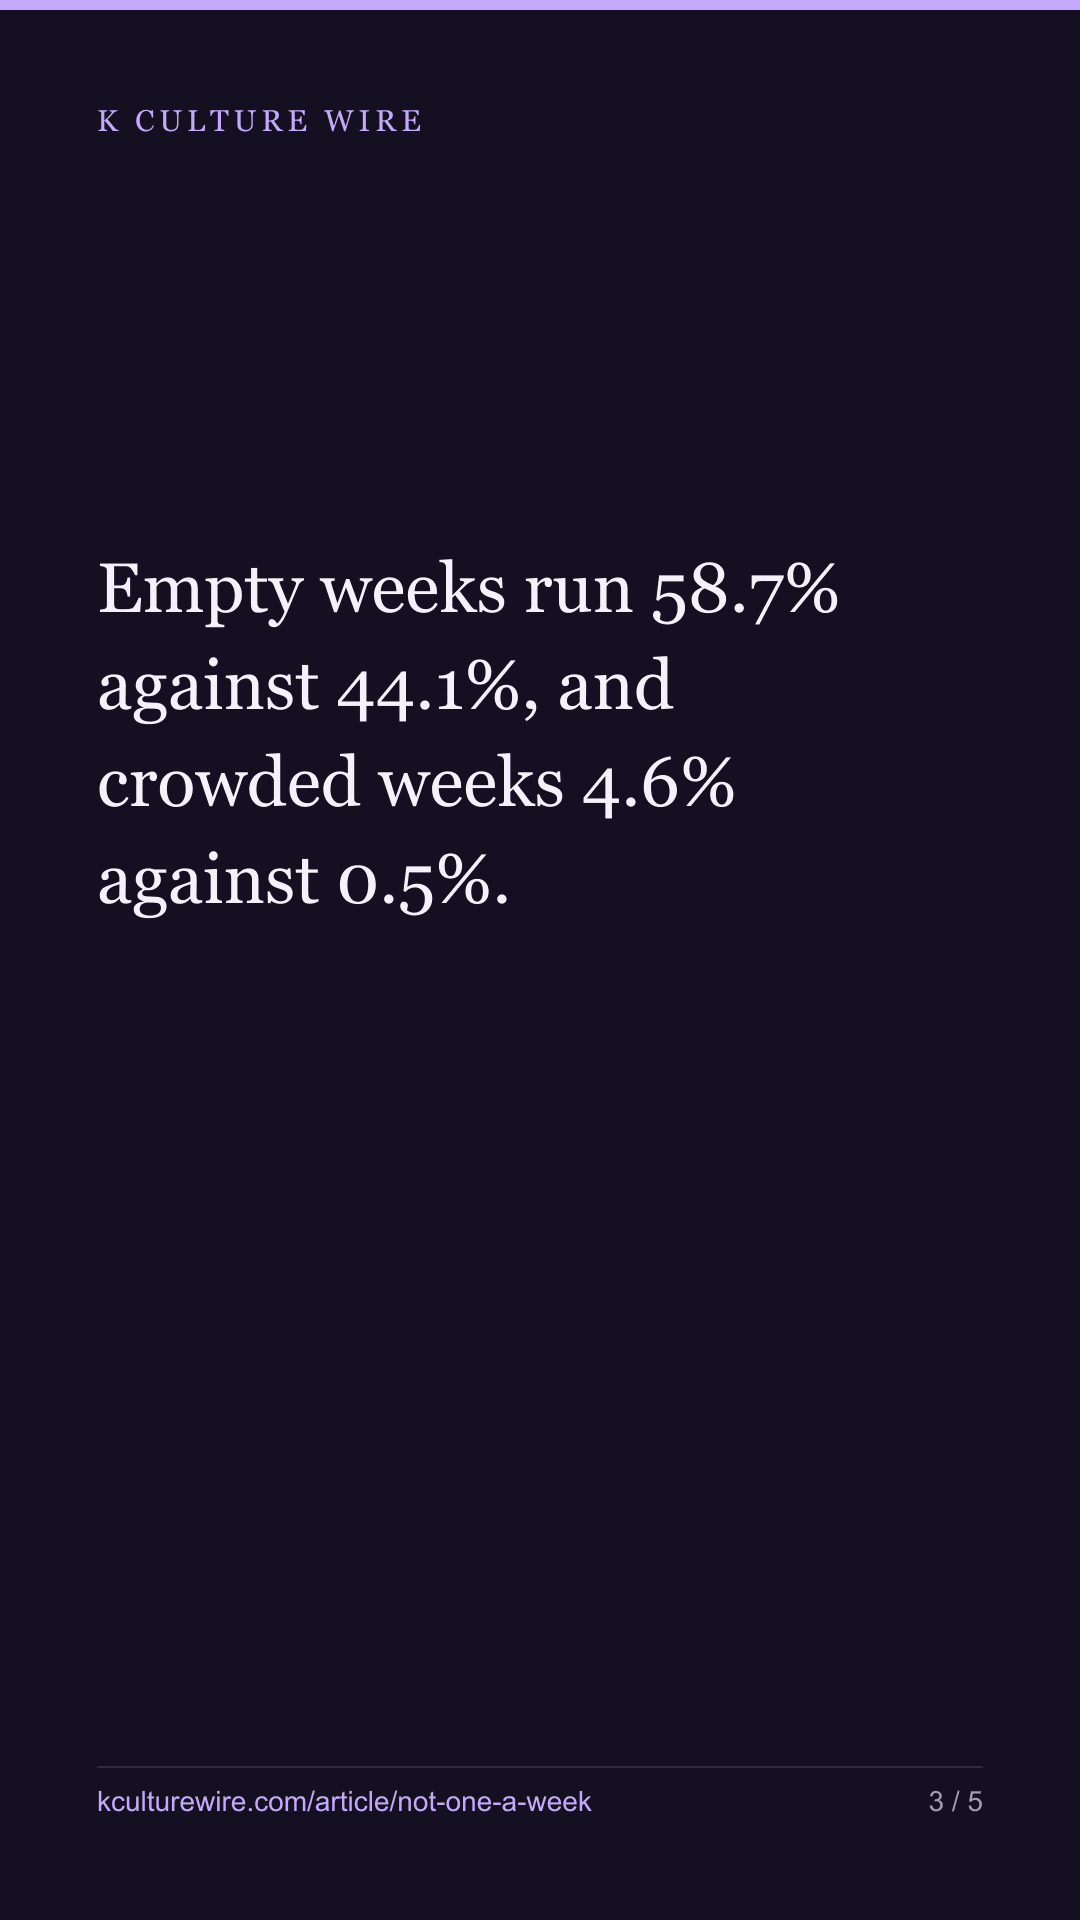
Korean titles hold 7.9% of Netflix country chart places. Spread evenly that would put at least one on 55.9% of country-weeks; the real figure is 41.3%. Empty weeks run 58.7% against 44.1%, and crowded weeks 4.6% against 0.5%.
The table this is written from: /clumping
We publish one figure more than any other: Korean titles hold 7.9% of the top-10 places Netflix lists around the world. It is on our front page, in our sales sheets, and in most of our articles.
This one is about what that average hides, and it hides something.
Ten places cannot hold 0.77 of a title
A country’s Netflix chart has ten places on it, published weekly, in two lists — films and series. Call each of those a country-week: one country, one week, one chart. There are 49,848 of them in the 265 weeks we hold.
7.9% of ten places is 0.79 places. No chart has ever held 0.76 of a title. So the real question is how the whole number falls: is one there most weeks, or none for a long stretch and then a crowd?
To answer that you need to know what unclumped would look like. If places fell independently — the same 7.9%, just scattered — at least one Korean title would appear in 55.9% of country-weeks.
| Country-weeks with at least one Korean title | Share |
|---|---|
| If the same 7.9% fell independently | 55.9% |
| Actually observed | 41.3% |
The same share, sitting in 14.6 points fewer weeks. A reader who takes 7.9% to mean “usually about one” is wrong about a seventh of the calendar.
The middle is what goes missing
| Korean titles in that country-week | Observed | If independent |
|---|---|---|
| 0 | 58.7% | 44.1% |
| 1 | 23.2% | 37.6% |
| 2 | 9.4% | 14.4% |
| 3 | 4.2% | 3.3% |
| 4 | 1.8% | 0.5% |
| 5 | 1.1% | 0% |
| 6 | 0.8% | 0% |
| 7 | 0.6% | 0% |
| 8 | 0.2% | 0% |
| 9 | 0.1% | 0% |
| 10 | 0% | 0% |
Read the two columns against each other and the shape is plain. Empty weeks are commoner than chance allows. So are crowded ones: four or more Korean titles in a single country-week happen 4.6% of the time, where independence would give 0.5% — 9 times as often. What disappears is the middle, the quiet single placement that an average implies.
The bottom of that table is worth pausing on. There are country-weeks in which nine of the ten places are Korean. Independence puts that at 0.0%, which is to say it would essentially never happen. It happens.
It is not one or two markets doing it
The obvious objection is that a handful of markets — the ones that take a great deal of Korean content — are producing the whole effect.
They are not. Every market is compared against a binomial built from its own Korean share, so a country that takes very few Korean titles is not counted as clumped merely for being small. Of the 93 markets with at least 50 country-weeks, 82 come out more clumped than chance.
What this changes about our own figure
Nothing about the 7.9% itself. It is the same 39,139 places, counted with the same rule as everywhere else on this site, and it is correct.
What changes is the sentence it belongs in. “Korean titles hold 7.7% of the world’s chart places” is a statement about a total, not about a typical week, and the two are further apart than an average lets on. A buyer planning a campaign around “there’s usually a Korean title up there” would be planning around a week that does not exist in the shape we measured: the common cases are none, and several.
What this cannot tell you
It cannot say why the places arrive together. Netflix publishes neither release dates by country nor what it promoted where, and a chart place is an outcome rather than a decision. A worldwide release day, a festival, a franchise landing three seasons at once, or simply one enormous title occupying attention — all produce the same shape in these lists, and nothing here separates them.
One limit of our own: the independent comparison assumes each place is a separate draw, which is a deliberate simplification. Titles hold positions across weeks, so consecutive weeks are not truly independent of each other. That makes the comparison a floor rather than a precise counterfactual — the real clumping is at least this much.
Why we bothered
Because it is our own most-quoted number, and the difference between “7.7%” and “nothing, then several at once” is the difference between a figure a buyer can plan on and one they cannot. We would rather publish the shape than let the average do work it cannot do.
The full tables — the whole distribution to ten, the per-market count, and the binomial each market was measured against: how the 7.7% actually falls.
What changed on 3 September 2026
Our list of Korean titles had been frozen at 8 August. We rebuilt it, it went from 397 titles to 420, and one title we had been counting as Korean (Dangerous Liaisons, the 2022 French film) is not. 14 figures in this piece moved with it. None of them changed what the piece found. The ones a reader is most likely to have quoted:
| Was | Now | |
|---|---|---|
| Country-weeks with at least one Korean title | 42.0% | 41.3% |
| Same, if places fell independently | 56.3% | 55.9% |
| Empty country-weeks | 58.0% | 58.7% |
| Markets more clumped than chance | 79 of 93 | 82 of 93 |
Every table above is now generated from the counted file rather than typed out, and a check reads each figure back out of that file on every build. We print what moved rather than swapping it quietly: one wrong number makes the correct ones beside it worth doubting.
Where these numbers come from
Sources
- Netflix — Tudum weekly Top 10 country lists, 268 weeks to 2026-08-16, 498,480 chart places across 93 markets and 49,848 country-week-charts · https://www.netflix.com/tudum/top10
- Wikidata — Korean titles identified by item number rather than by name, using country of origin · https://query.wikidata.org
What we checked
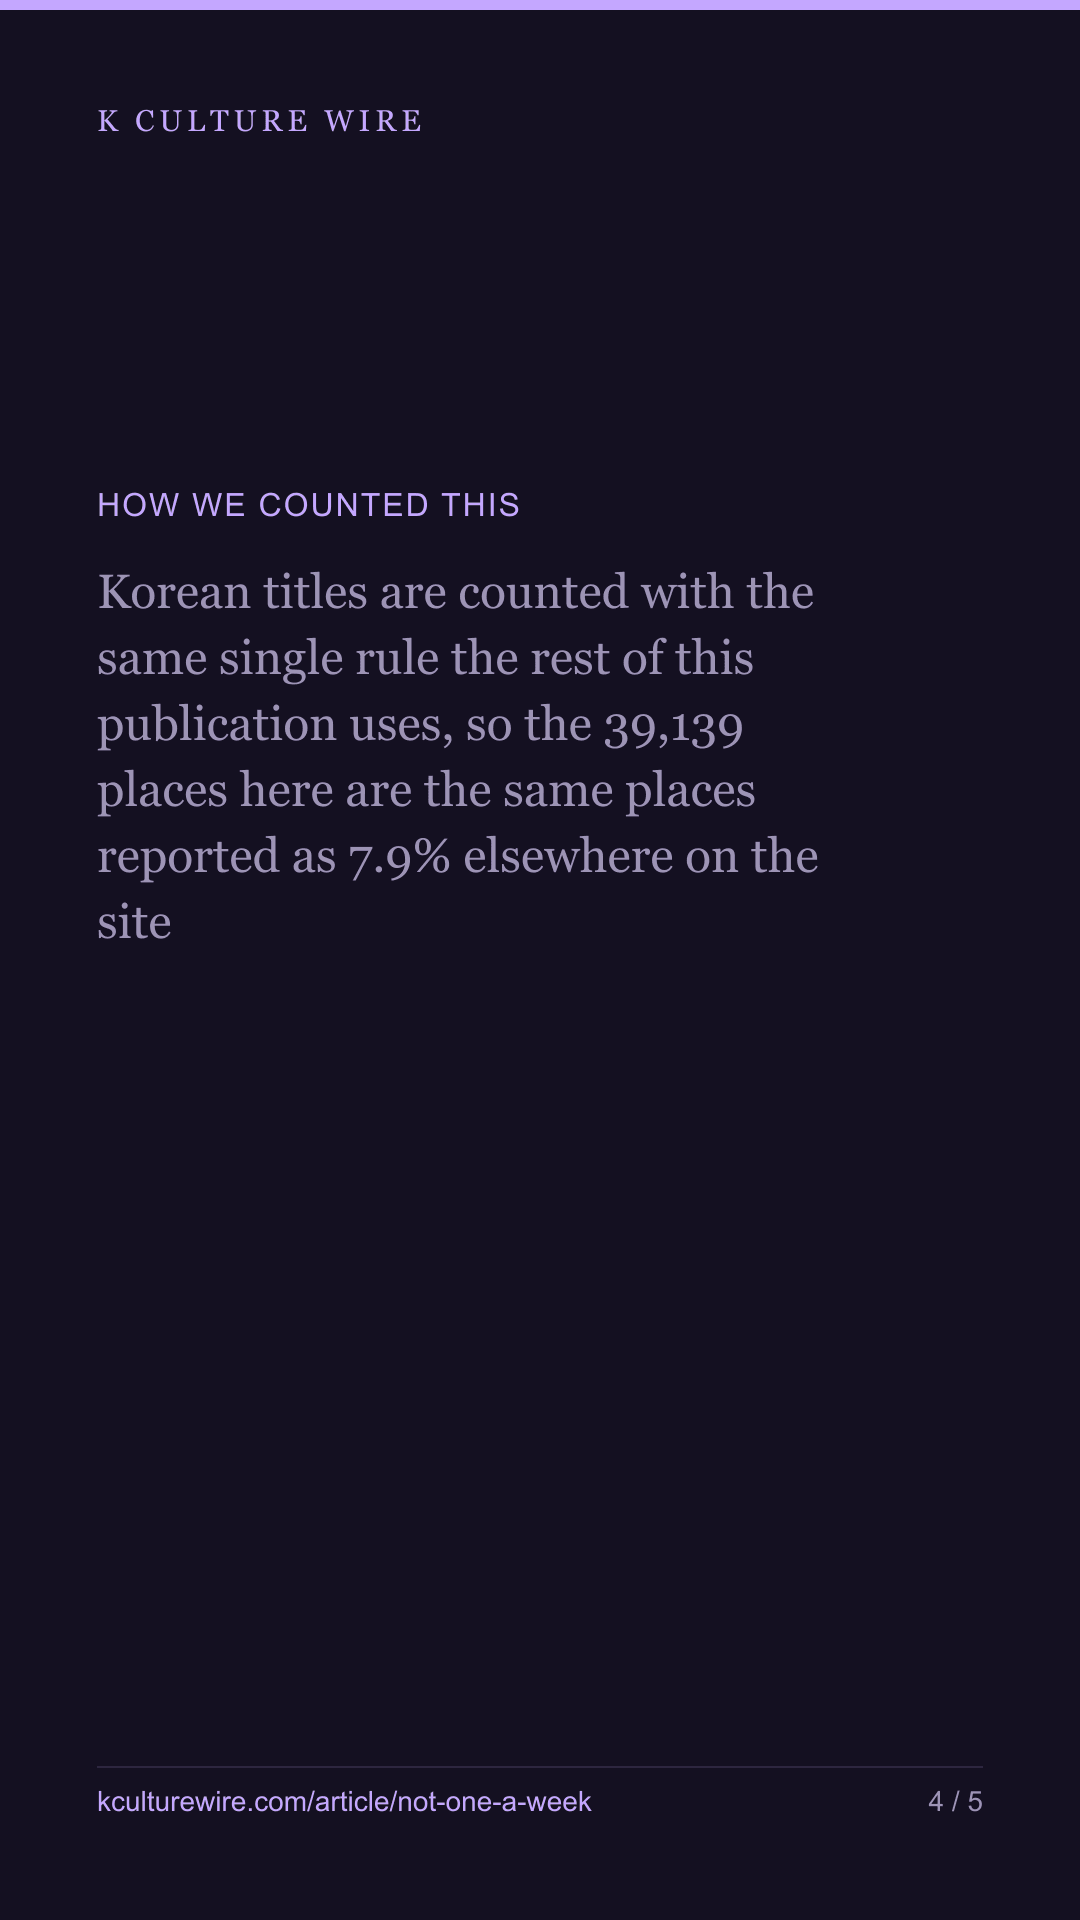
- Korean titles are counted with the same single rule the rest of this publication uses, so the 39,139 places here are the same places reported as 7.9% elsewhere on the site
- The comparison is a binomial built from each country's own Korean share, so a market that takes few Korean titles is not counted as clumped merely for being small
- Every market with at least 50 country-weeks is measured and the count that comes out more clumped than chance is reported rather than a selected subset
- The collector refuses to write if the observed share of weeks with any Korean title is not below the independent figure, which would mean the finding had reversed
What we left out, and why
- Russia, excluded across this publication because Netflix withdrew and the remaining weeks are not comparable
- Markets with fewer than 50 country-weeks of data, which cannot support a distribution
The data behind this
Written from the same data
Take this away — 10 cards
The figures in this article, as images. Free to repost with the address on them.
If you work in this business
Everything on this page is measured from the same weekly Netflix lists, per market and per title. We publish the pages free; what we sell is the same measurement cut to one company's catalogue — including the figures behind /clumping.
What a company sheet contains, and what it cannot tell you →