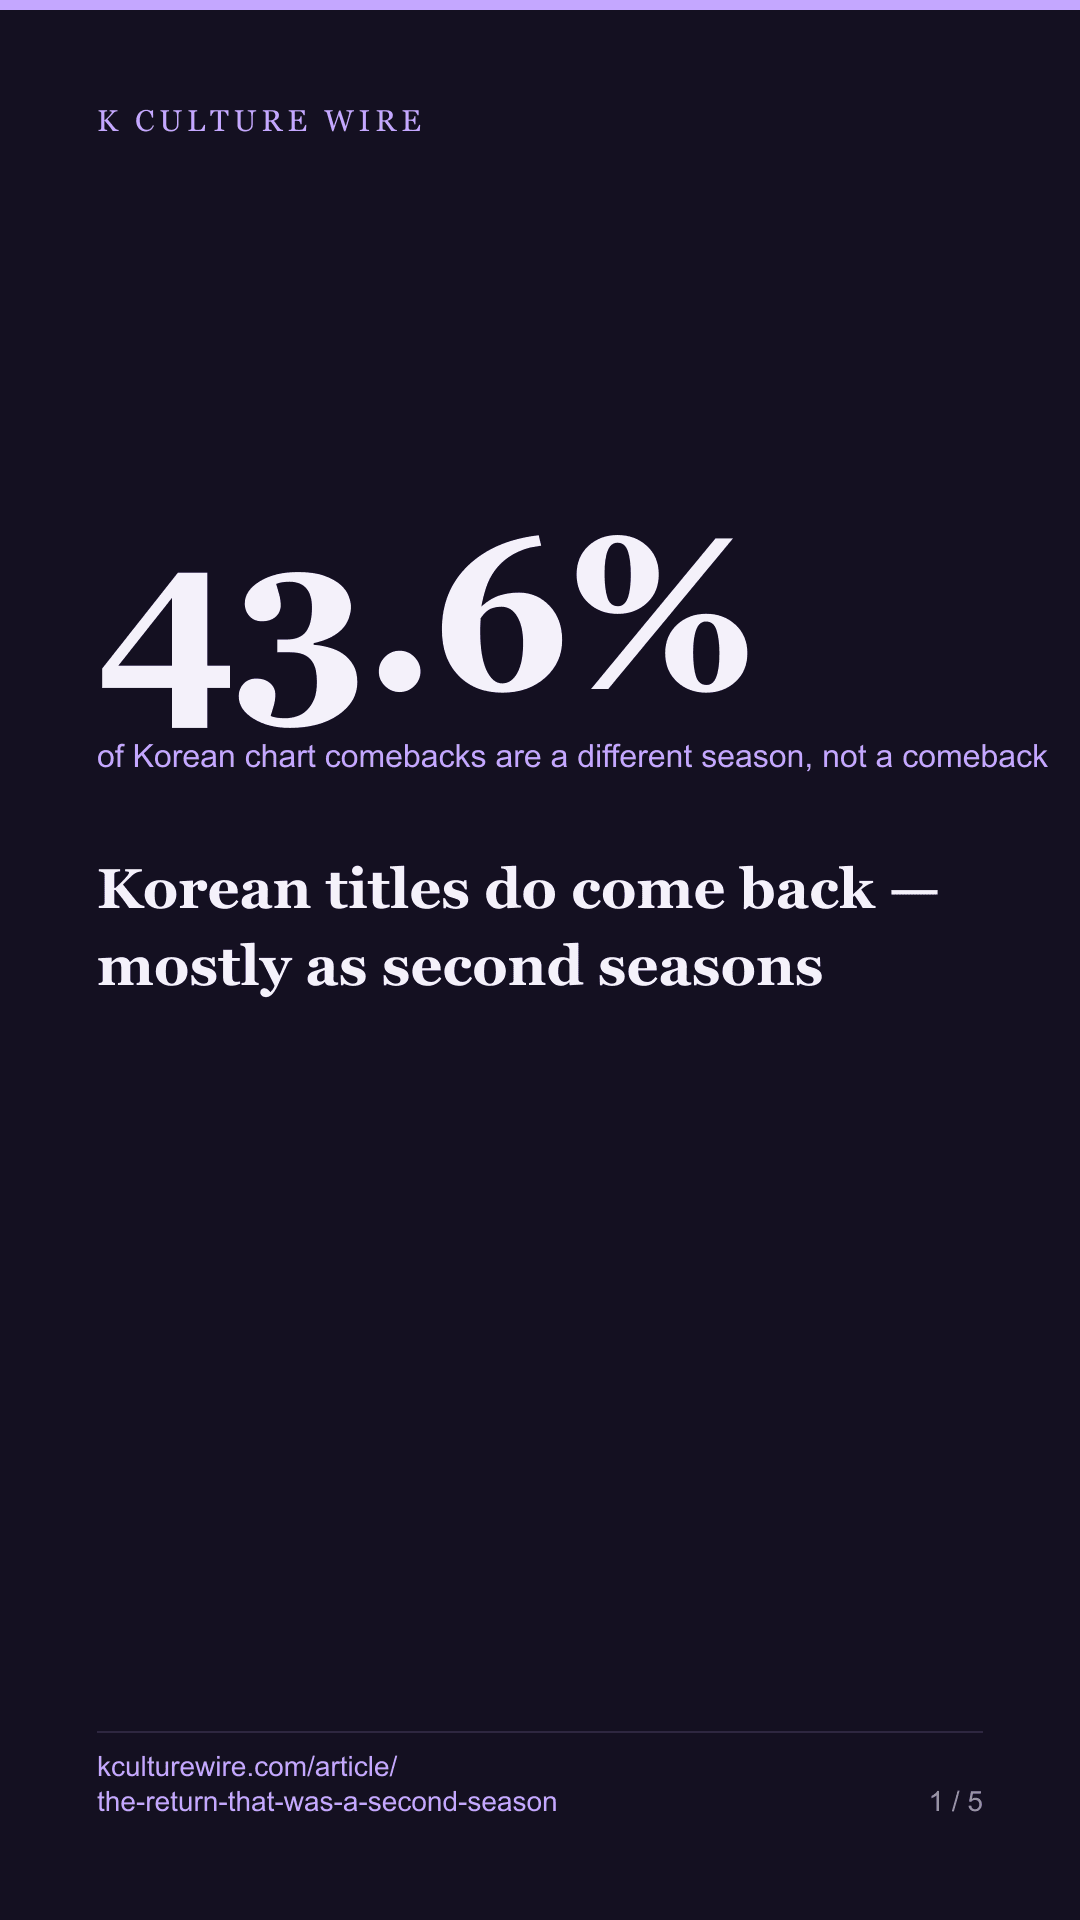
Korean titles do come back — mostly as second seasons
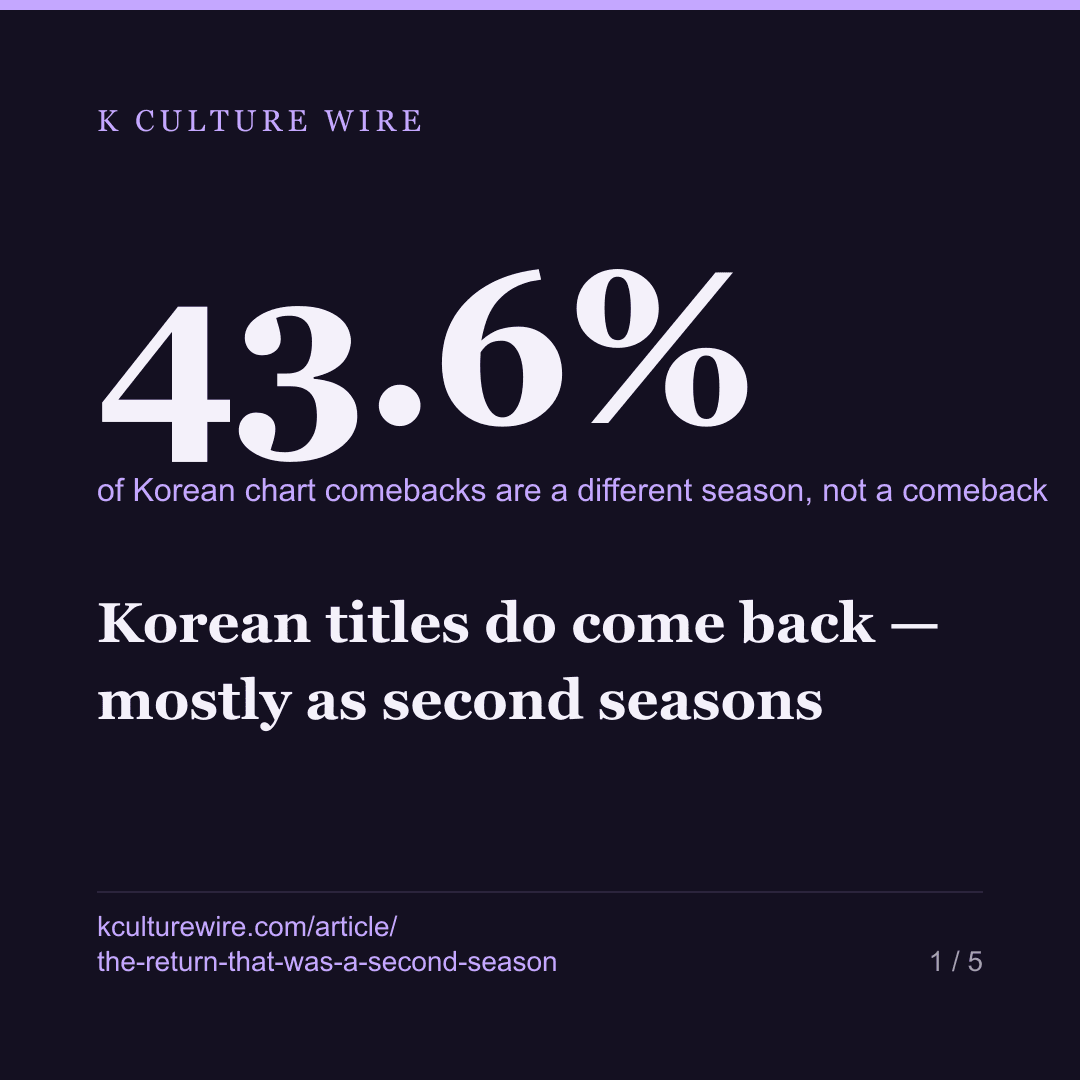
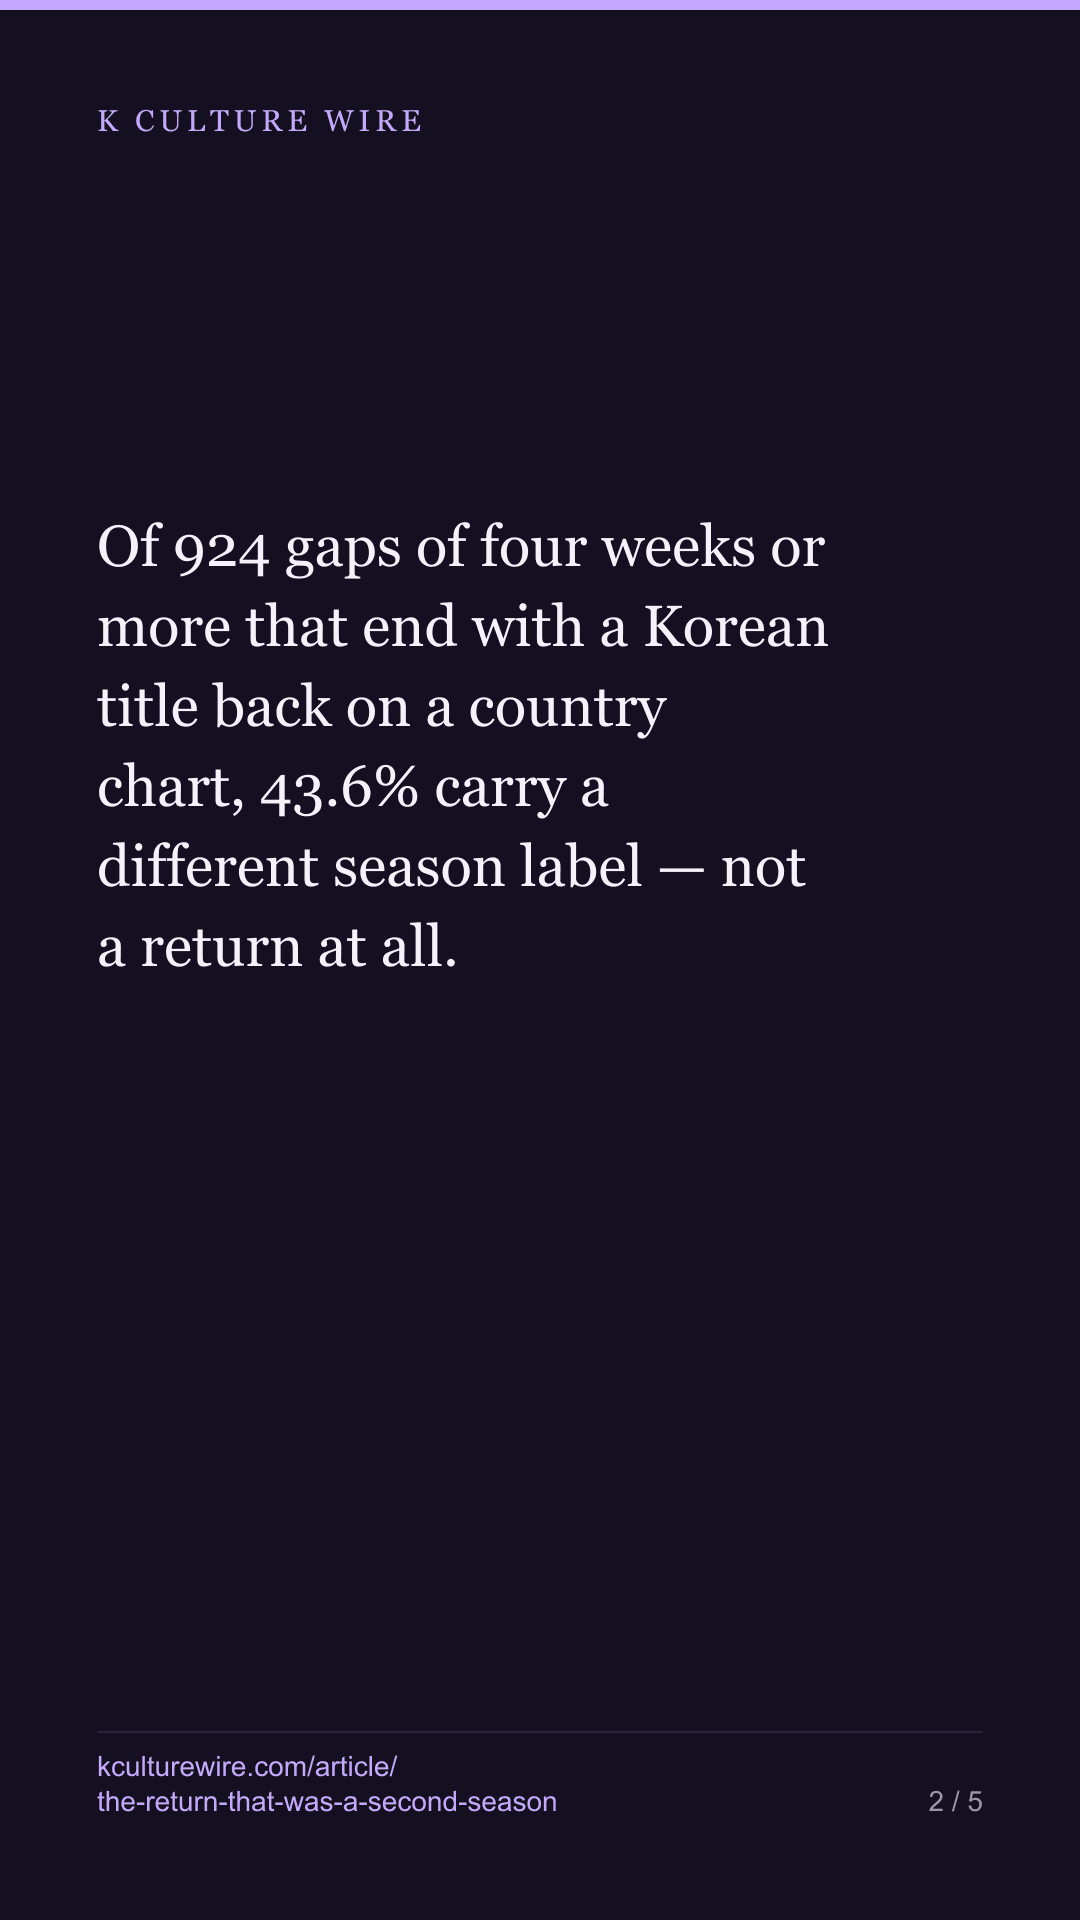
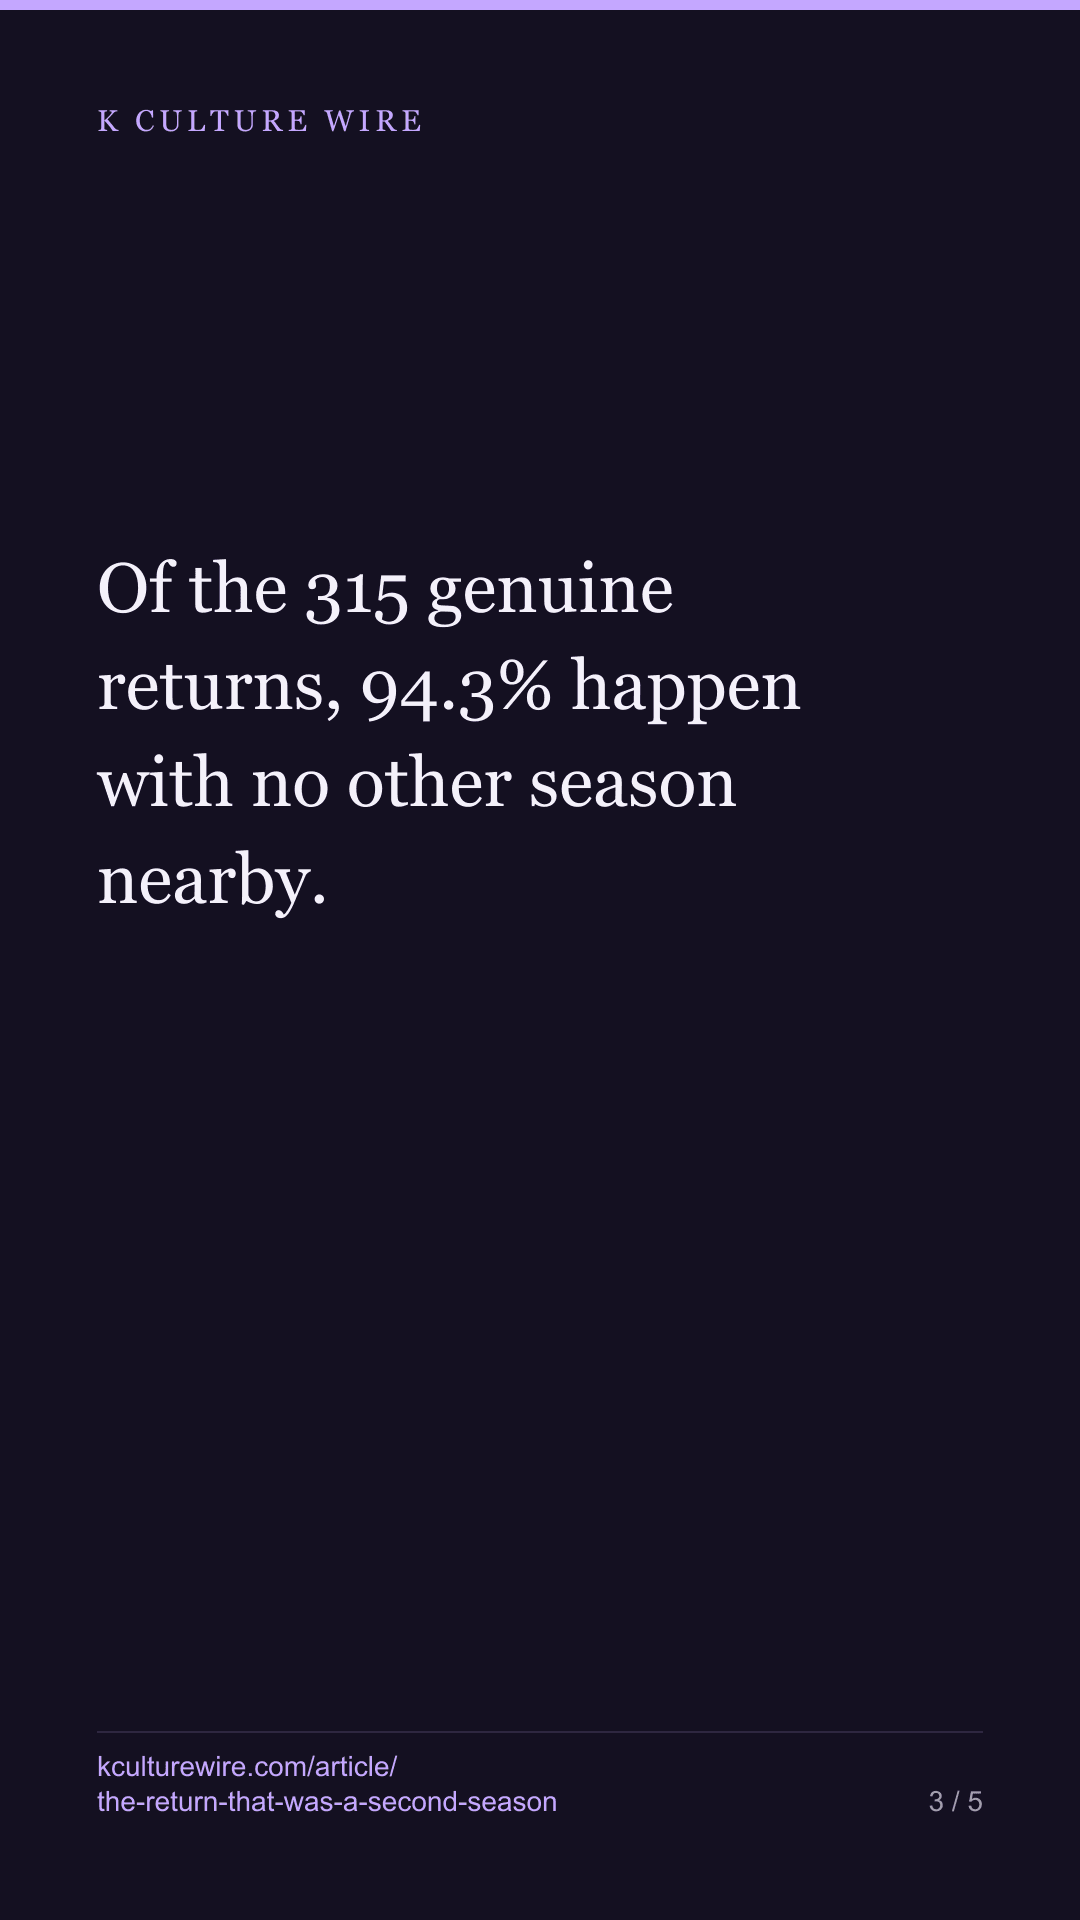
Of 924 gaps of four weeks or more that end with a Korean title back on a country chart, 43.6% carry a different season label — not a return at all. Of the 315 genuine returns, 94.3% happen with no other season nearby.
The table this is written from: /returns
Every chart page we publish treats a title’s life as one run: so many weeks, so many countries, a peak position. That is a simplification, and until this week we had not checked what it costs.
It is not always one run. A title leaves a country’s top 10 and, sometimes, comes back.
The first thing we saw was wrong
Across 7,257 title-and-market cells, 924 gaps of four weeks or more end with the title back on that country’s chart. The longest was 223 weeks — more than four years — and it belonged to Juvenile Justice in several markets at once.
Four years is not a comeback. It is a second season.
Netflix attaches a season label to each chart row, so we split the gaps on that label rather than on our own reading:
| Gaps of four weeks or more | Cells | Share |
|---|---|---|
| Season label changed — a new season, not a return | 403 | 43.6% |
| Same season — the title genuinely came back | 315 | 34.1% |
| No season label on one side — we cannot tell | 206 | 22.3% |
Nearly half of what looks like a Korean title returning to a chart is a different season of that title arriving. Had we not split on the label, we would have published a number about catalogue revival that was largely a number about sequels.
The third row is not small print. Netflix carries a season label on 79% of Korean chart rows, so a fifth of the gaps cannot be classified at all. They stay in their own row.
The explanation we had, and had to drop
The obvious reading of a genuine return is that a new season arrived and pulled the old one back up with it. Everyone has seen a streaming service do this.
We checked. For each of the 316 genuine returns, was another season of the same title on that same country’s chart within four weeks either side?
18 of them. 5.7%.
The other 94.3% came back alone — no new season on that chart, in that market, anywhere near the week they reappeared. The two cases that do fit the pattern are the ones you would guess: Squid Game season one and Alchemy of Souls part one.
That is the finding, and it is not the one we set out to confirm.
Why we trust the split more than the threshold
Four weeks is our choice, not Netflix’s, so here is what happens at other thresholds:
| Gap of at least | Gaps | Season changed | Same season | Cannot tell |
|---|---|---|---|---|
| 2 weeks | 1,122 | 445 | 453 | 224 |
| 3 weeks | 987 | 415 | 360 | 212 |
| 4 weeks | 924 | 403 | 315 | 206 |
| 6 weeks | 879 | 401 | 279 | 199 |
| 8 weeks | 830 | 400 | 238 | 192 |
| 12 weeks | 755 | 387 | 190 | 178 |
Read the season-changed column down: 429 at two weeks, 411 at twelve. It barely moves. A gap between two seasons is long by construction, so raising the bar does not remove those cases. The same-season column falls by more than half over the same range.
Whichever threshold you pick, the long gaps are mostly seasons. That is what makes the split worth doing, and it is why we are more confident in the classification than in the cut-off.
How common is any of this
Returning is the exception, and we would rather say so than let a mechanism read as a trend. Of the 7,257 title-and-market cells, 6,121 are a single unbroken run with no gap at all. Only 58 distinct titles came back anywhere across 93 markets and five years.
What this cannot tell you
It cannot tell you why. A public holiday, a cast member in the news, a promotion slot, a licence renewal, or simply a quiet week in that market would all produce the same row here. Netflix publishes the position and the season label. It does not publish the reason, and neither will we.
Why we bothered
Because it changes what a catalogue is worth. If old seasons only chart again when a sequel drags them up, a back catalogue is an accessory to new commissioning. If they come back on their own — which is what 94.3% of the genuine returns say — then a title that stopped charting three years ago is not finished, and the rights to it are not either.
The full table, all six thresholds, the ten longest genuine returns and the coverage limit on the season label: when a title comes back. How long titles stay in the first place is at staying power.
What changed on 3 September 2026
Recounted against a rebuilt title list. The answer is unchanged — most Korean chart “returns” are a new season, not a return — and the share of them that are is a little lower than we published:
| Was | Now | |
|---|---|---|
| Cells measured | 7,383 | 7,257 |
| Gaps of four weeks or more | 957 | 924 |
| Season label changed | 435 (45.5%) | 403 (43.6%) |
| Same season — a genuine return | 316 (33.0%) | 315 (34.1%) |
| No label on one side | 206 (21.5%) | 206 (22.3%) |
| Rows carrying a season label | 78.7% | 79% |
| Distinct titles that came back anywhere | 59 | 58 |
Both tables — the three-row result and the six-row threshold table published beside it — are now generated from the counted file. The threshold table is the one that lets a reader judge our four-week cut rather than trust it, so it is the last table in the piece that should ever be typed by hand.
Where these numbers come from
Sources
- Netflix — Tudum weekly Top 10 country lists, 2021-07-04 to 2026-08-16, including the season label attached to each chart row · https://www.netflix.com/tudum/top10
- Wikidata — Country of origin (P495 = Q884) on charting titles, retrieved by item number rather than by name · https://query.wikidata.org
What we checked
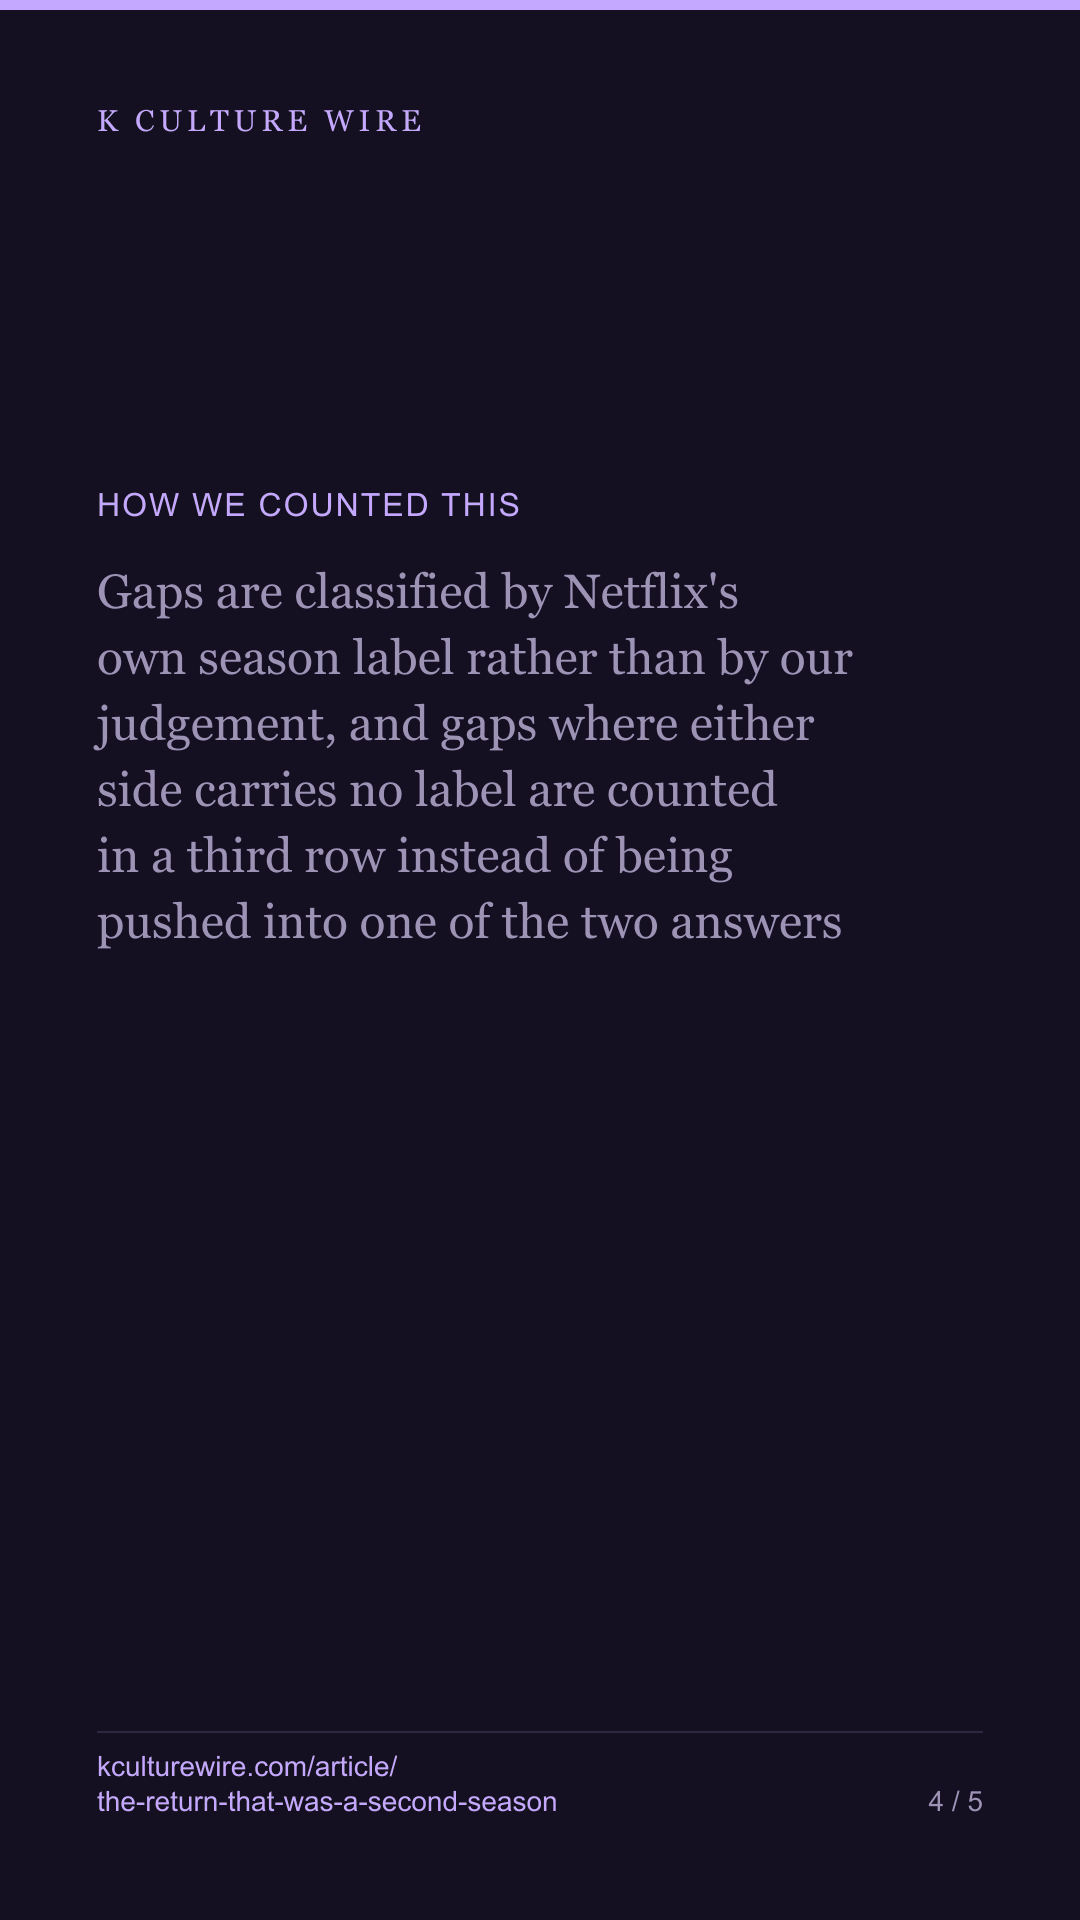
- Gaps are classified by Netflix's own season label rather than by our judgement, and gaps where either side carries no label are counted in a third row instead of being pushed into one of the two answers
- The four-week threshold is ours, so the same split is published at two, three, six, eight and twelve weeks beside it
- The hypothesis that a new season pulls an old one back was tested rather than assumed, and it failed
What we left out, and why
- Any explanation of why a title returned. A holiday, a cast member in the news, a promotion slot and a quiet week in that market would all look identical here
- Russia, which Netflix withdrew from, as on every page of this site
The data behind this
Written from the same data
Take this away — 10 cards
The figures in this article, as images. Free to repost with the address on them.
If you work in this business
Everything on this page is measured from the same weekly Netflix lists, per market and per title. We publish the pages free; what we sell is the same measurement cut to one company's catalogue — including the figures behind /returns.
What a company sheet contains, and what it cannot tell you →