Korean titles travel 2 ways. The average describes neither
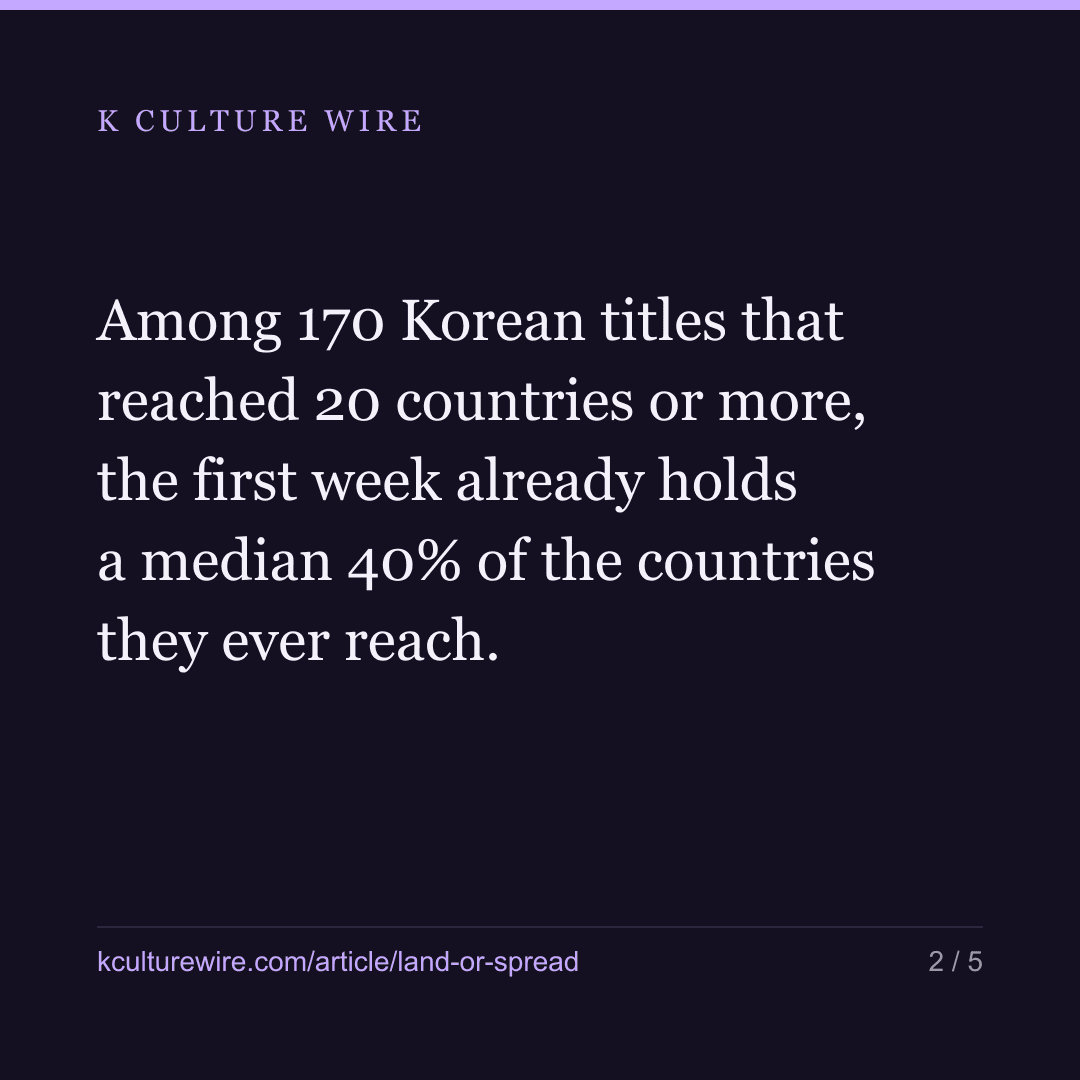
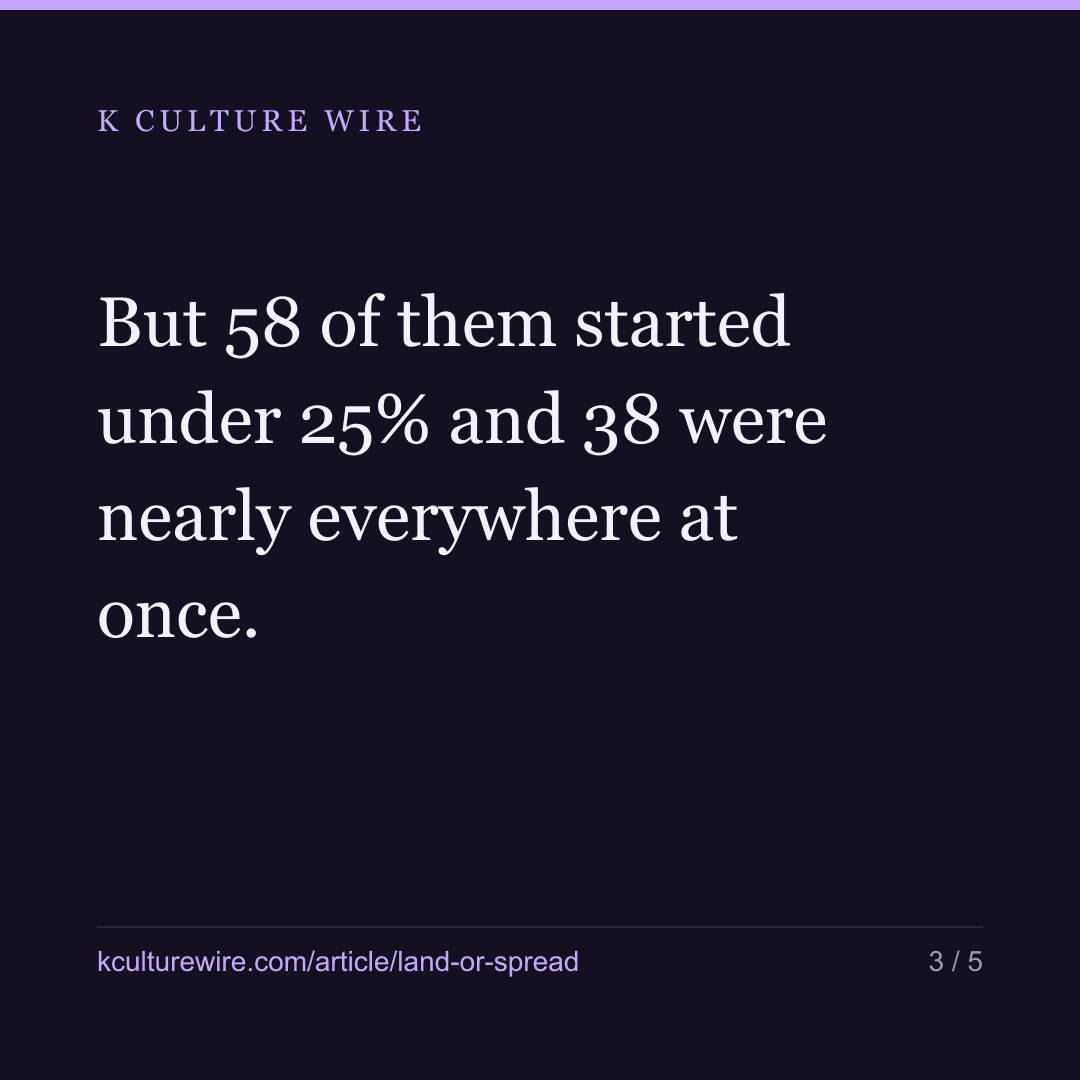
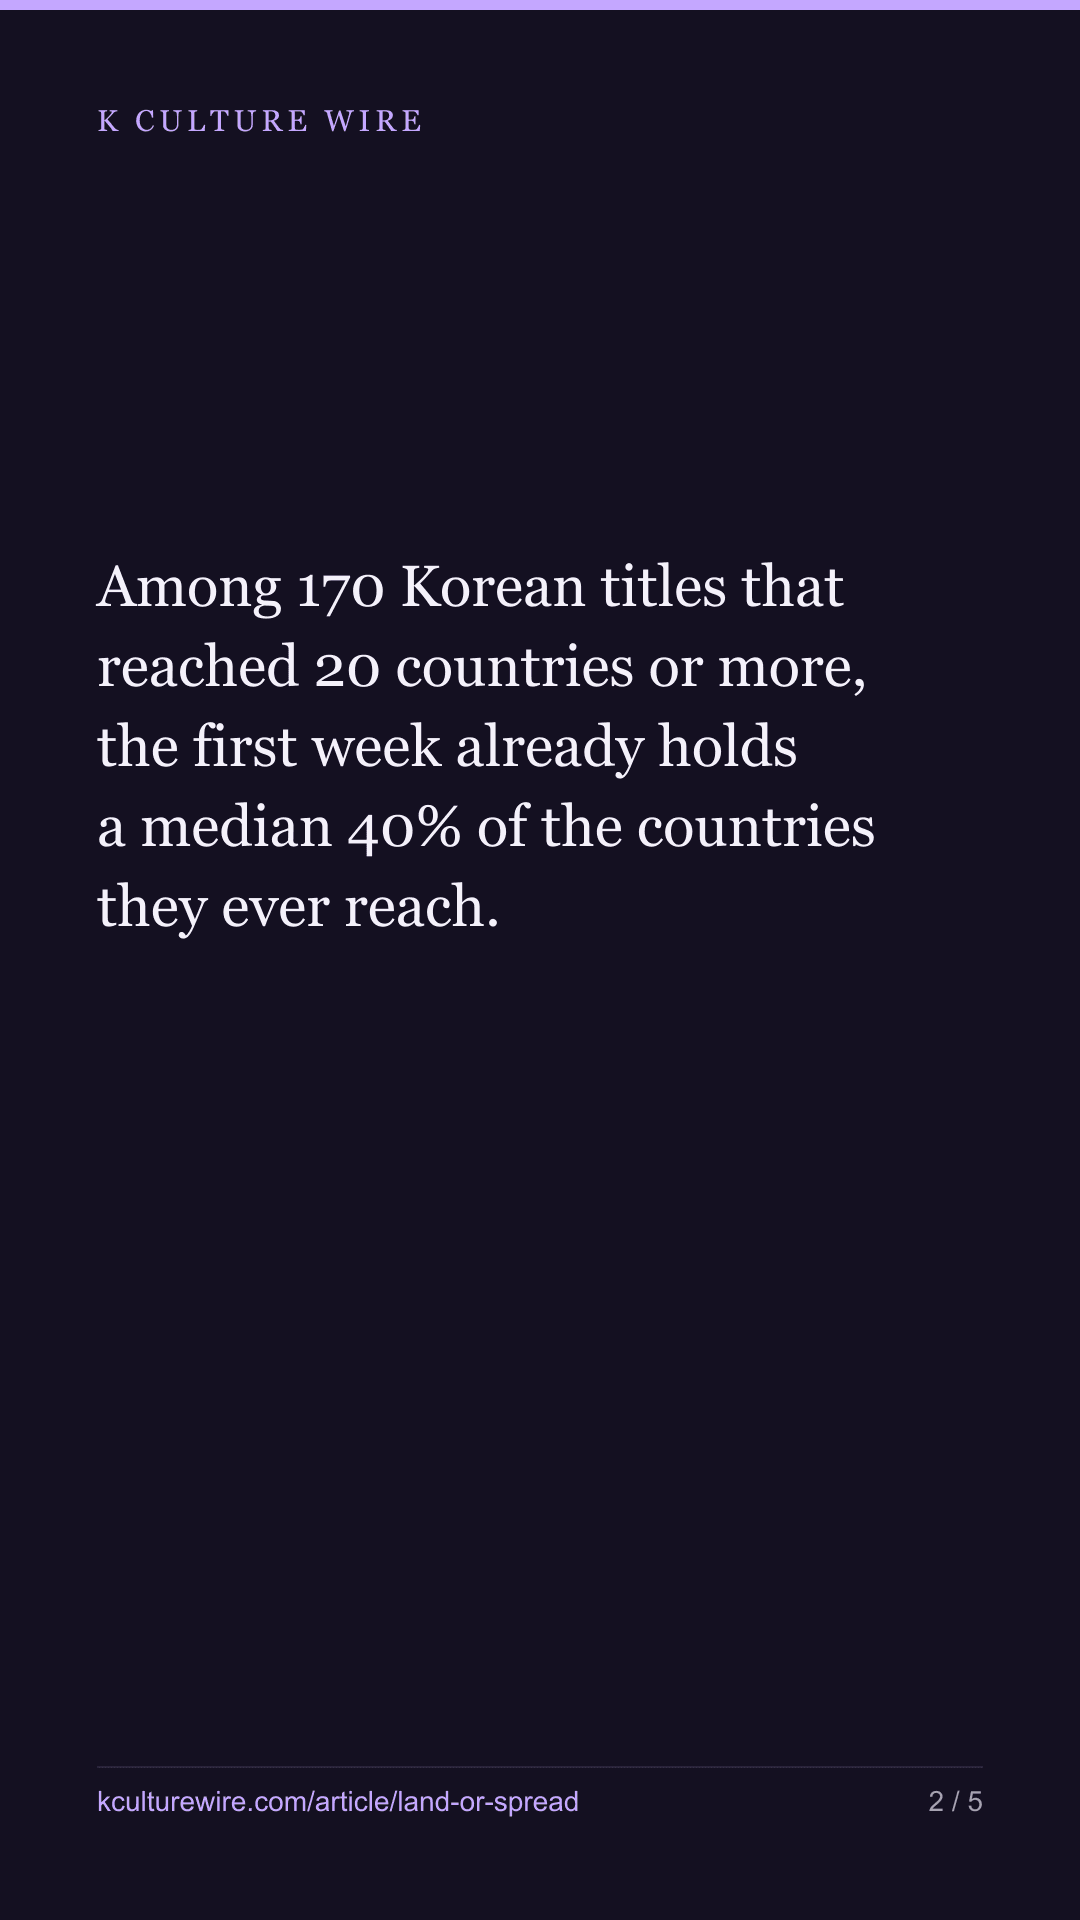
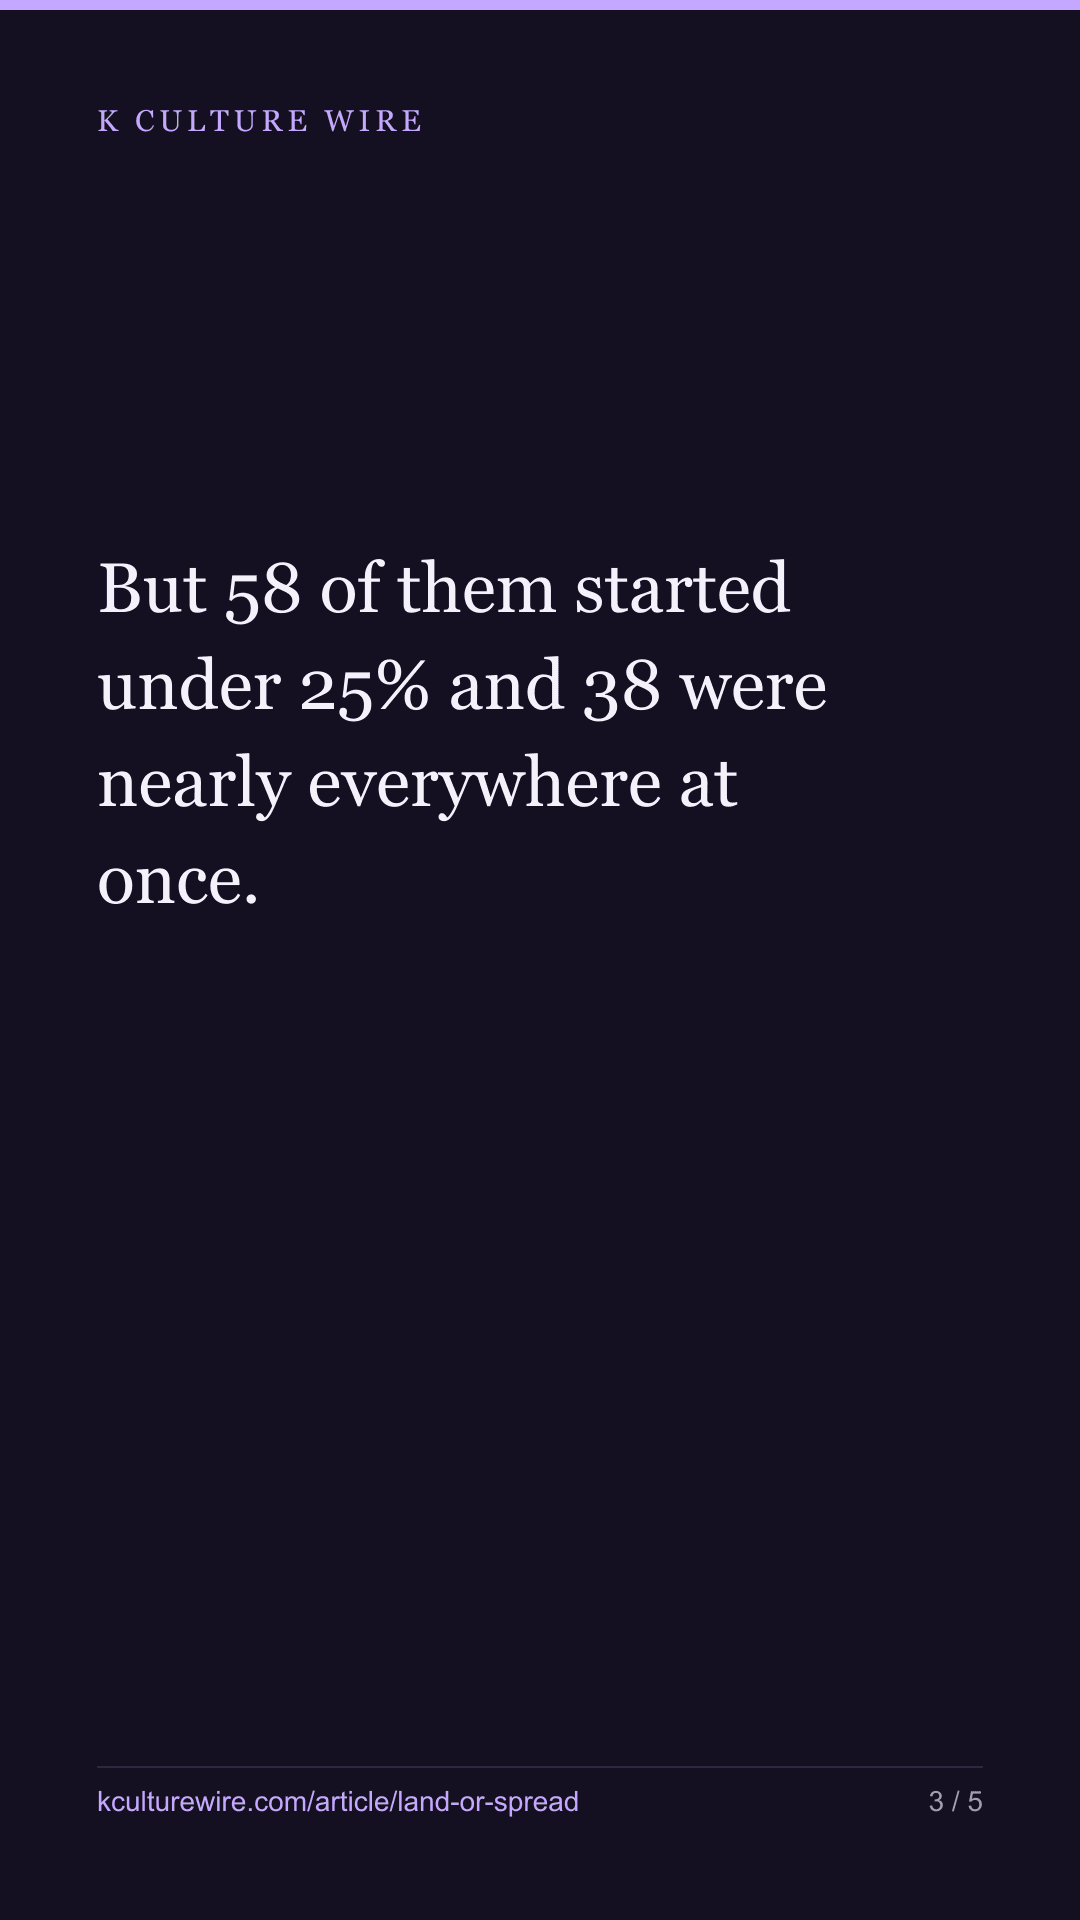
Among 170 Korean titles that reached 20 countries or more, the first week already holds a median 40% of the countries they ever reach. But 58 of them started under 25% and 38 were nearly everywhere at once.
The table this is written from: /arrival
We set out to find the gateway market: the country a Korean title shows up in before it shows up anywhere else. The answer was that there is not one. Among the 170 Korean titles that reached 20 countries or more on Netflix’s weekly lists, the middle title is already in 16 countries in its first charting week.
So the question changed. Not where does it start but how much of the journey is already over when it starts.
The first week is most of a median title’s map
| Median | |
|---|---|
| Countries reached in the end | 43 |
| Countries in the first week | 14 |
| Share of the footprint already there | 40% |
Two fifths of everywhere, in week one. That is a fact about how Netflix charts move, and on its own it would suggest a single pattern: titles land, then top up.
They do not. There are two shapes
| Share of countries reached in week one | Titles | Share |
|---|---|---|
| under 25% | 58 | 34.1% |
| 25–49% | 42 | 24.7% |
| 50–74% | 32 | 18.8% |
| 75% or more | 38 | 22.4% |
The two ends are nearly the same size. 58 titles built their footprint over weeks; 38 had it almost immediately. The median of 40% sits between two groups and describes neither of them — which is what a median does when the thing underneath is not one thing.
Built week by week
| Title | Countries | In week one | Share | First week | Started in |
|---|---|---|---|---|---|
| Ballerina | 89 | 1 | 1.1% | 2021-10-24 | New Zealand |
| Black Knight | 79 | 1 | 1.3% | 2021-08-01 | Bahrain |
| Happy Ending | 47 | 1 | 2.1% | 2022-11-27 | Thailand |
| Land | 43 | 1 | 2.3% | 2023-01-01 | Turkey |
| Sweet Home | 42 | 1 | 2.4% | 2023-11-12 | Thailand |
Ballerina charted in one country and ended up in 89. Nothing about that first country looks like a launchpad — New Zealand, Bahrain, Turkey are not where a Korean title is usually seeded, and no two of these five started in the same place.
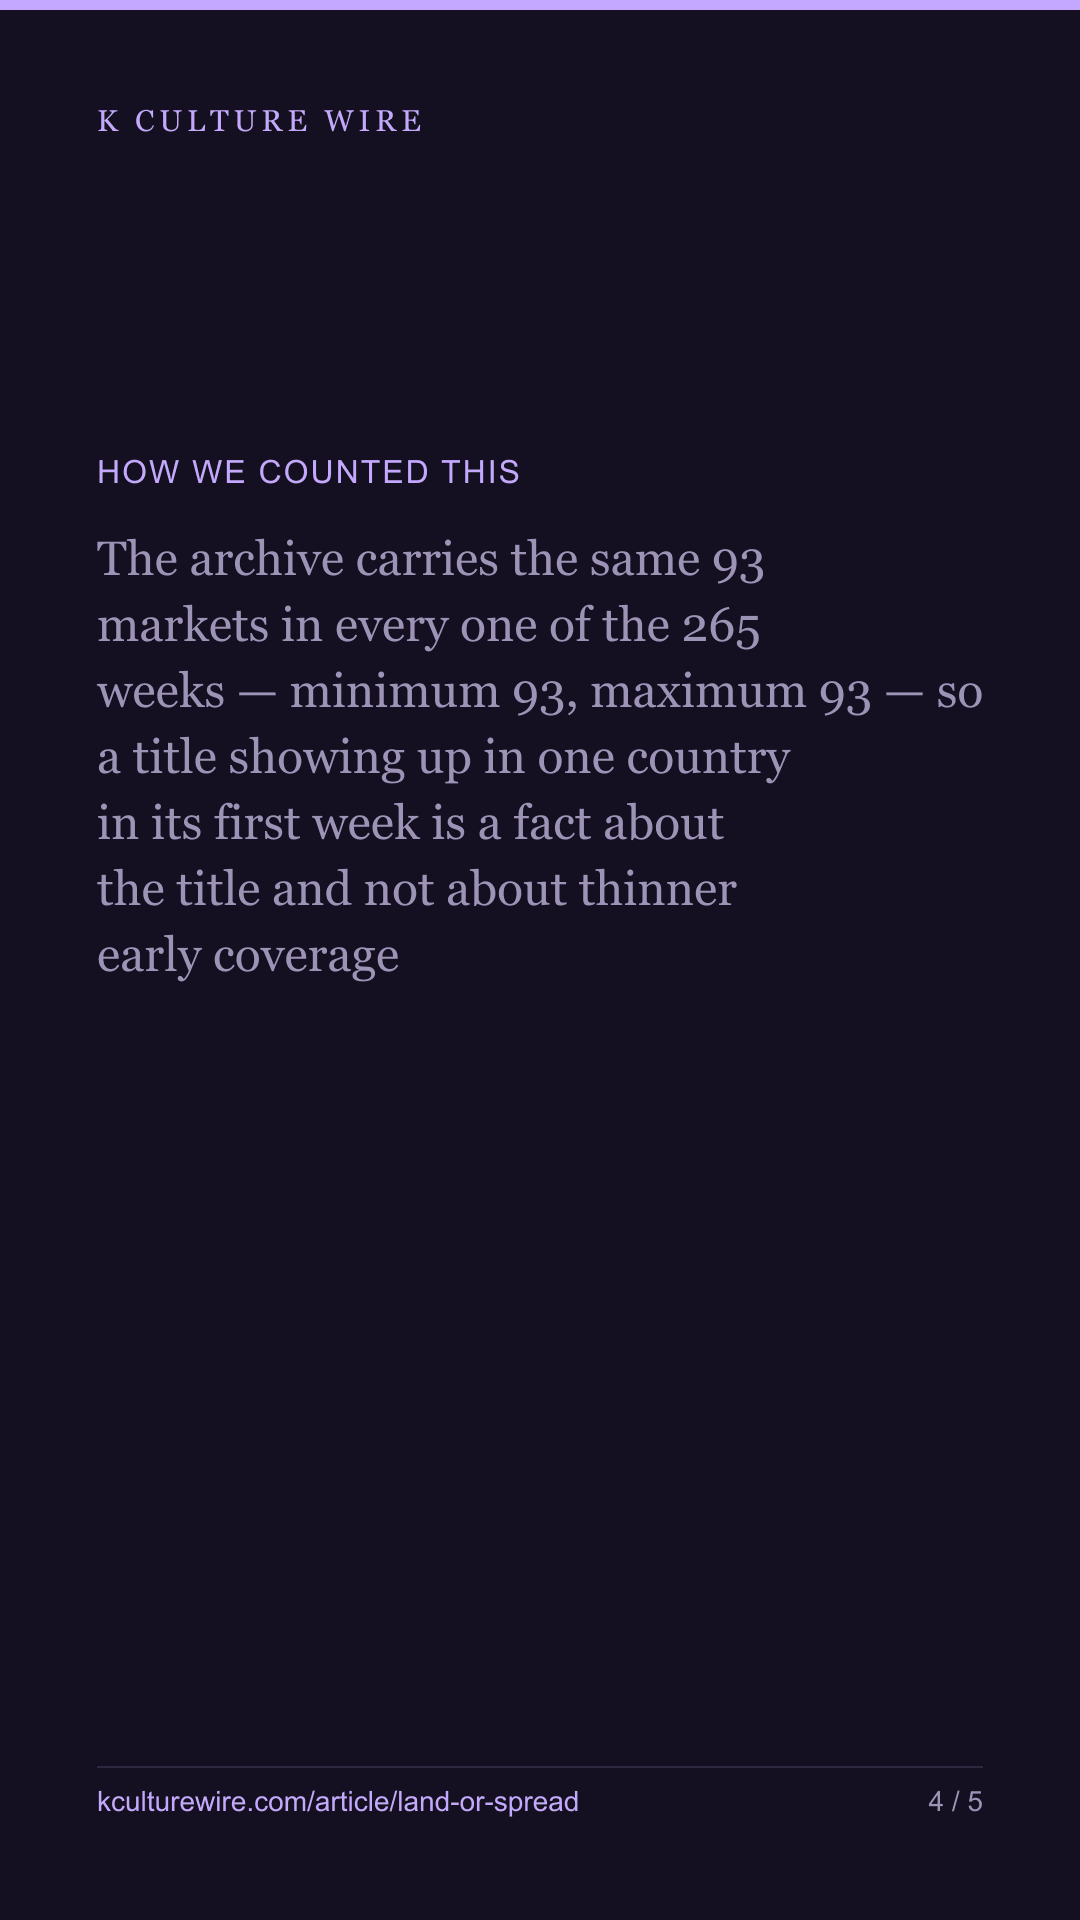
An obvious objection is that our archive might simply have carried fewer countries in the early weeks, making an old title look like it began alone. It did not: the archive holds the same 93 markets in every one of the 268 weeks, minimum 93 and maximum 93. A one-country first week is a fact about the title.
Everywhere at once
| Title | Countries | In week one | Share | First week |
|---|---|---|---|---|
| Humint | 67 | 67 | 100% | 2026-04-05 |
| Outlaw | 53 | 53 | 100% | 2024-09-15 |
| Dynamite Kiss | 52 | 52 | 100% | 2025-11-16 |
| Physical: Asia | 44 | 44 | 100% | 2025-11-02 |
| Last Knights | 20 | 20 | 100% | 2022-07-03 |
| The Devil’s Plan | 23 | 23 | 100% | 2023-10-01 |
These titles never added a country after week one. Every market they were ever going to reach was reached in the same seven days.
Films land; series accumulate
Across the 55 films in this set the first week holds a median 50.8% of the eventual footprint. Across the 115 series it is 38.1%. A film has one week to be found. A series can pick up a market in its third week, and often does.
What this changes for someone shipping a title
If a catalogue is mostly films, the marketing question is are all the markets ready on the same day, because a film that misses week one has largely missed. If it is mostly series, the first week is a start rather than a verdict, and a market that stays quiet for a fortnight has not yet said no.
The dangerous move is to plan against the median. 40% is a number no title in this set behaves like. The full band table, both tails, and the format split are on the arrival table. Whether a title’s run at home says anything about any of this is a separate question, and we measured that too: the home-and-abroad table.
What this does not say: when Netflix released anything. We see the week a title appears on a country’s top 10, which is not the week it became available there. A title released everywhere on one day can still take a month to chart in half of those countries — and that gap is exactly what the table above is measuring.
What changed on 3 September 2026
Every figure in this piece was recounted against a rebuilt Korean title list, and this piece had a second problem of its own: its summary line and its opening paragraph disagreed with each other. The summary said 165 titles, the first paragraph said 173. Neither was the count. Both now read 170, which is what the data holds.
| Was | Now | |
|---|---|---|
| Titles that reached 20+ countries | 165 or 173, depending on the paragraph | 170 |
| Countries in the first week (median) | 16 | 14 |
| Share of the footprint already there | 40.7% | 40% |
| Started under 25% | 58 of them, 33.5% | 58, 34.1% |
| 50–74% band | 35 titles, 20.2% | 32, 18.8% |
| Films / series in the set | 57 / 116 | 55 / 115 |
The shape of the finding is unchanged: the two ends of the distribution are still nearly the same size, and the median still describes neither of them. What changed is that a check now reads every one of these numbers out of the counted data on each build, so a figure cannot sit here disagreeing with the paragraph above it — or with the data — for weeks without the build going red.
Where these numbers come from
Sources
- Netflix — Tudum weekly Top 10 country lists, 2021-07-04 to 2026-07-26 — 265 weeks, 93 markets every week · https://www.netflix.com/tudum/top10
- Wikidata — Country of origin (P495 = Q884) and item numbers, used to decide which chart titles are Korean · https://query.wikidata.org
What we checked
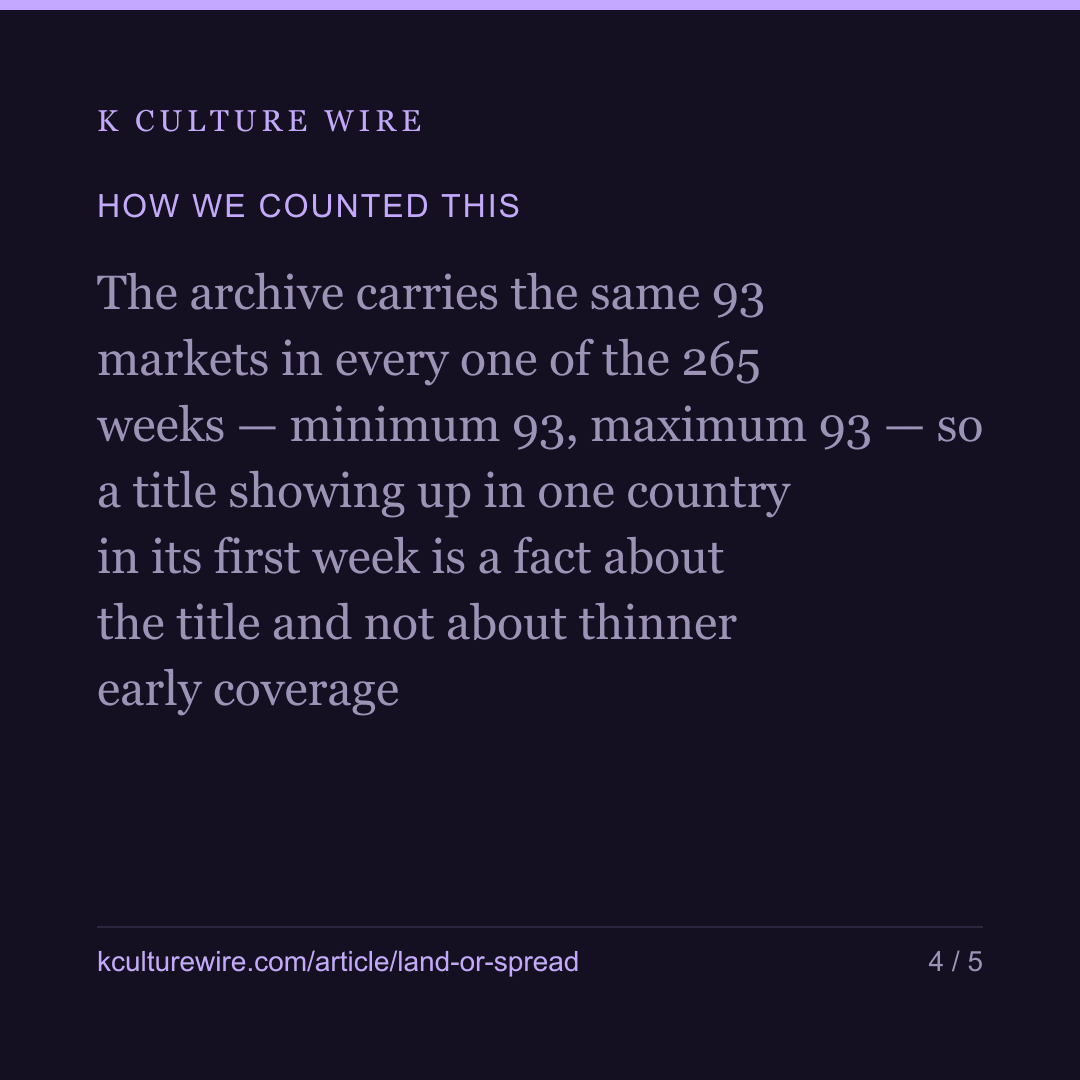
- The archive carries the same 93 markets in every one of the 265 weeks — minimum 93, maximum 93 — so a title showing up in one country in its first week is a fact about the title and not about thinner early coverage
- Titles reaching fewer than 20 countries are excluded from every share, because a first-week share computed on three countries carries no information
- The collector refuses to write its file if any single band holds more than 60% of the titles, because the finding is that there are two shapes and a single crowded band would mean there is only one
- First-week country counts are checked against the named list of those countries, so a count cannot drift from the names printed beside it
What we left out, and why
- Release dates. We see when a title appears on a country's top 10, not when Netflix made it available there, and the piece never treats the two as the same
- Any word for why a title spread. A country can be added because more people started watching or because the titles above it fell away, and we cannot separate those
- Viewing. A top 10 is a rank list; a title outside it is invisible here at any level of watching
- Russia, whose list Netflix stopped publishing in February 2022
- The word gateway. We went looking for one and the data says there is not one — the median travelling title is in 14 countries in the same week
The data behind this
Written from the same data
Take this away — 10 cards
The figures in this article, as images. Free to repost with the address on them.


If you work in this business
Everything on this page is measured from the same weekly Netflix lists, per market and per title. We publish the pages free; what we sell is the same measurement cut to one company's catalogue — including the figures behind /arrival.
What a company sheet contains, and what it cannot tell you →