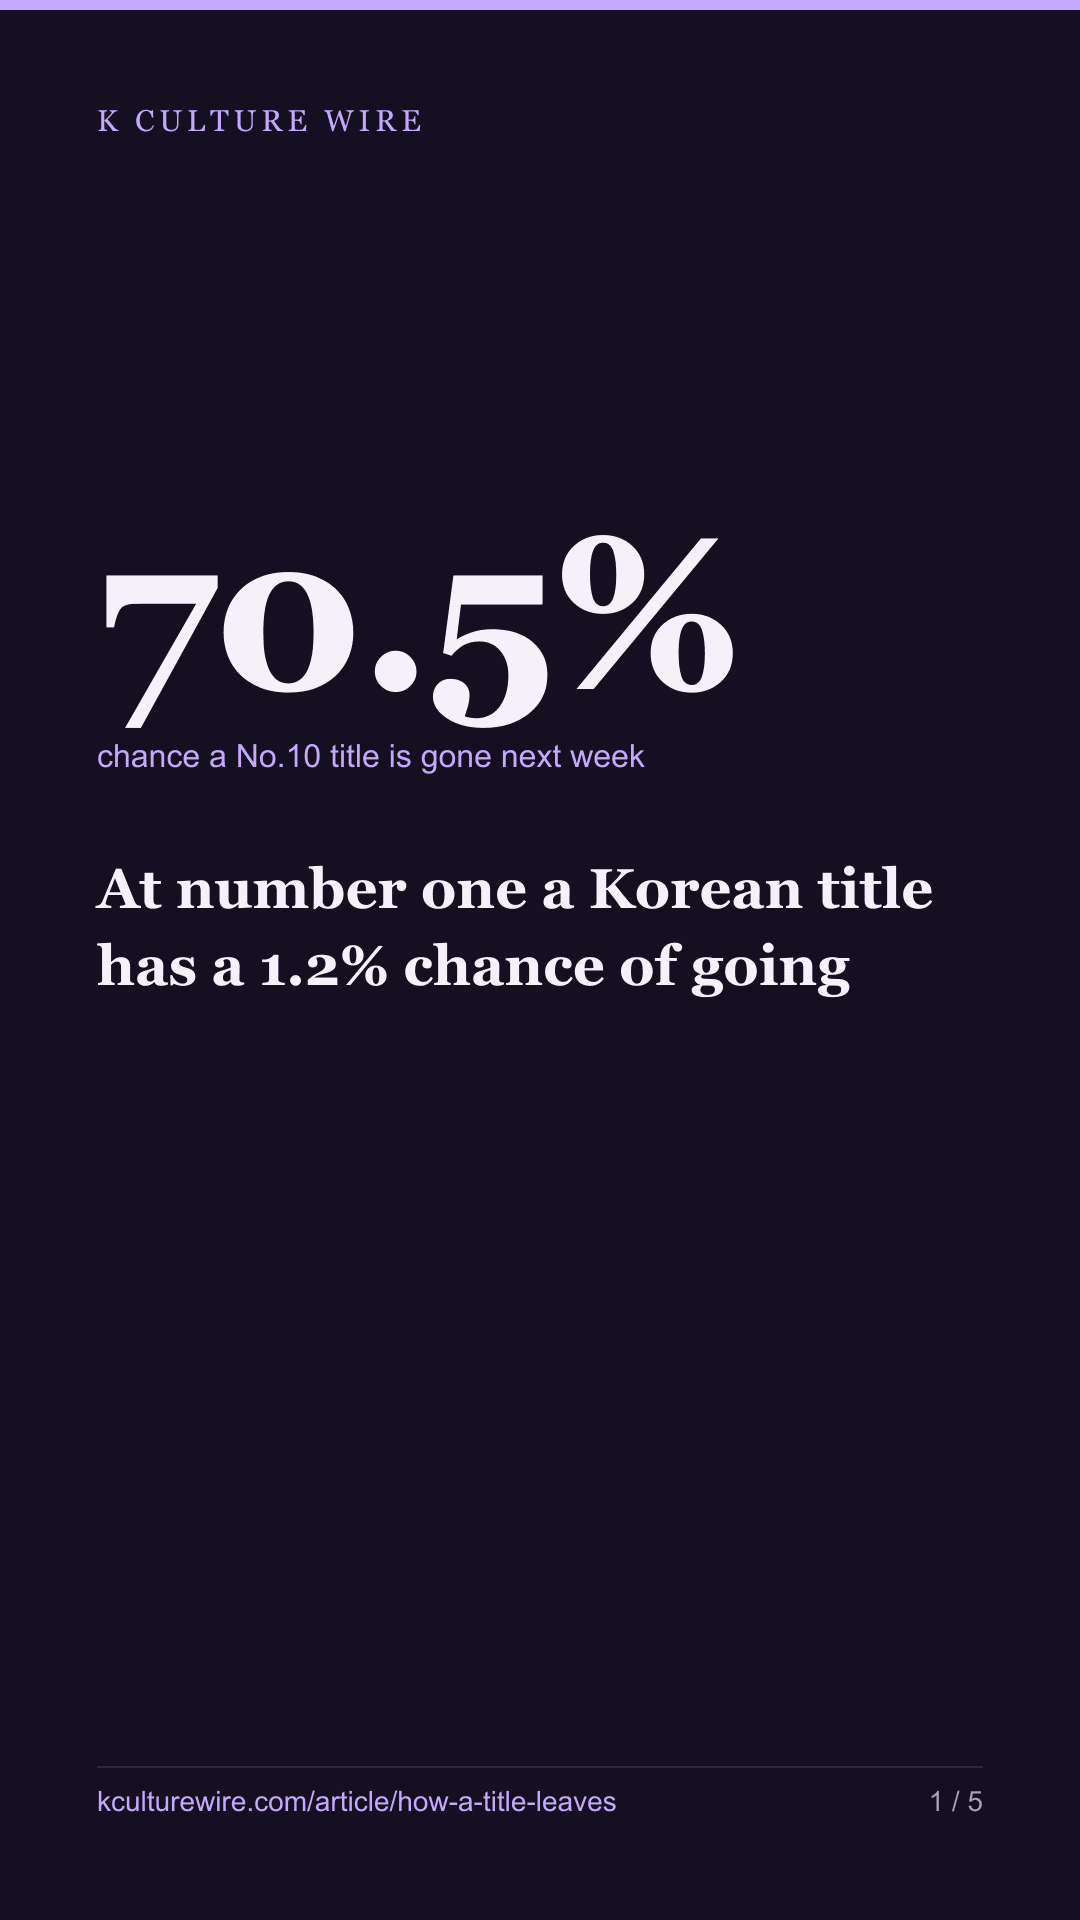
At number one a Korean title has a 1.2% chance of going
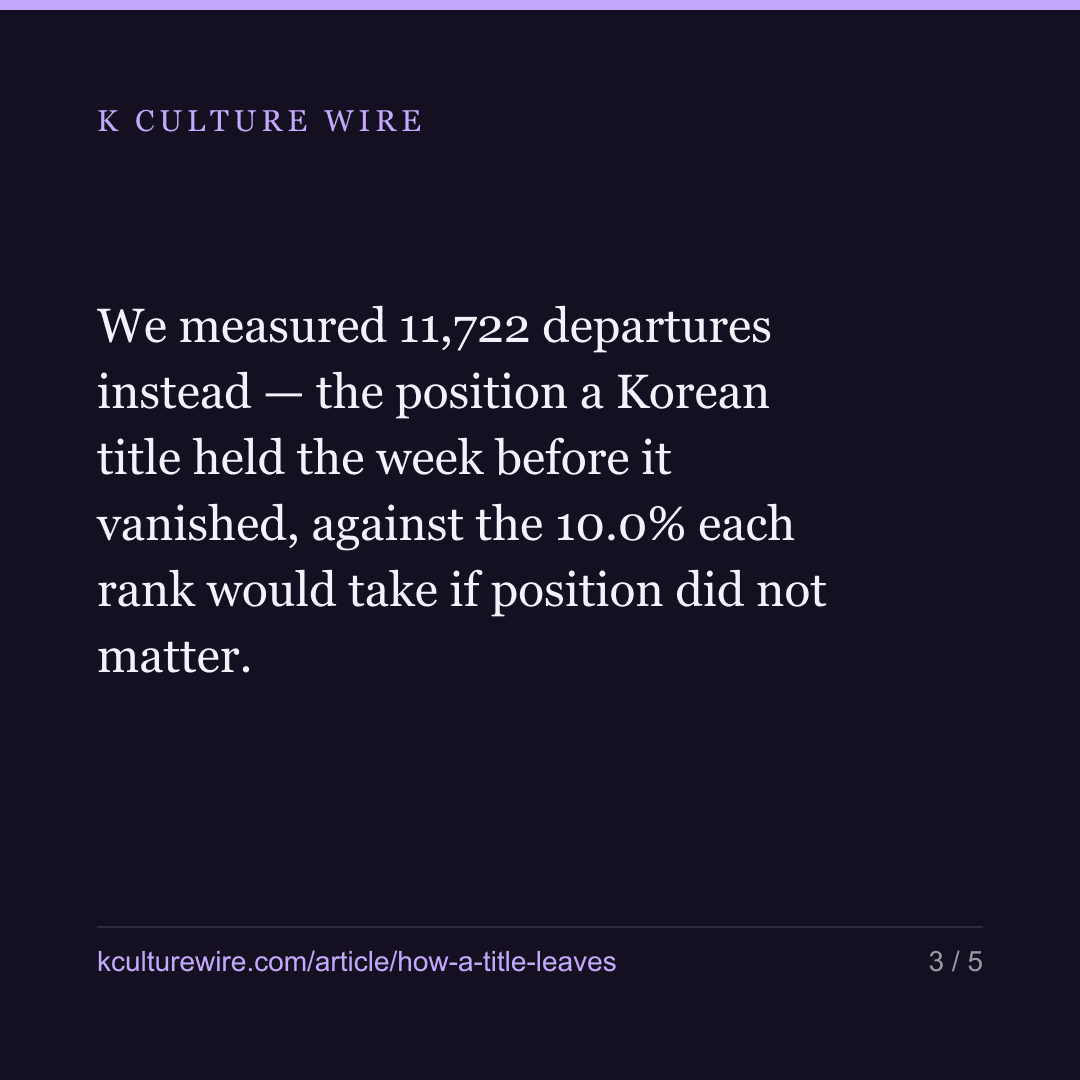
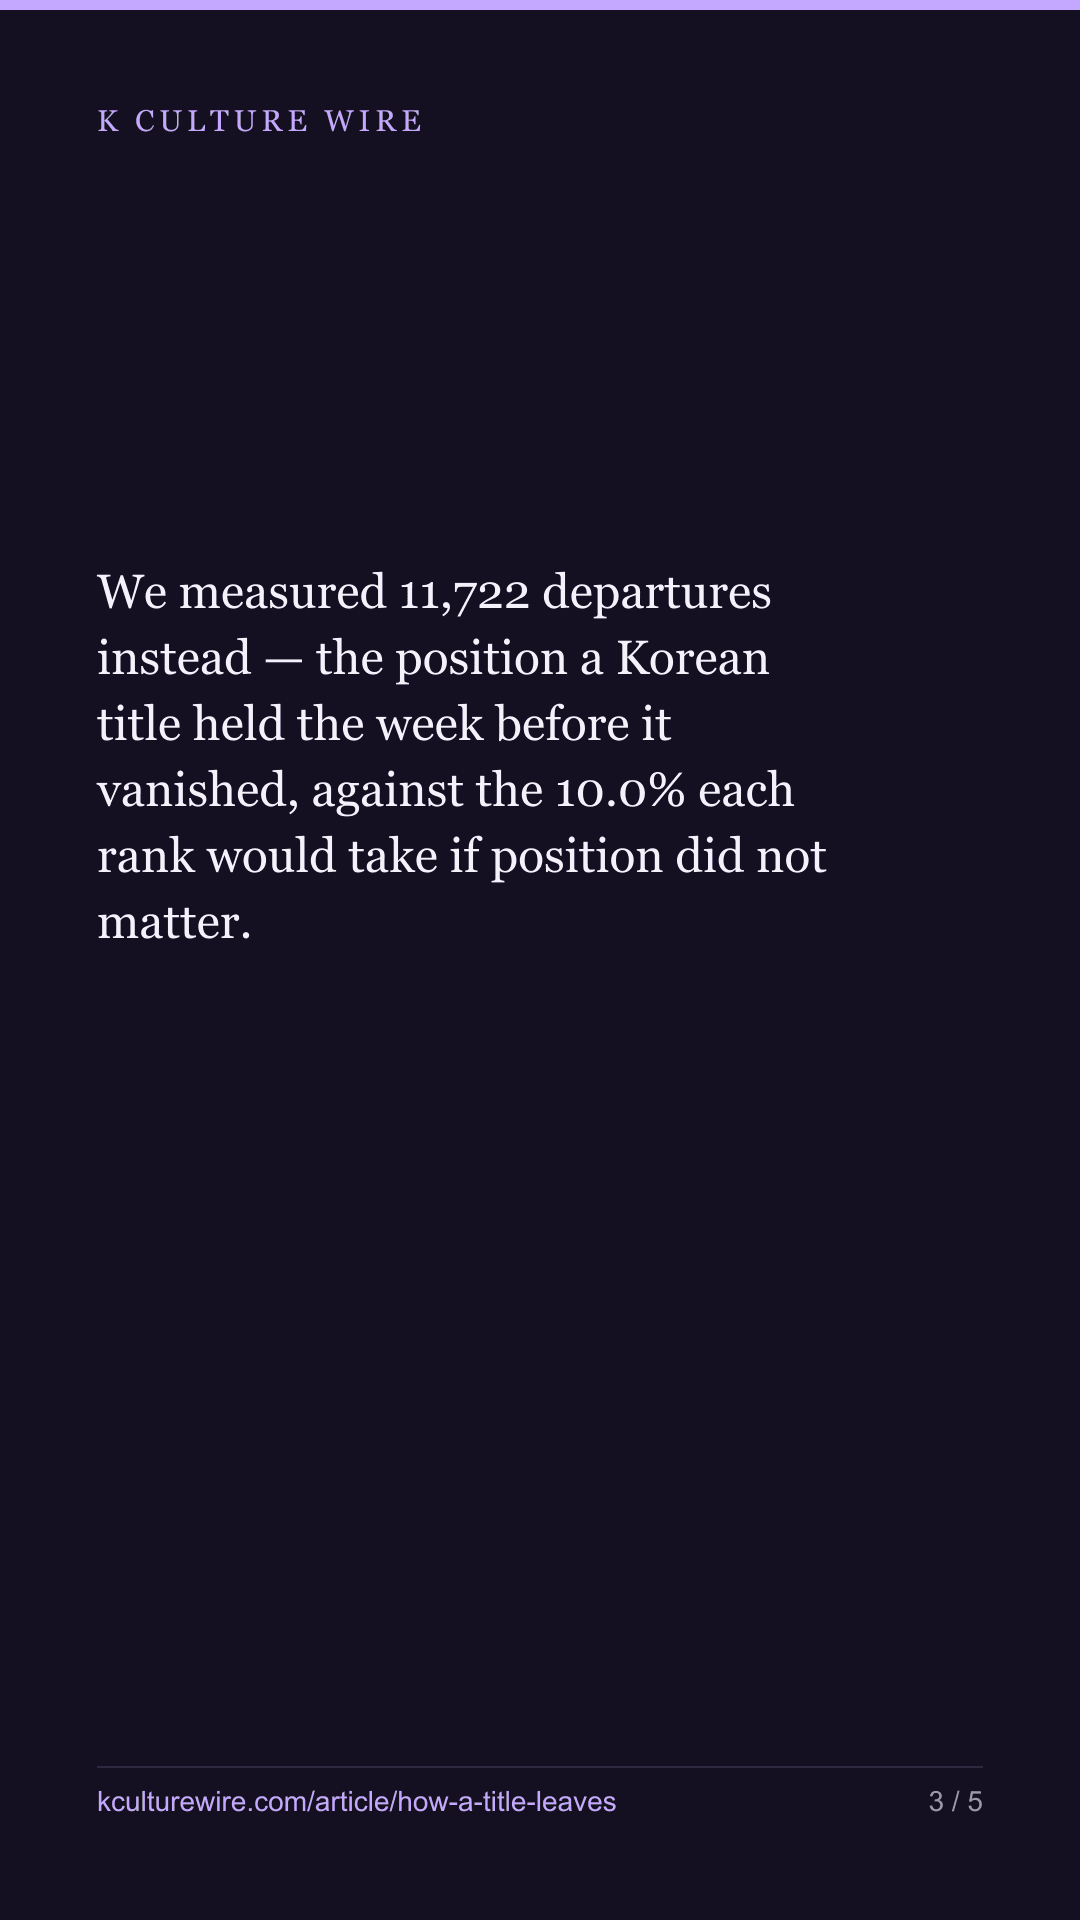
Everything written about a chart is about getting on it. We measured 11,722 departures instead — the position a Korean title held the week before it vanished, against the 10.0% each rank would take if position did not matter.
The table this is written from: /exit
Everything anyone publishes about a chart is about getting onto it. Openings, debuts, how many countries at once, how high it went. We have published several of those ourselves.
Nobody measures the other end. So we did: for every Korean title in every market, what position was it in during the last week before it disappeared? The full table, every position and every market, is at how a title leaves — and the arriving end we have already published at does it arrive in one country or many and is the week it enters its highest.
The chart bottom is a trapdoor. The top is not.
A run is one title in one country across consecutive chart weeks. We found 12,486 of them. Of those, 12,309 ended — the other 177 are still on a chart in the last week we hold, and a run our data outlives has not left, so they are set aside rather than counted.
Take every week a Korean title spent at a given position, and ask what share of those weeks turned out to be its last:
| Position | Chance it is gone next week |
|---|---|
| 1 | 1.3% |
| 2 | 5.3% |
| 3 | 10% |
| 4 | 17.7% |
| 5 | 24.3% |
| 6 | 32.8% |
| 7 | 43.5% |
| 8 | 53.3% |
| 9 | 62.2% |
| 10 | 70.5% |
A title at number one is almost never gone next week. A title at number ten is gone more often than not. Between position 7 and position 8 the run crosses a coin flip.
This is not the same as saying titles decline. It says the bottom of a top 10 is not a low position on a list — it is the edge of the list, and the difference between rank 9 and rank 10 is worth more than the difference between rank 1 and rank 2.
Where departures land, and the comparison that matters
Of the 12,309 departures, 56.4% happened from positions 8, 9 or 10. If leaving had nothing to do with position, that figure would be 30.0%, because every country-week-chart has exactly one place at each rank. Only 5.4% of departures happened from the top three.
There is an obvious objection, and it is the right one: Korean titles might simply sit near the bottom of charts, in which case bottom-heavy departures would follow automatically and mean nothing.
They do not. Korean titles spent 28.7% of their chart weeks in positions 8 to 10 — almost exactly the 30.0% an even spread gives. They sit level; they leave from the bottom.
The same measurement for every title on these charts, Korean or not:
| Korean titles | All titles | |
|---|---|---|
| Departures from positions 8–10 | 56.4% | 51.2% |
| Departures from positions 1–3 | 5.4% | 7.3% |
| Weeks spent in positions 8–10 | 28.7% | 30% |
Korean runs end from the bottom more often than the chart average, and from the top less often. Both groups sit level, so the gap is in how they leave, not where they were. A Korean title on these charts is slightly more likely to slide out and slightly less likely to be pushed out while still ranking well.
Entries look nothing like exits, which is worth stating plainly: 13.6% of Korean runs began at position 10 and 6.8% began at position 1. Getting on a chart is spread across the whole list. Leaving it is not.
Markets differ, and not by quality
Across the 92 markets with at least 40 measured departures, the share leaving from the bottom three runs from 68.4% in Indonesia to 42.9% in Canada.
| Highest | Lowest | ||
|---|---|---|---|
| Argentina | 68.8% | Slovakia | 41.8% |
| Indonesia | 68.3% | Canada | 42.9% |
| Denmark | 65.2% | France | 44.1% |
A market at the top of that list is one where titles slide out of the chart. A market at the bottom is one where titles are pushed out while still ranking well — which is what happens where the chart turns over quickly and something new arrives before the old title has finished falling.
Neither is a better market. They are different rates of replacement, and a plan built for one will be wrong in the other: in Argentina an extra week of visibility is bought by holding position, and in Slovakia it is bought by whatever is not arriving that week.
What this cannot tell you
A departure from a top 10 is not a departure from Netflix. A title leaving from position 10 may have lost almost no viewing; a title pushed out at position 3 may have lost none at all. Netflix publishes no viewing figures for country charts, so nothing here measures how many people watched anything.
It also cannot tell you why any single run ended. A new release, a holiday, a marketing push somewhere else and a change in how Netflix ranks all look identical in a rank table.
And one correction to our own method, made before publishing. The first version of this count keyed each run by country and title, which quietly merged two seasons of the same show when both held places in the same week — Netflix lists them separately, and they are separate runs. It lost 25,987 rows. We caught it because the positions we had read came out at 9.28% to 10.56% instead of 10.0% each, which is impossible if a chart is read correctly. The collector now refuses to publish unless that figure comes out flat, and it does.
What changed on 3 September 2026
Our list of Korean titles had been frozen at 8 August. We rebuilt it, it went from 397 titles to 420, and one title we had been counting as Korean (Dangerous Liaisons, the 2022 French film) is not. 18 figures in this piece moved with it. None of them changed what the piece found. The ones a reader is most likely to have quoted:
| Was | Now | |
|---|---|---|
| Runs read | 12,698 | 12,486 |
| Runs that ended | 12,521 | 12,309 |
| Chance a No.10 title is gone next week | 70.7% | 70.5% |
| Runs that began at No.1 | 6.7% | 6.8% |
Every table above is now generated from the counted file rather than typed out, and a check reads each figure back out of that file on every build. We print what moved rather than swapping it quietly: one wrong number makes the correct ones beside it worth doubting.
Where these numbers come from
Sources
- Netflix — Tudum weekly Top 10 country lists, 493,600 rows read, 2021-07-04 to 2026-07-26, 93 markets, Russia excluded · https://www.netflix.com/tudum/top10
- Wikidata — Korean titles identified by item number and country of origin, using the same single rule as the rest of this publication · https://query.wikidata.org
What we checked
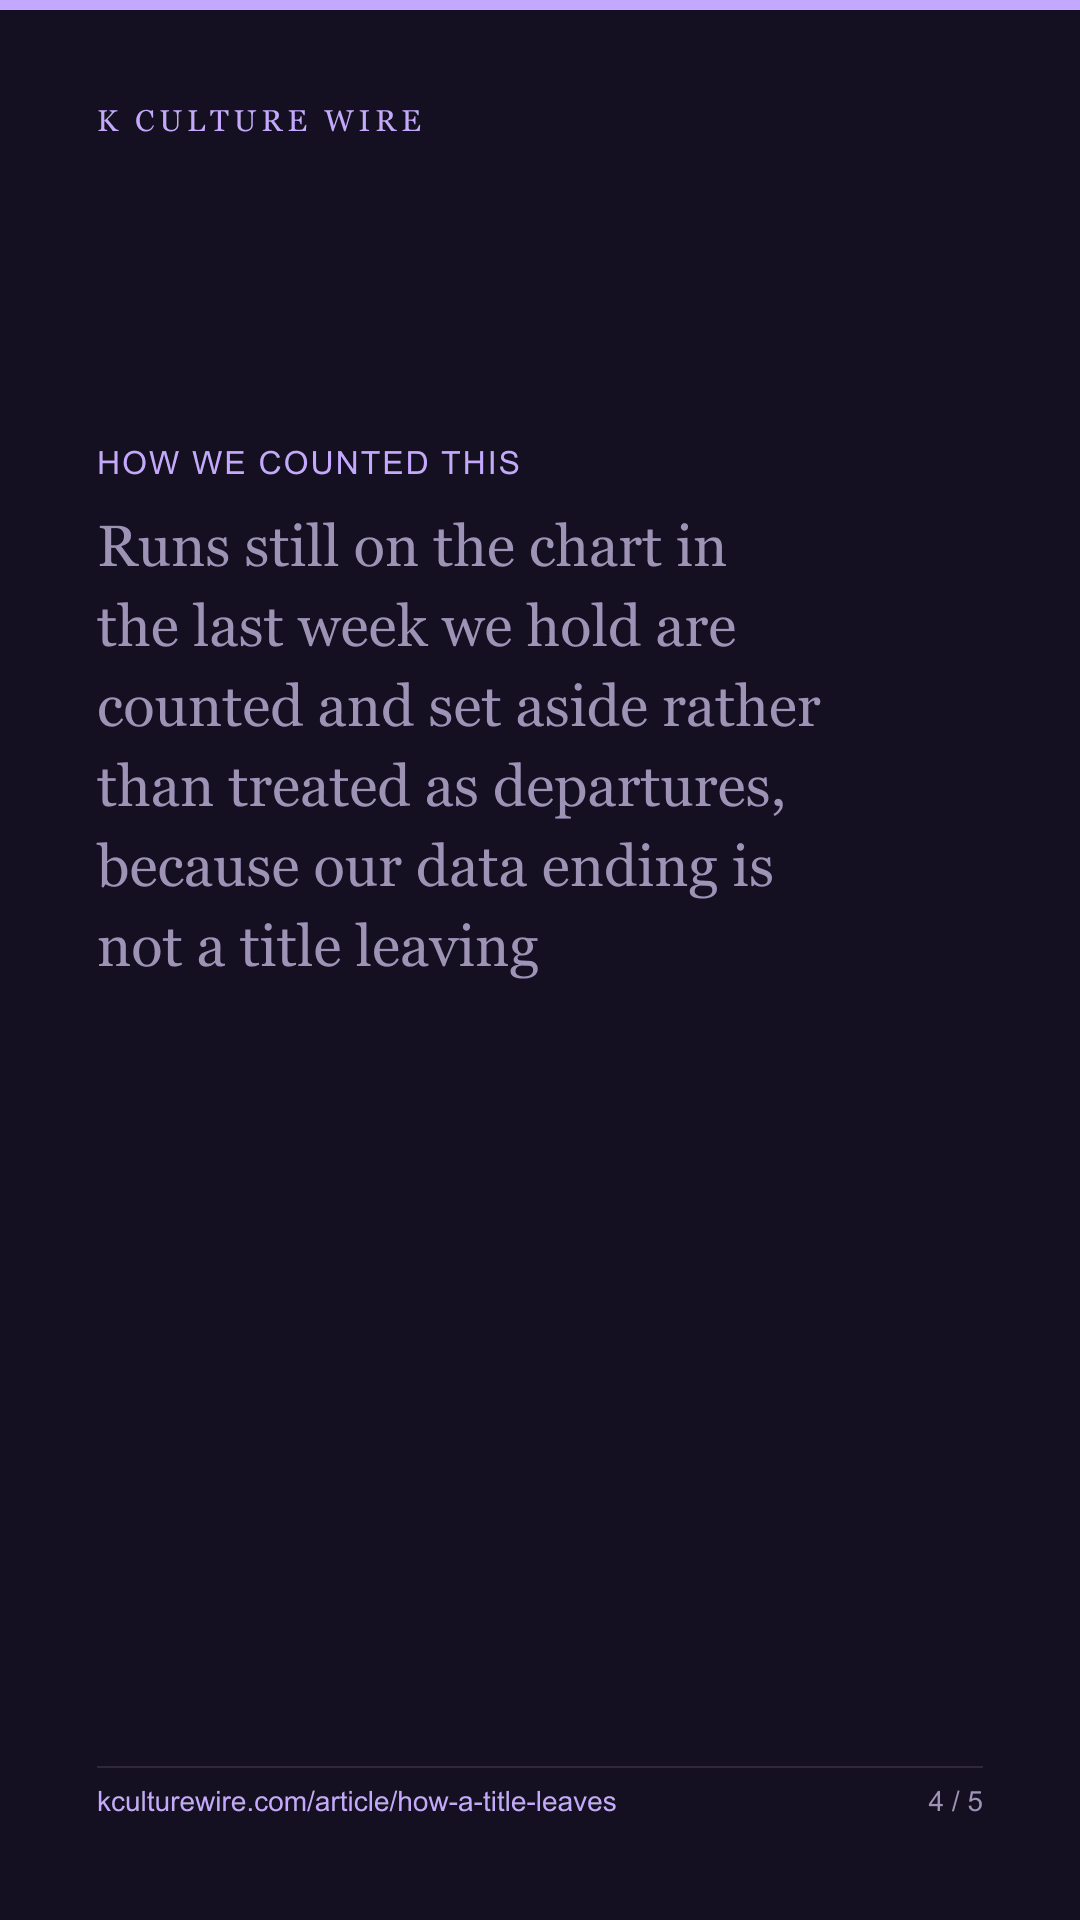
- Runs still on the chart in the last week we hold are counted and set aside rather than treated as departures, because our data ending is not a title leaving
- A gap in a run is measured against the weeks that country's chart actually has, so a market missing a week is not read as a title disappearing and returning
- Every rank from 1 to 10 holds exactly one place per country-week-chart, so the collector refuses to write unless the positions it read come out at 10.0% each — that check caught a real error before publication
- Korean titles are compared against the positions their own weeks occupied, not only against an even split, because a group that sits low would produce bottom-heavy departures for that reason alone
What we left out, and why
- Russia, excluded across this publication because Netflix withdrew and the remaining weeks are not comparable
- Markets with fewer than 40 measured departures, which cannot support a distribution
The data behind this
Written from the same data
Take this away — 10 cards
The figures in this article, as images. Free to repost with the address on them.




If you work in this business
Everything on this page is measured from the same weekly Netflix lists, per market and per title. We publish the pages free; what we sell is the same measurement cut to one company's catalogue — including the figures behind /exit.
What a company sheet contains, and what it cannot tell you →