Actors with 5 charting titles are read 7x more
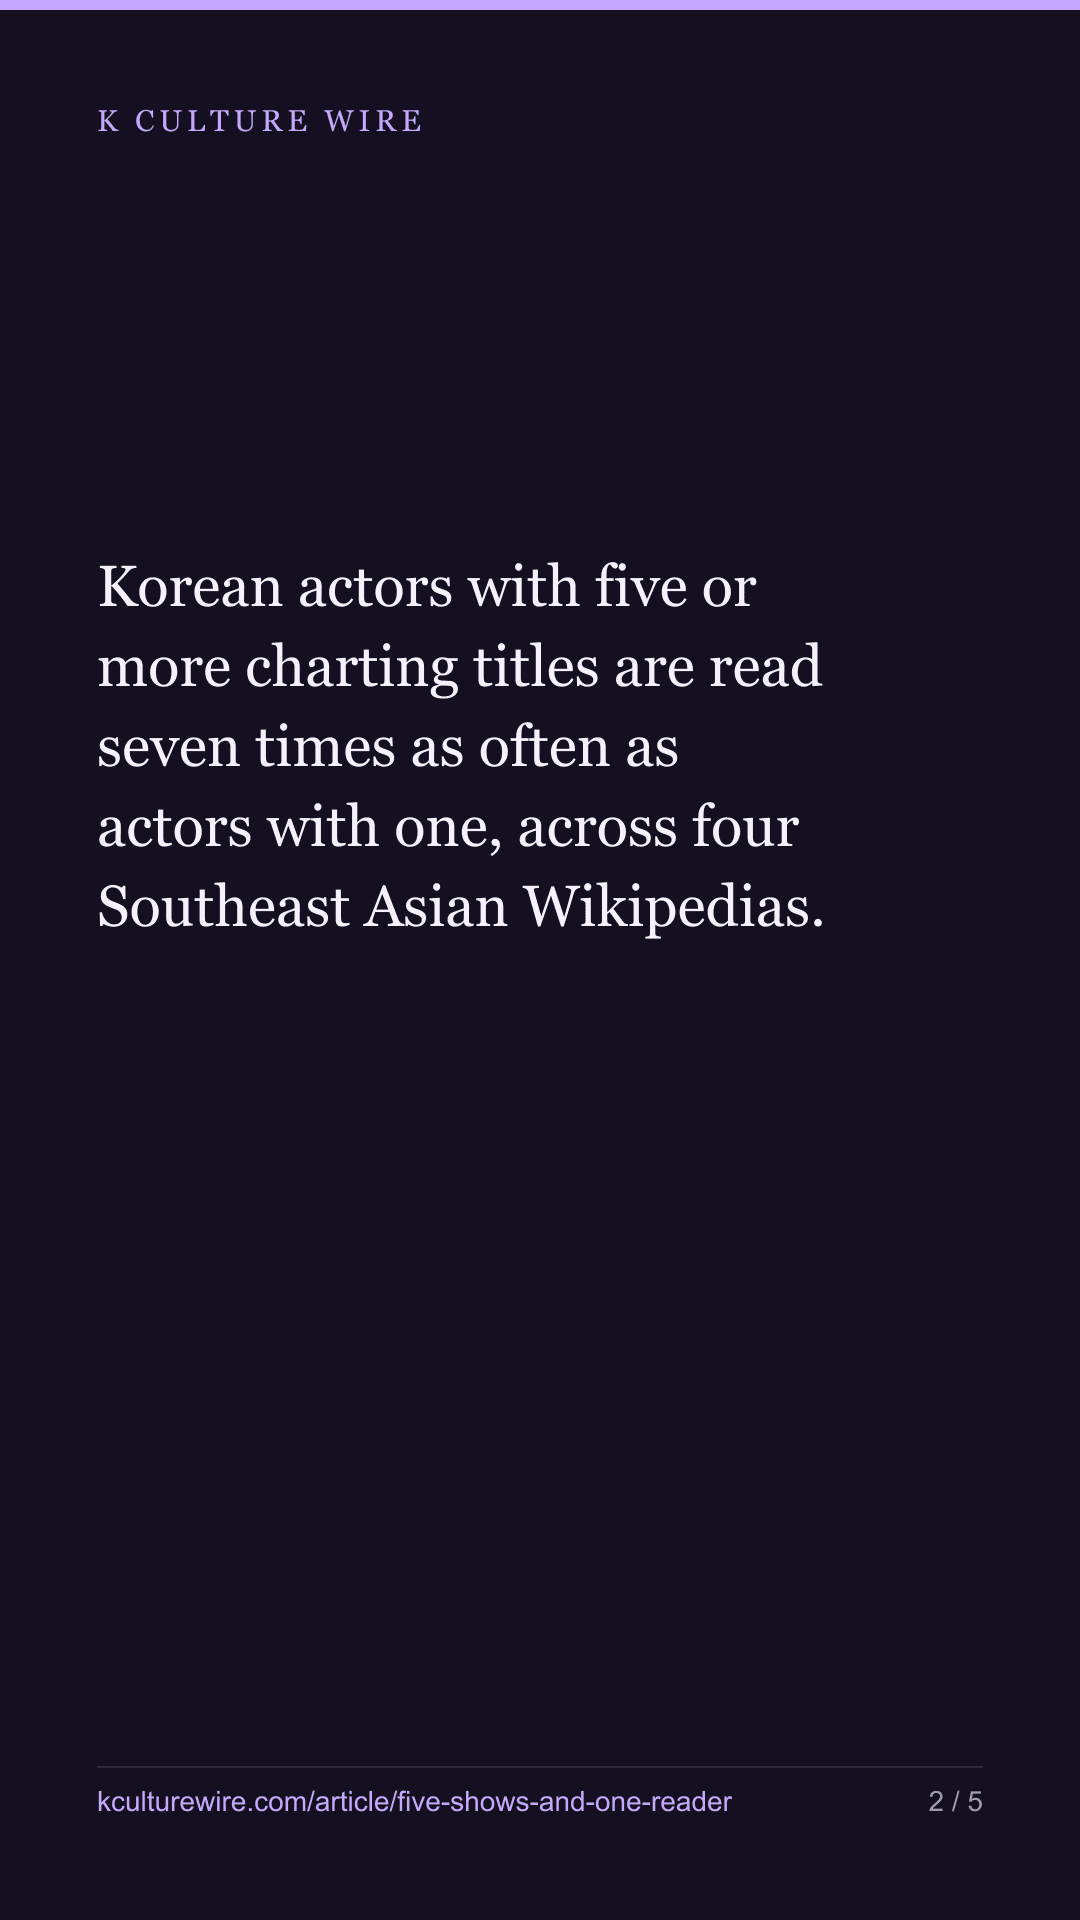
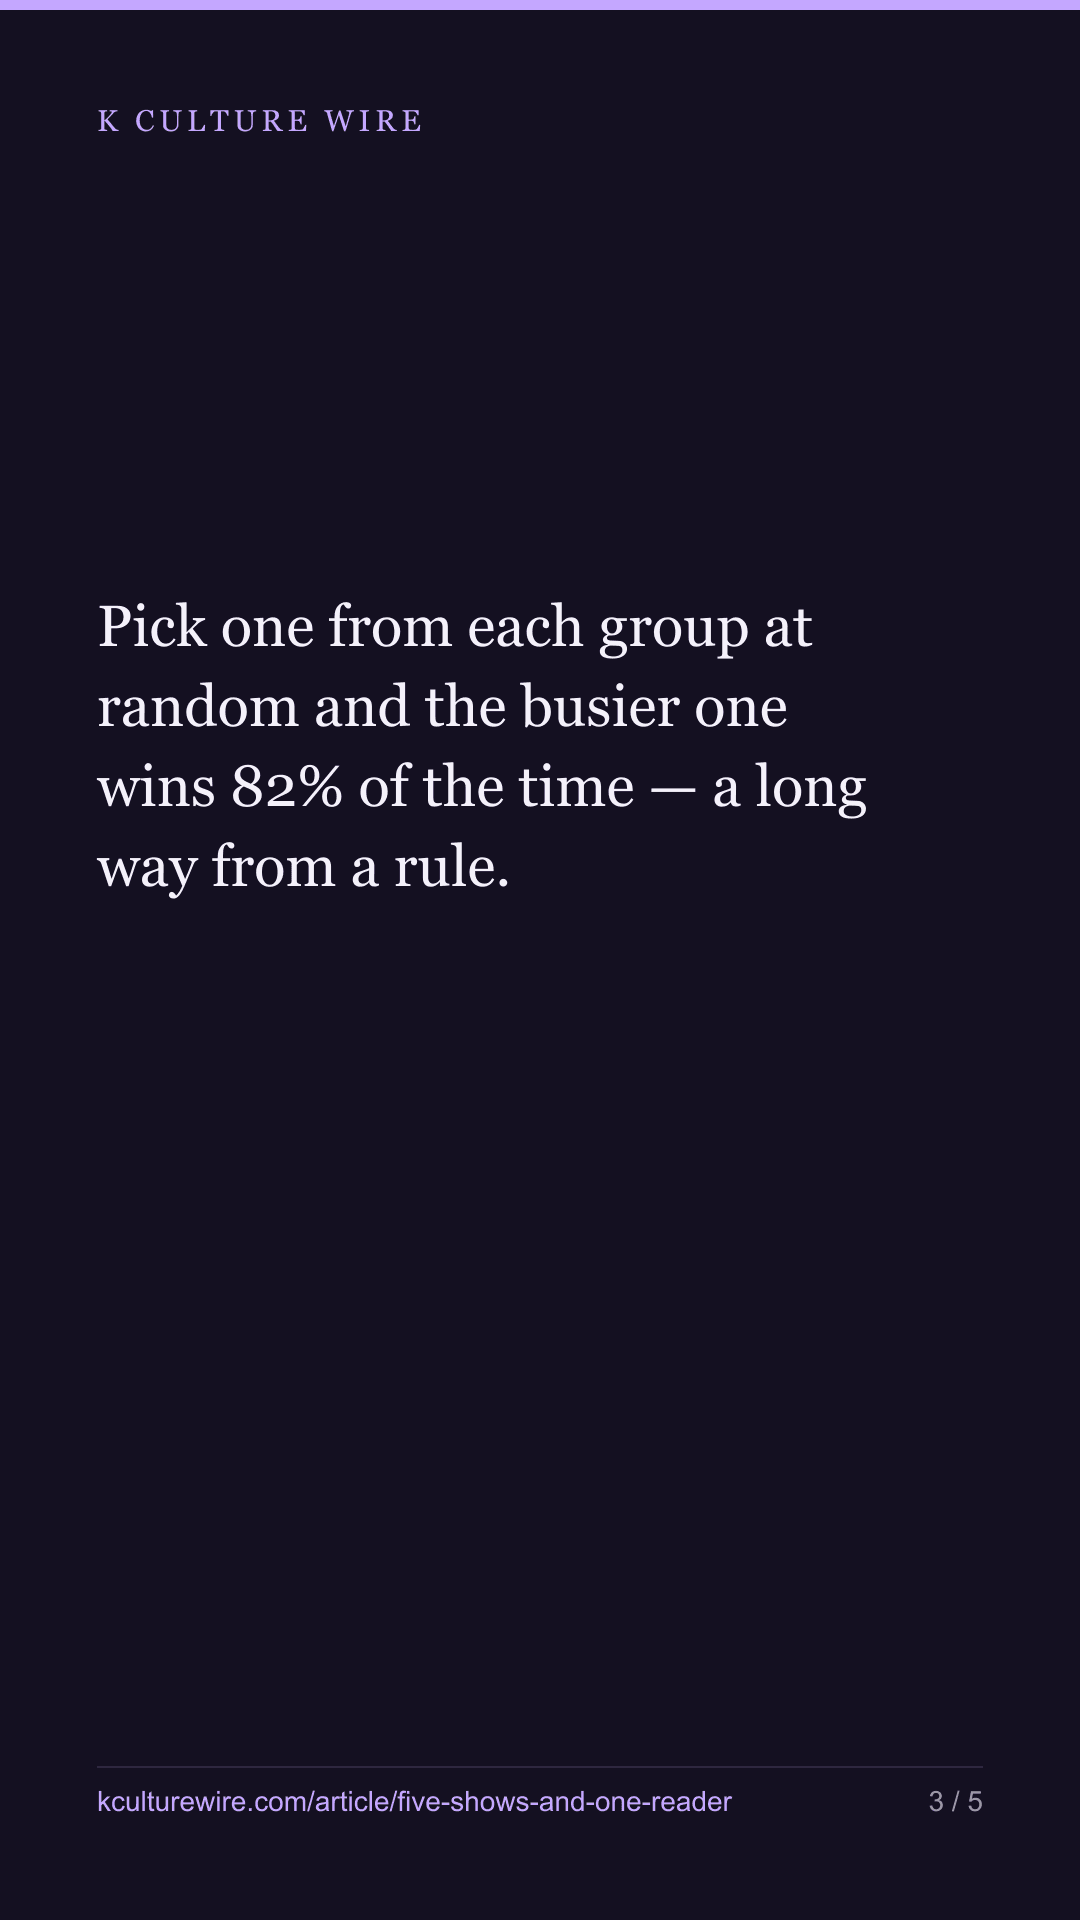
Korean actors with five or more charting titles are read seven times as often as actors with one, across four Southeast Asian Wikipedias. Pick one from each group at random and the busier one wins 82% of the time — a long way from a rule.
The table this is written from: /works-and-readers
Take a Korean actor who has been in one show that reached a Netflix country chart. Now take one who has been in five or more. Across the Indonesian, Vietnamese, Thai and Malay Wikipedias, the second is read about seven times as often as the first.
That is a real number and it is not the interesting one.
The ladder
We can measure 1,023 Korean actors this way. Sorted by how many of their titles reached a chart, the middle of each group looks like this, counted on the Indonesian Wikipedia as reads per million reads of that edition:
| Charting titles | Actors | Median reads per million |
|---|---|---|
| One | 398 | 0.81 |
| Two | 206 | 1.47 |
| Three or four | 227 | 2.83 |
| Five or more | 192 | 5.75 |
Every step goes up. Nothing is skipped, nothing doubles back. From end to end it is 7.1 times.
The number underneath it
A median describes a group. Almost every question a reader actually has is about a person — this actor, that one — and those are different sizes of question. So we measured the second one directly.
Pick one actor at random from the top group and one at random from the bottom group. How often is the busier actor the more-read one?
81.8 per cent of the time.
Fifty per cent would mean the groups tell you nothing at all about an individual. A hundred would mean every actor with five titles outreads every actor with one. Eighty-two is neither. It is better than a coin and nowhere near a rule, and it is the honest translation of “seven times” into a sentence about one person.
This figure has a name and a history. It is the common-language effect size, proposed by McGraw and Wong in 1992 for exactly this problem — that group differences get reported in units nobody can picture. It is the Mann-Whitney U statistic, from 1947, divided by the number of pairs. We computed it twice by different routes, once from ranks and once by counting every pair, and made the agreement between the two a condition of publishing.
Where the overlap lives
Of the 390 actors with a single charting title, 43 — better than one in ten — are read more than the median actor with five or more. Going the other way, 17 of the 192 actors with five or more are read less than the median actor with one.
The busiest actors are not even the ceiling. On the edition we count here, the highest single figure — 79.66 reads per million — belongs to an actor with three or four charting titles, not to anyone in the top group.
What we had to take out first
The obvious way to measure this is to add up an actor’s reads across all four Wikipedias. We did, and it gave a bigger answer: 9.99 times rather than 7.1.
The bigger answer is partly an artefact. That sum only includes editions that have an article about the actor, and actors with more titles have articles in more editions — 14.1 per cent of the one-title group has all four, against 31.8 per cent of the top group. So part of what the raw figure measures is not how much people read but how many articles exist to be read.
Counting a single edition holds that constant. The ladder survives it, smaller: 7.1 times instead of 9.99. We published the smaller number.
There is another way to handle this, and we decided against it. You could compare only actors who have an article in all four editions, matching the groups on coverage. But having four articles is a consequence of being read, not a fact fixed in advance, so selecting on it changes who is in each group — the problem epidemiologists call a collider. The coverage figures are on the page so you can see them. No median is drawn from them.
Which way does it run
We do not know.
More charting titles could bring more readers. Being read could be what gets an actor cast again. An agency, a network, or one breakout year could be driving both at once. All three would produce the table above, and nothing we measured separates them.
There is a limit built into the panel, too. These are the casts of Korean titles that reached a Netflix country chart, so an actor whose work never charted is not here at all, and “number of charting titles” is capped by what Netflix publishes. And the pair probability is built from ranks: it says how often the busier actor wins, and nothing about by how much.
We have measured the neighbouring question before — whether a title travelling to more countries goes with more lookups. It came out at about three times, with the same limit on direction.
The table and the workings are on how much a second role tells you.
Where these numbers come from
Sources
- Wikimedia — Pageviews API, human traffic only, monthly, per edition · https://wikimedia.org/api/rest_v1/
- Wikidata — Cast credits (P161) and citizenship (P27), CC0 · https://www.wikidata.org/
What we checked
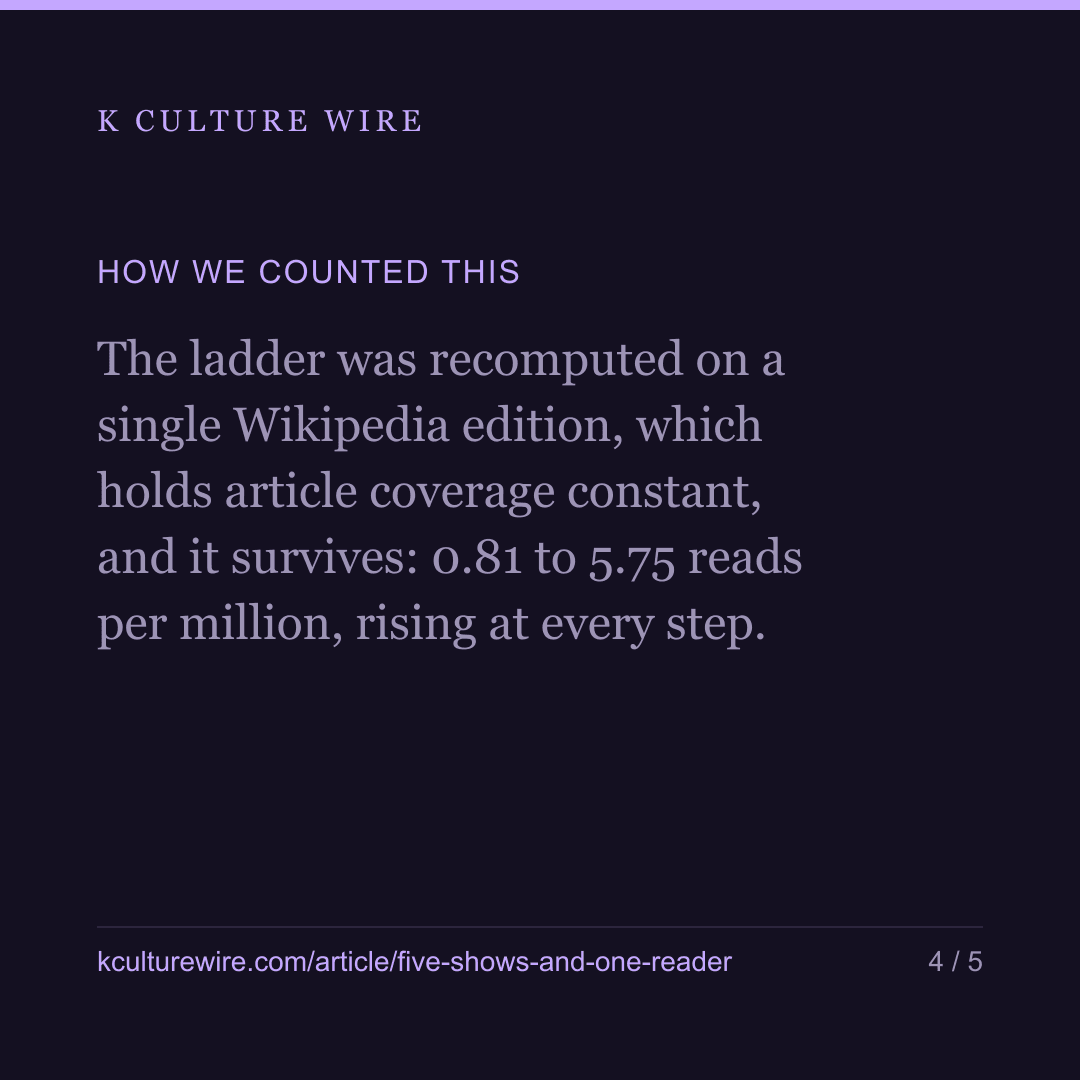
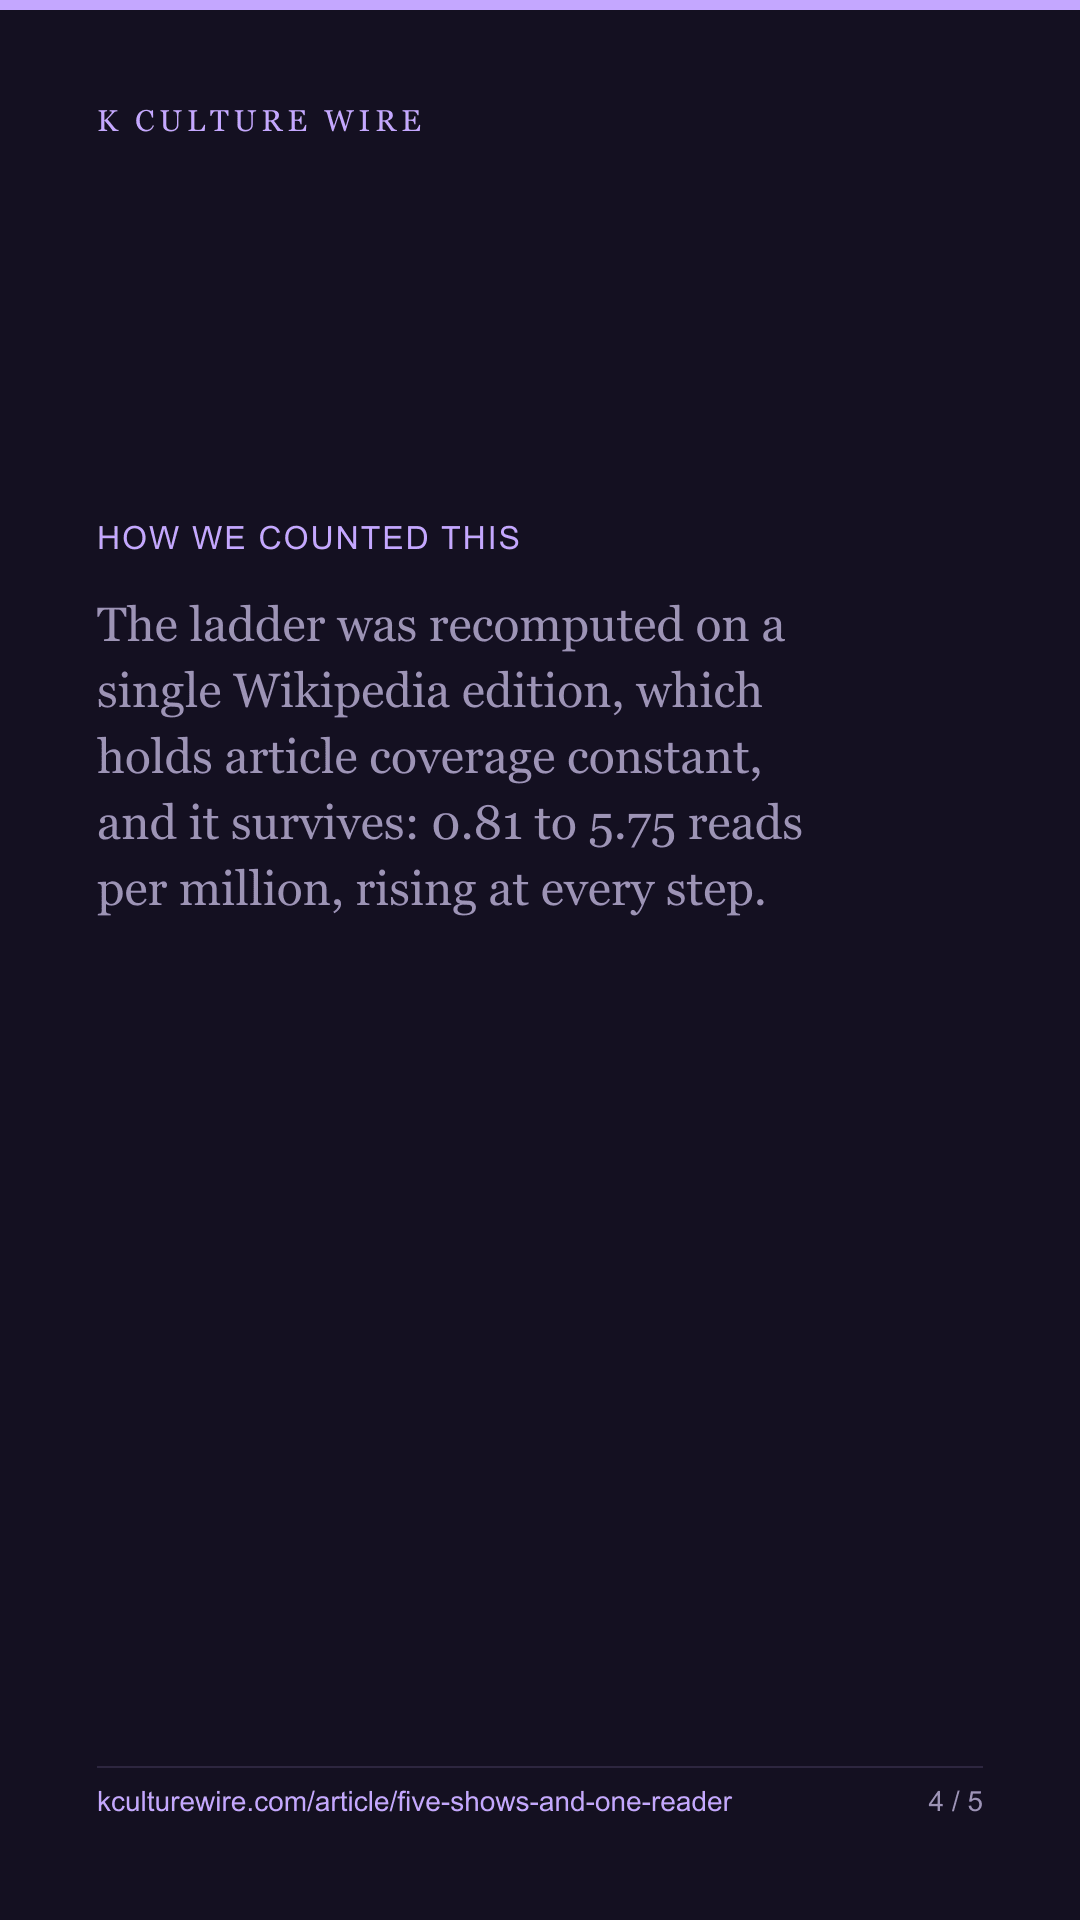
- The ladder was recomputed on a single Wikipedia edition, which holds article coverage constant, and it survives: 0.81 to 5.75 reads per million, rising at every step.
- The pair probability was computed twice by different routes — from ranks (Mann-Whitney U) and by counting all pairs — and the two agree to four decimal places.
- Every band median was tested by removing each actor in turn; none moved by more than 2% of its own size.
The data behind this
Written from the same data
Take this away — 10 cards
The figures in this article, as images. Free to repost with the address on them.





If you work in this business
Everything on this page is measured from the same weekly Netflix lists, per market and per title. We publish the pages free; what we sell is the same measurement cut to one company's catalogue — including the figures behind /works-and-readers.
What a company sheet contains, and what it cannot tell you →