What a chart position does not say about Korean titles
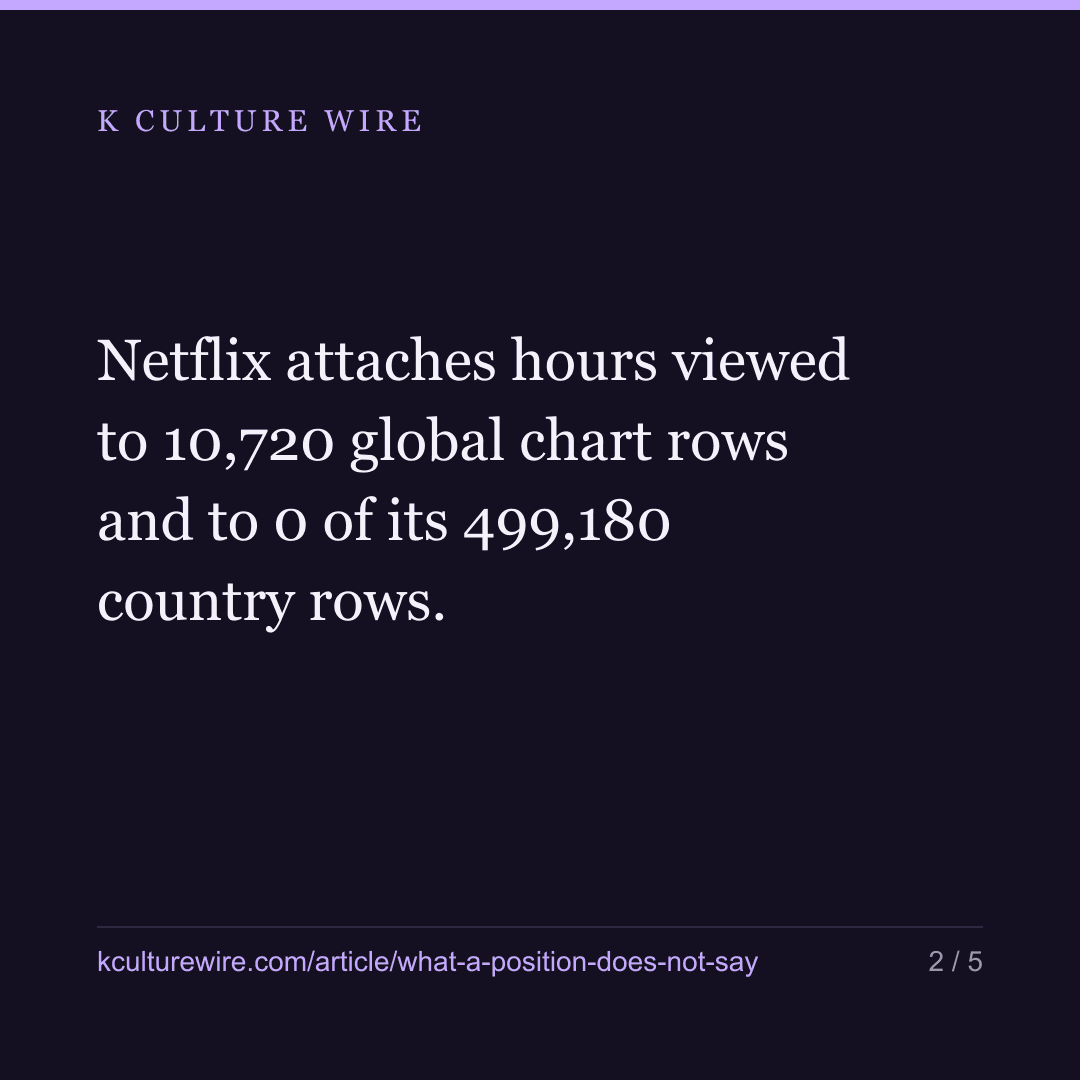
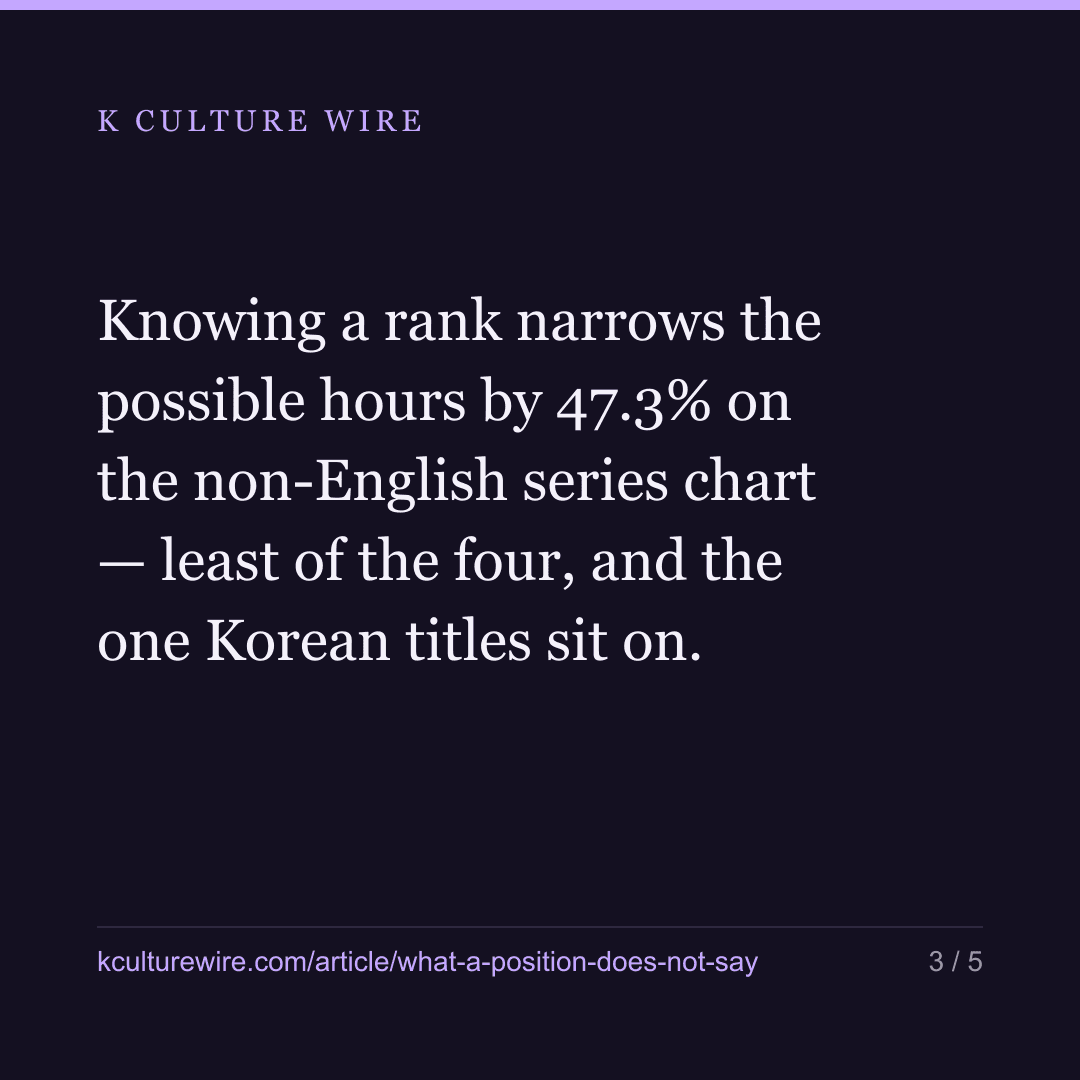
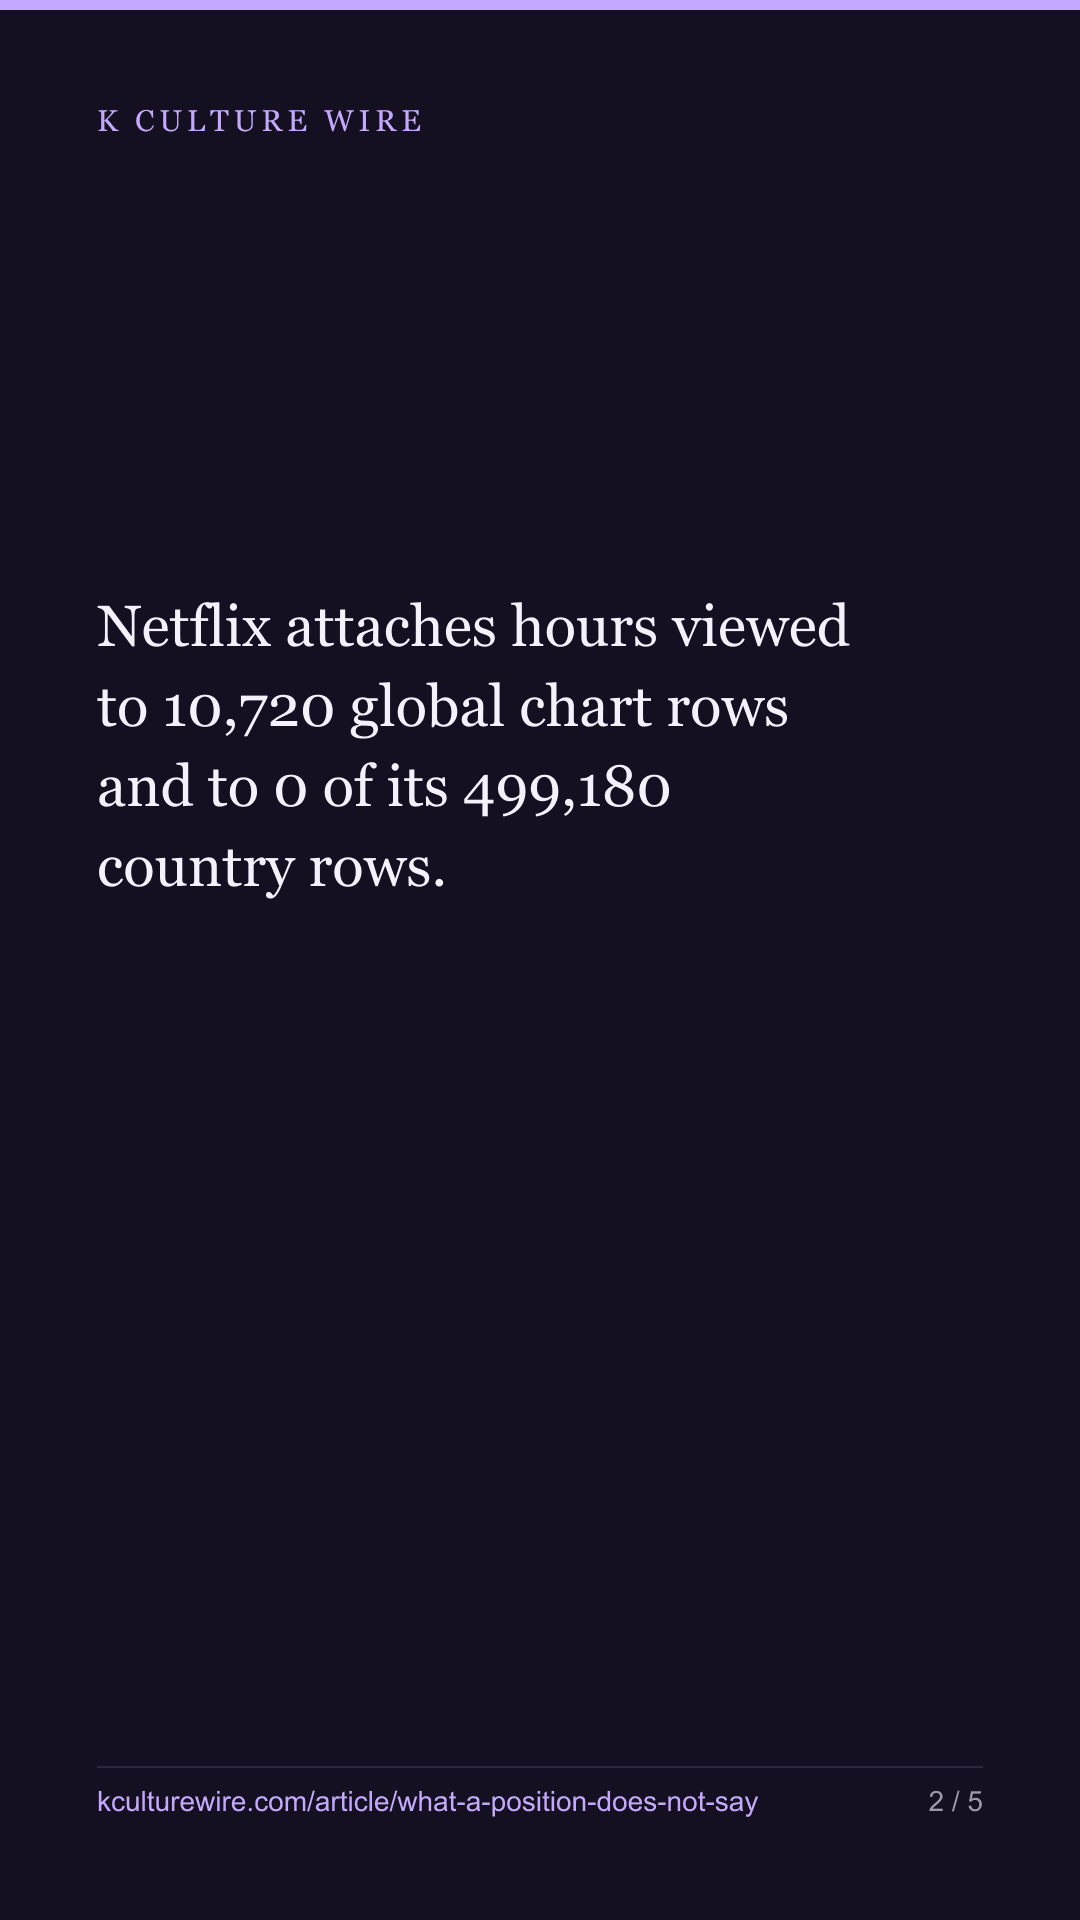
Netflix attaches hours viewed to 10,720 global chart rows and to 0 of its 499,180 country rows. Knowing a rank narrows the possible hours by 47.3% on the non-English series chart — least of the four, and the one Korean titles sit on.
The table this is written from: /rank-tells
Every number this publication has published about Korean titles on Netflix is built from a chart position. We have never had a viewing figure for a single country, and this article is about what that costs.
Start with the thing that is easy to check and worth checking anyway. Netflix’s weekly lists come in two kinds: one global list and one list per country. We read all of both.
| Netflix Top 10 lists | Rows | Rows carrying hours viewed |
|---|---|---|
| Per-country weekly lists | 499,180 | 0 |
| Global weekly lists | 10,720 | 10,720 |
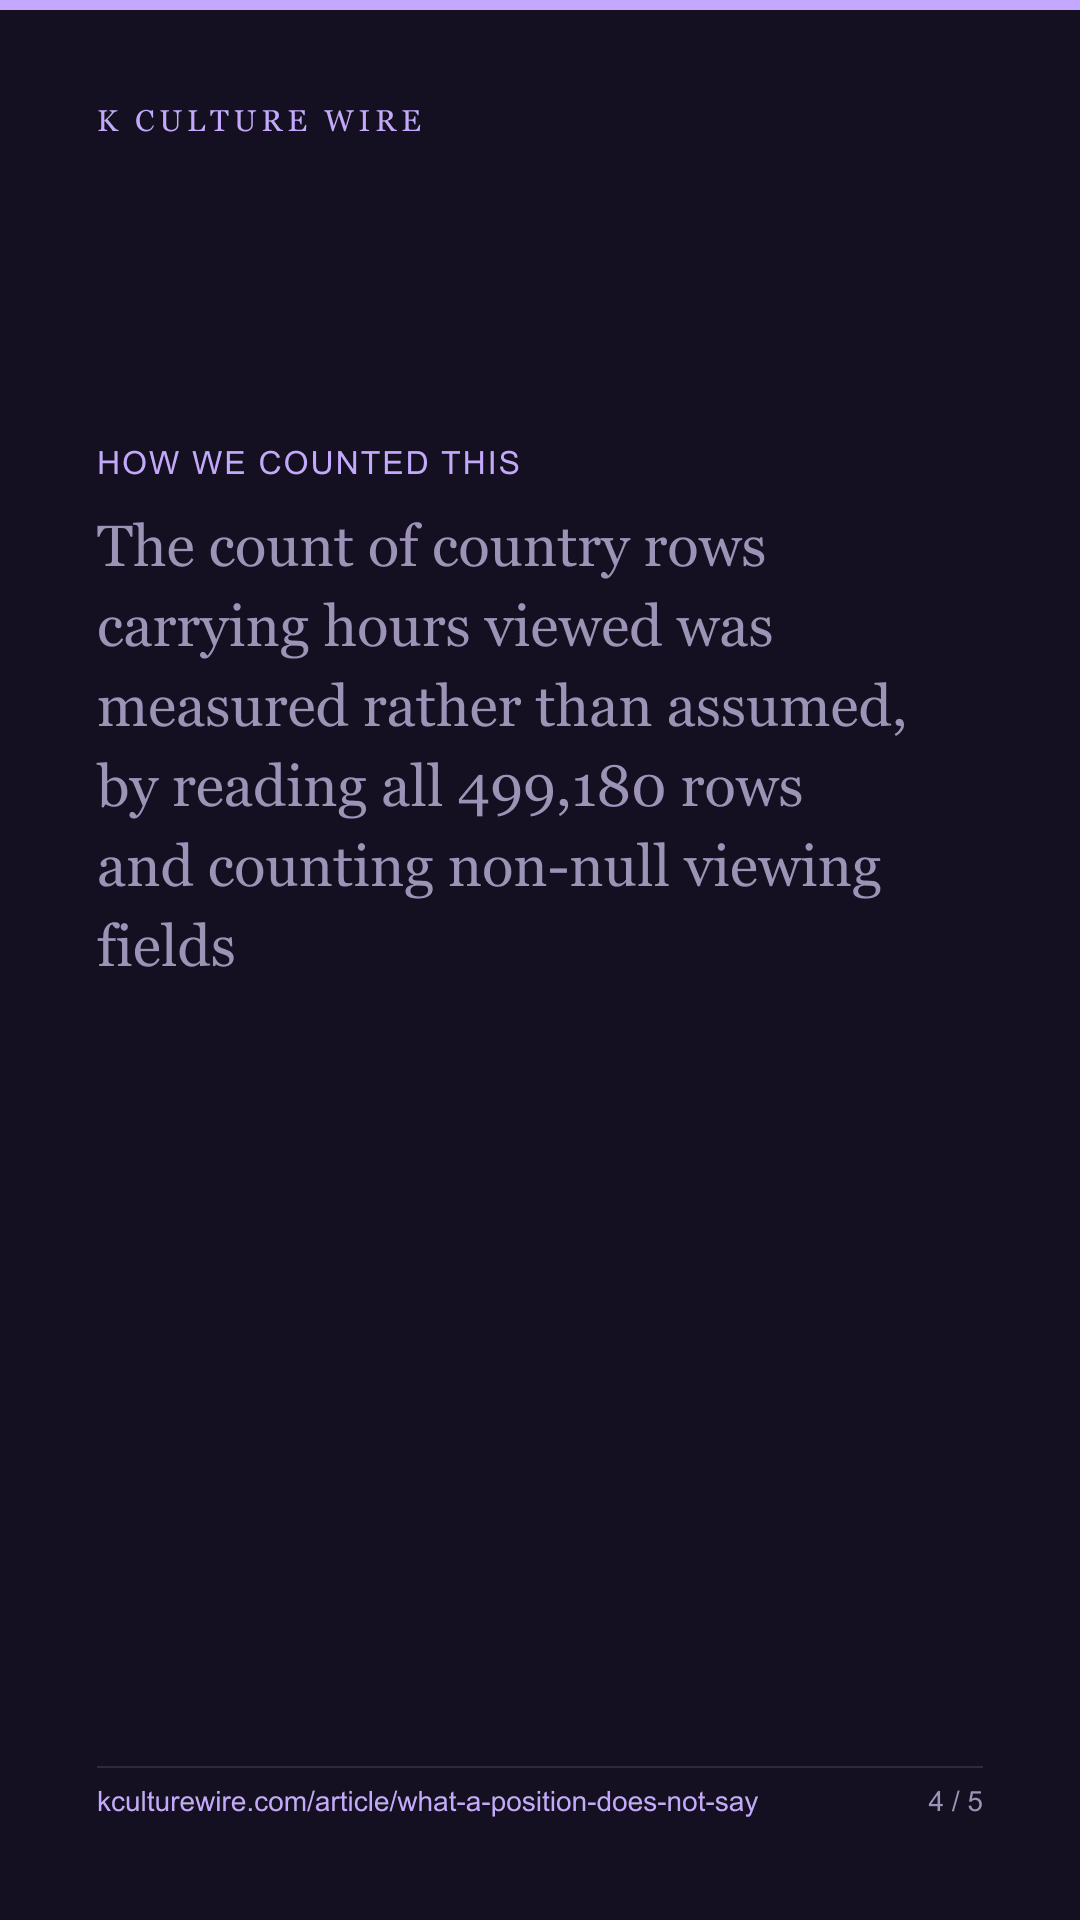
Zero is not a sample problem or a lag. Netflix simply does not say how many hours any country watched anything. Every country figure we publish therefore rests on a position, and the honest question is what a position is worth.
The global lists let us price it
The global lists carry both a rank and the hours behind it, which means they can be used to ask: if you knew only the rank, how much would you know about the hours?
We measured that as a range. Take every row of a chart and ask how many times bigger a high week is than a low one — the 90th percentile over the 10th. Then ask the same question inside each of the ten rank positions separately. The difference between the two is what the rank bought you.
| Chart | Spread knowing nothing | Spread knowing the rank | Narrowed by |
|---|---|---|---|
| Films (English) | 5.94× | 2.19× | 63.1% |
| Films (Non-English) | 7.54× | 2.94× | 61% |
| TV (English) | 9.16× | 4.27× | 53.4% |
| TV (Non-English) | 6.68× | 3.52× | 47.3% |
Films and series, English and non-English, are four charts of different sizes; mixing them would let a difference between charts be read as a difference between ranks, so they are kept apart.
The last row is ours. Korean series appear on the non-English television chart, and that is where a rank narrows the range least of the four. Two weeks at the same rank on that chart are still 3.52 times apart in hours.
A rank is not nothing
It would be as dishonest to undersell this as to oversell it.
| Chart | Median hours at rank 1 | At rank 10 | Ratio |
|---|---|---|---|
| Films (English) | 42.4m | 5.4m | 7.86× |
| Films (Non-English) | 16.6m | 2.1m | 7.9× |
| TV (English) | 77.7m | 11.0m | 7.04× |
| TV (Non-English) | 45.7m | 7.4m | 6.17× |
A typical week at rank 1 is six to eight times the hours of a typical week at rank 10, and the ordering never inverts on any chart in 268 weeks. Rank carries real information about where a title sits against the other nine.
What it does not carry is the size of the audience. A number one in a quiet week and a number one in a loud one are the same symbol standing for very different things, and on the chart Korean titles live on the gap between those two things is the widest of the four.
Why we are publishing our own weak spot
Because the alternative is worse. This site sells measurement, and a buyer who discovers on their own that “rank 3 in Vietnam” does not mean a fixed number of viewers will reasonably wonder what else we did not mention. Better that the limit arrives from us, with its size attached.
It also changes what we should be claiming. A sentence like “Korean titles hold 7.7% of the world’s chart places” is a statement about places, and we have always written it that way. This is why: places are what Netflix publishes per country, and any translation of places into audience would be an invention. The figure is not a proxy for viewing that we are being coy about. It is a different thing that we can actually count.
What this cannot tell you
The global lists are not the country lists. A rank on Vietnam’s chart is produced by Vietnamese viewers, and Netflix has never published those hours in any form, so how well rank stands in for viewing inside a single country cannot be measured from anything Netflix releases. Everything above describes the global charts, where both columns exist. It is the closest available answer, not the answer.
Two smaller limits. Spread is a percentile ratio rather than a standard deviation, because hours viewed have a long upper tail and a mean would sit above most of the weeks it describes. And a median is a middle, not a value — a given week at rank 1 may sit well away from the figure in the table.
Why we bothered
Because we are about to sell market-level sheets to people who schedule television, and the first question a good buyer asks is what the number cannot do. Having the answer measured, in four charts, with the weakest one highlighted, is worth more to that conversation than a better-sounding claim would be.
The full tables — all four charts, rank by rank on the non-English series chart, and the row counts behind the zero: what a position does and does not carry.
Where these numbers come from
Sources
- Netflix — Tudum weekly Top 10 lists, 268 weeks to 2026-08-16 — 10,720 global rows carrying hours viewed and 499,180 country rows carrying none · https://www.netflix.com/tudum/top10
What we checked
- The count of country rows carrying hours viewed was measured rather than assumed, by reading all 499,180 rows and counting non-null viewing fields
- The four global charts are measured separately, because films and series and English and non-English are different sizes and mixing them would let a chart difference read as a rank difference
- Spread is the 90th percentile divided by the 10th rather than a standard deviation, because hours viewed have a long upper tail and a mean sits above most of the weeks it describes
- The collector refuses to write if the median at rank 1 is not above the median at rank 10, which would mean the rank column had been read backwards
What we left out, and why
- Country charts from the hours-viewed measurement entirely, because Netflix publishes no viewing figures at that level at all
- Rows with no hours viewed recorded, rather than treating a missing figure as zero
The data behind this
Written from the same data
Take this away — 10 cards
The figures in this article, as images. Free to repost with the address on them.



If you work in this business
Everything on this page is measured from the same weekly Netflix lists, per market and per title. We publish the pages free; what we sell is the same measurement cut to one company's catalogue — including the figures behind /rank-tells.
What a company sheet contains, and what it cannot tell you →