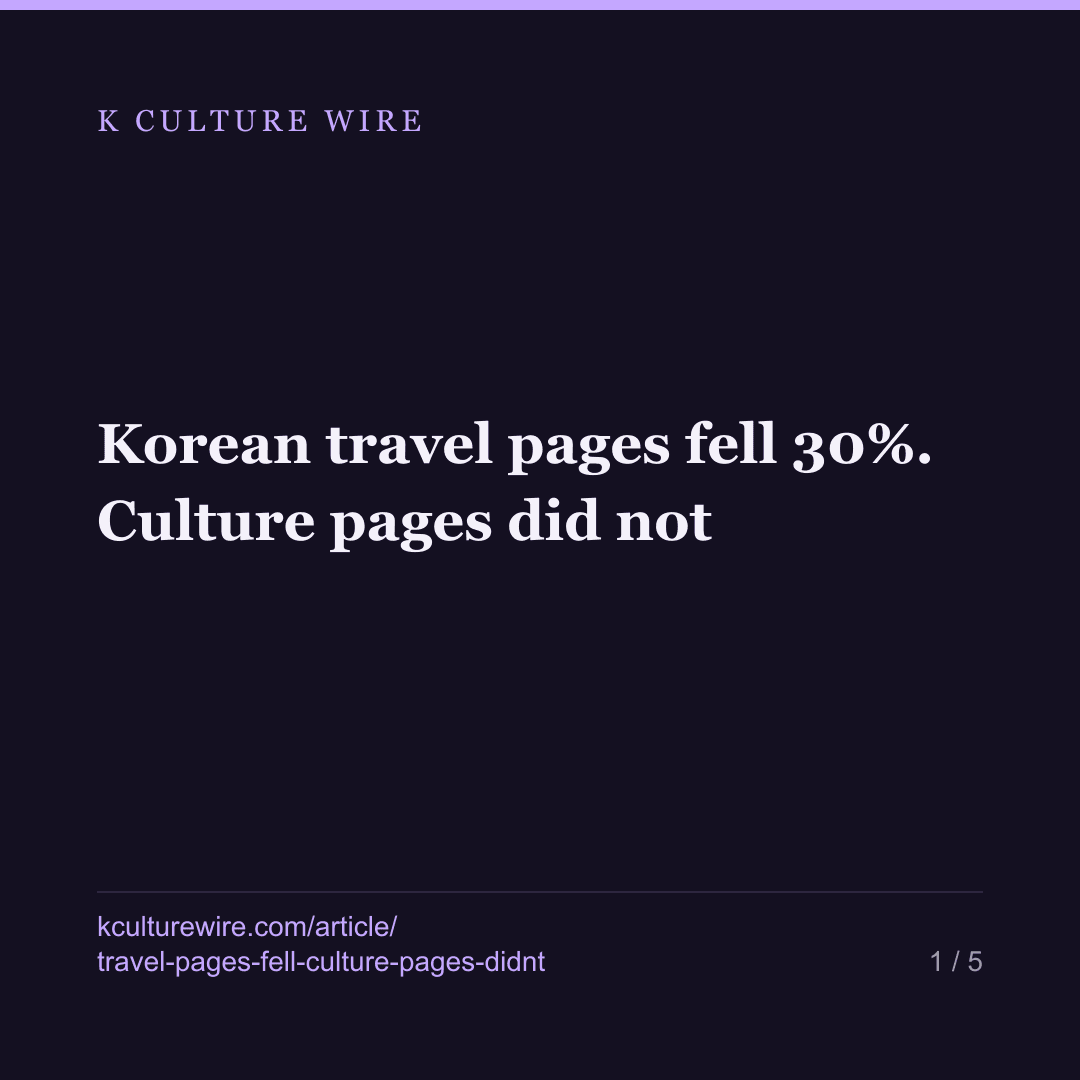
Korean travel pages fell 30%. Culture pages did not
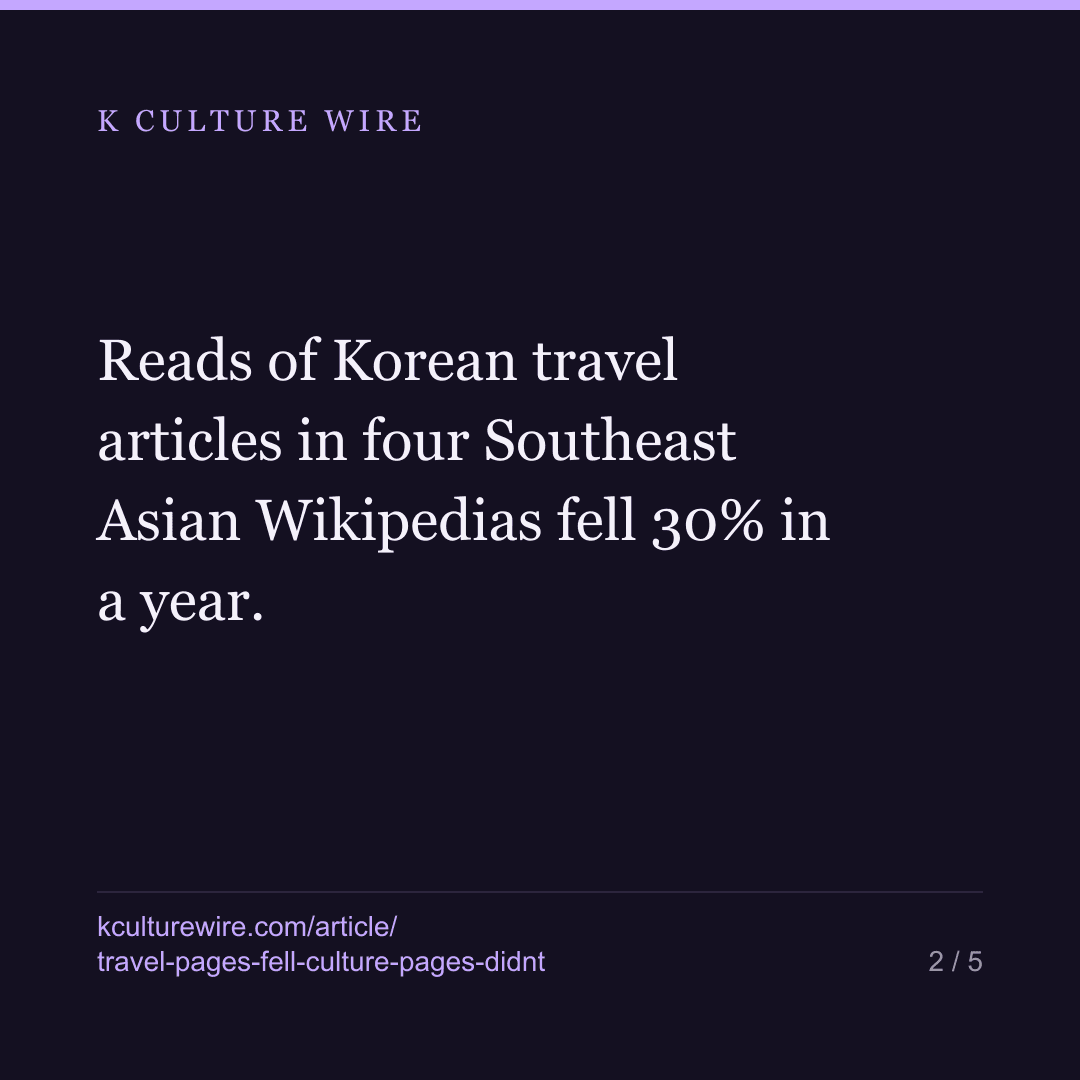
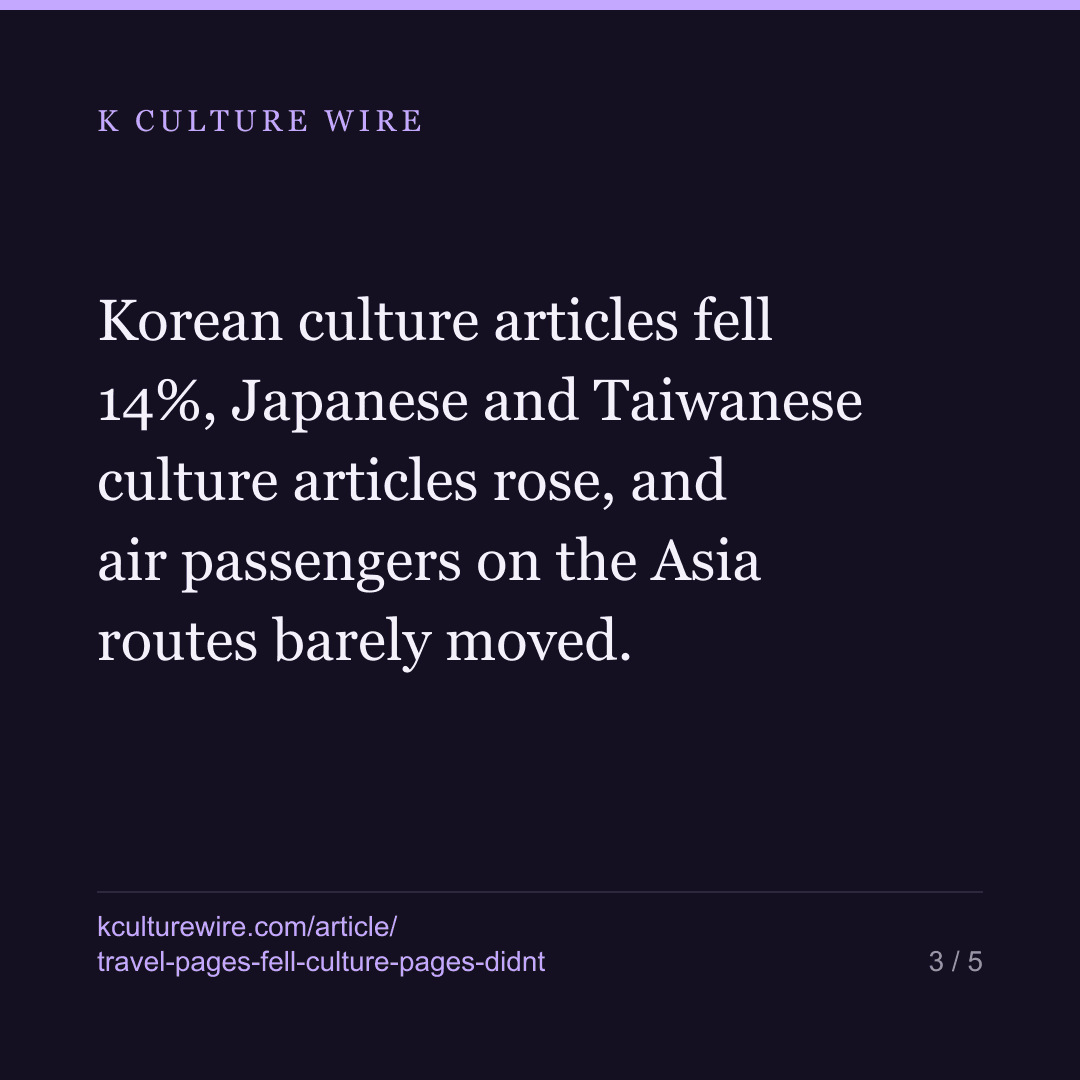
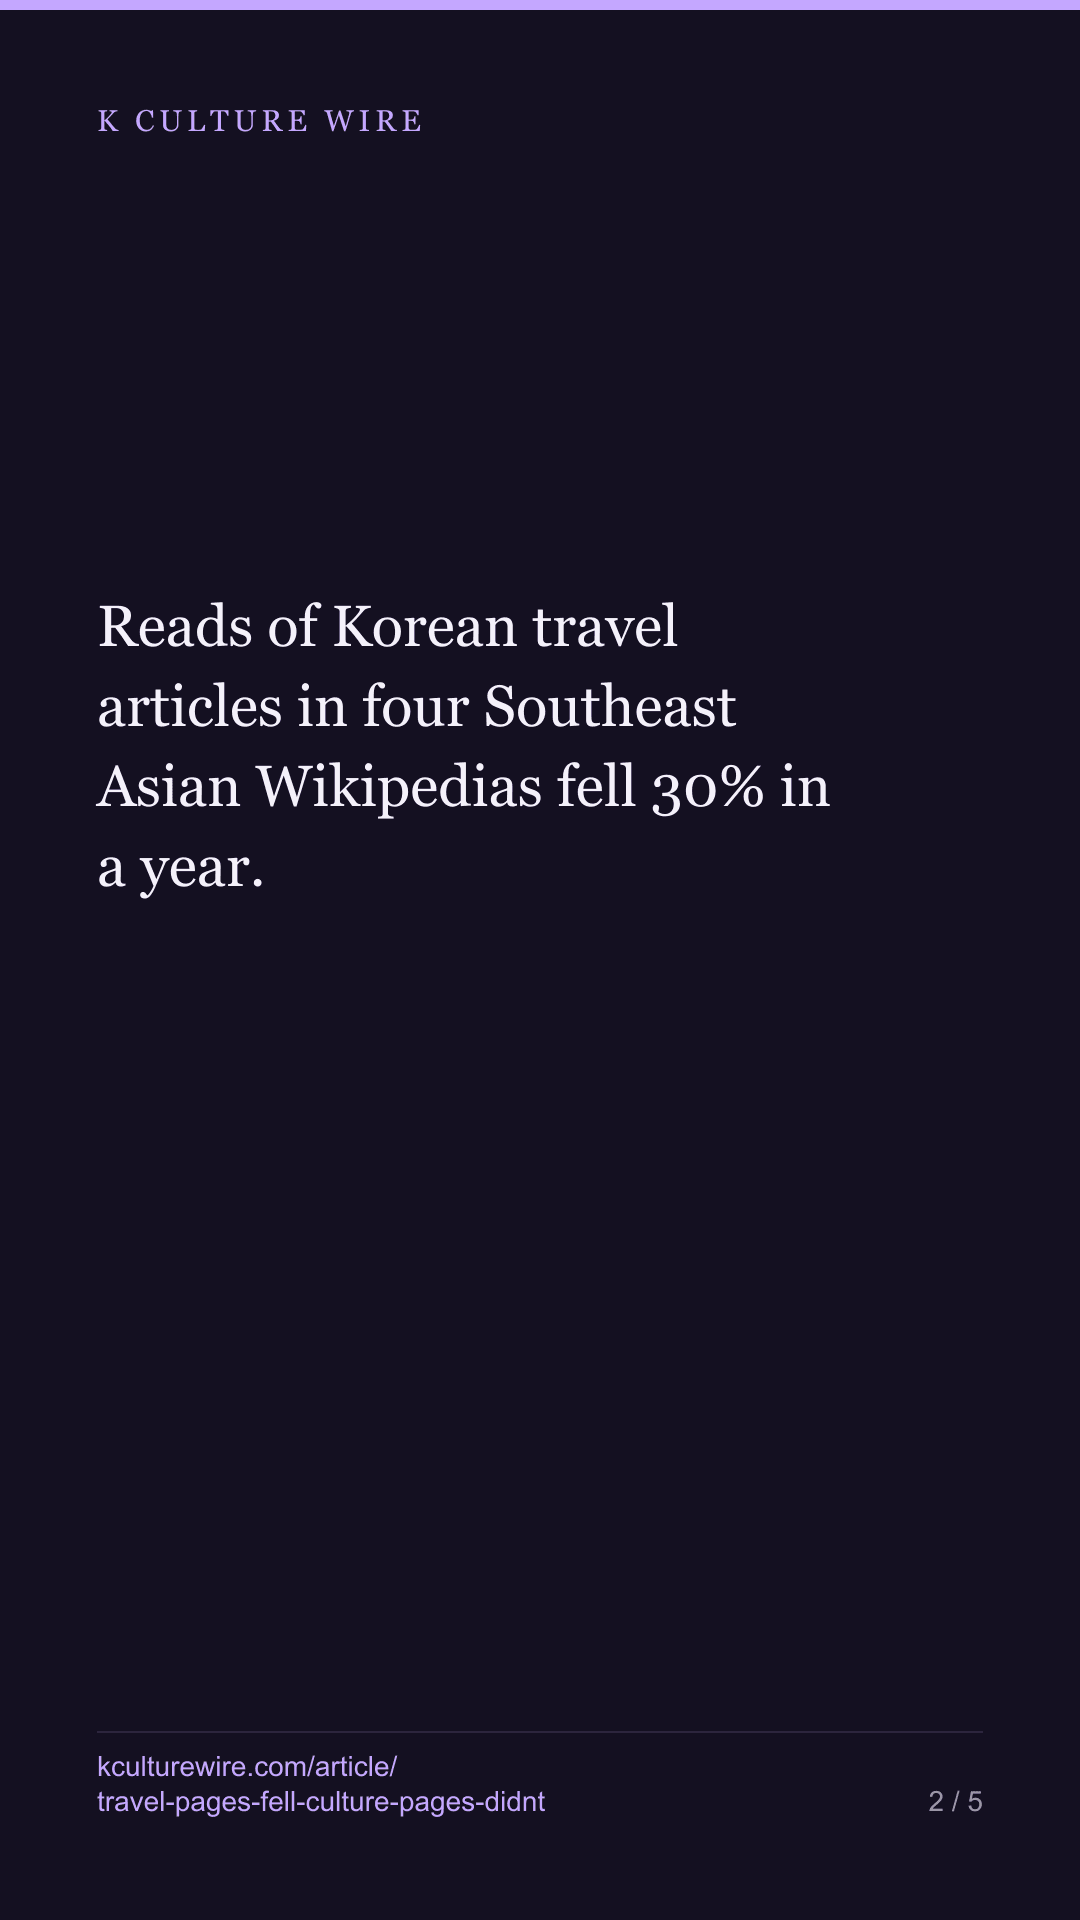
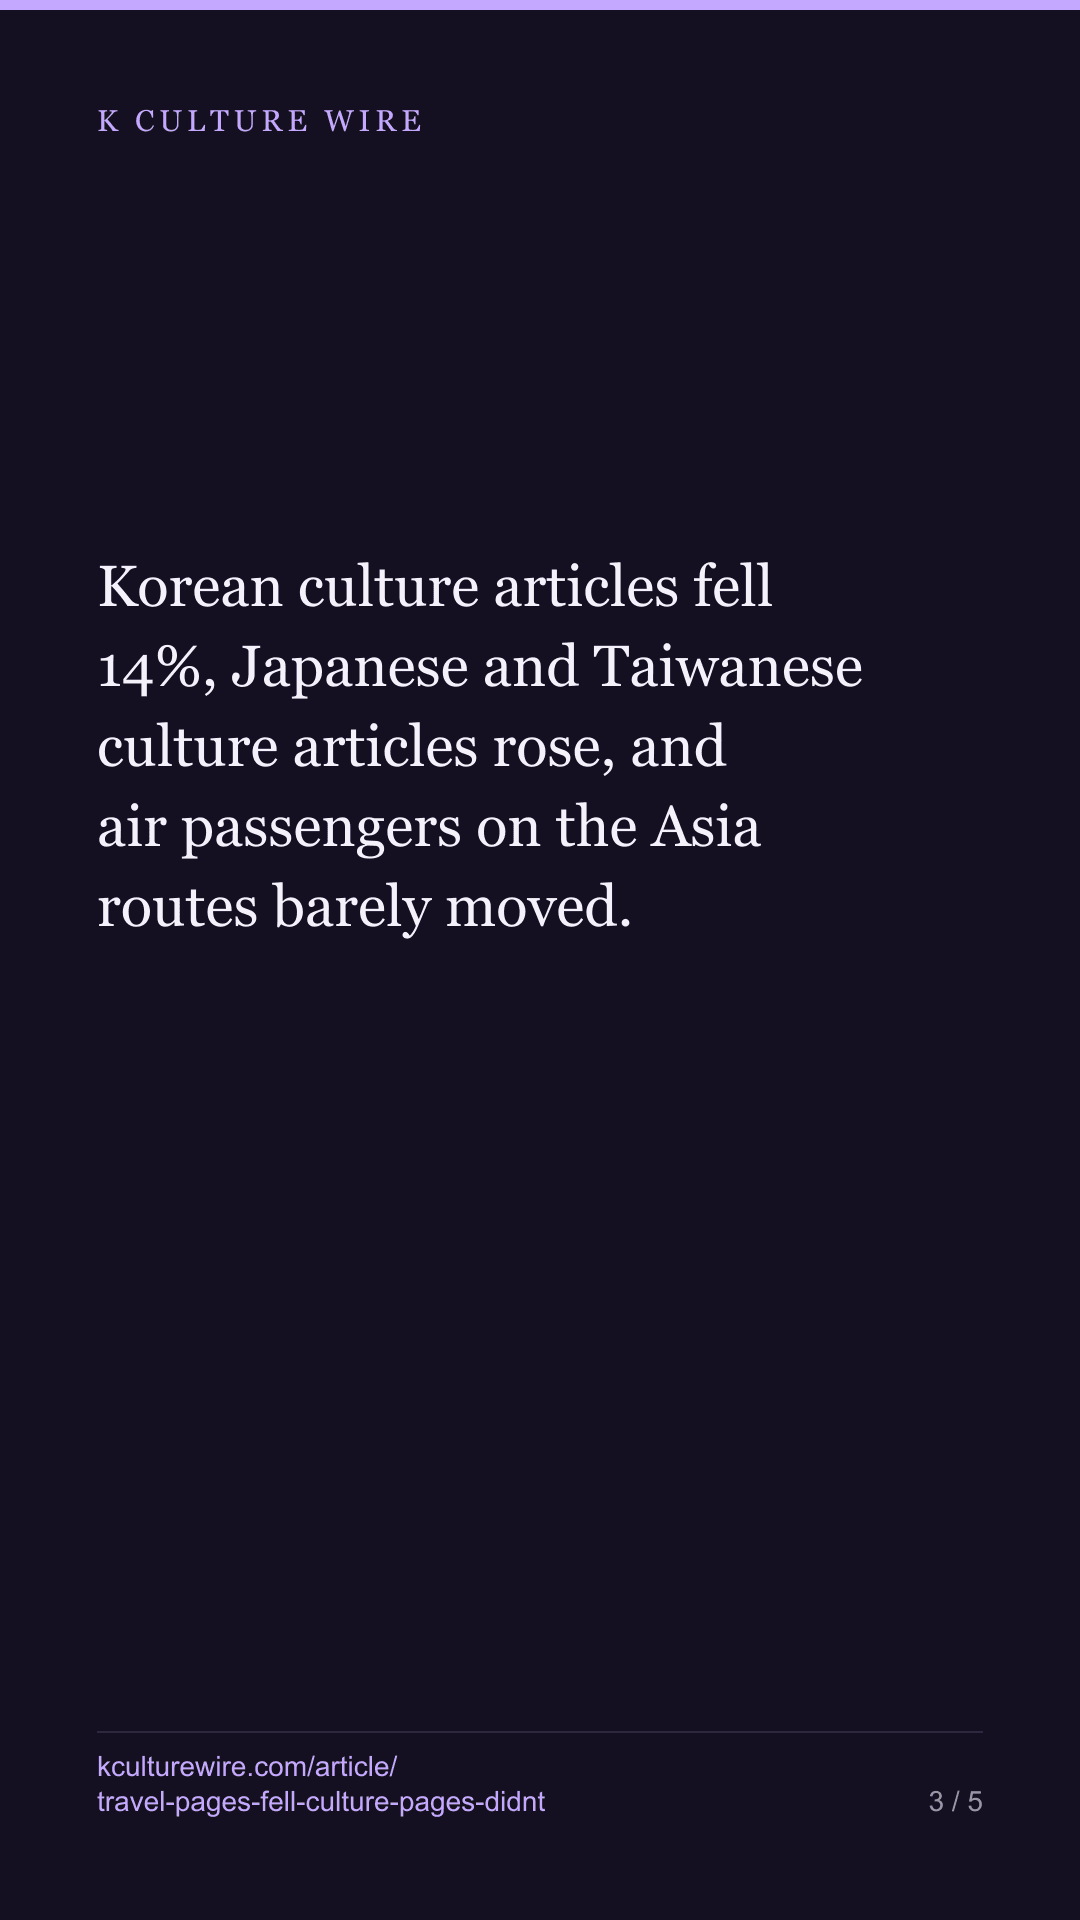
Reads of Korean travel articles in four Southeast Asian Wikipedias fell 30% in a year. Korean culture articles fell 14%, Japanese and Taiwanese culture articles rose, and air passengers on the Asia routes barely moved.
The table this is written from: /what-actually-fell
Yesterday we counted how Southeast Asia looks up a Korean trip, month by month. Going back to the same numbers with a longer ruler — twelve months against the twelve before them — produced a figure we had not seen: reads of Korean travel articles in the Indonesian, Vietnamese, Thai and Malay Wikipedias were down about 30%.
That is a headline. Interest in Korea is cooling. We nearly wrote it.
It would have been wrong, and the thing that stopped us was not caution. It was a second set of numbers we did not have yet.
The control group
A number falling tells you nothing on its own. It has to fall against something. So we fetched a matched set: the same kinds of articles about Japan and Taiwan, in the same four editions, over the same months. Airport against airport, high-speed rail against high-speed rail, transit card against transit card. Countries foreign to all four editions, and comparable to Korea as places a Southeast Asian traveller might go.
Then we added a second axis. Not travelling to Korea — Korea itself: the country’s own article, its pop music, its dramas, its cinema, its language, its alphabet.
| Articles about | Korea | Japan and Taiwan |
|---|---|---|
| Travelling there | −30.4% | −16.9% |
| The place and its culture | −11.8% | +6.8% |
Reads are per million reads of that edition, so an encyclopaedia shrinking overall is already divided out of every cell.
The row that matters is the second one. Culture articles about Japan and Taiwan did not fall. They rose. Whatever emptied the travel articles did not touch them.
The comparison we threw away
Korea fell further than the controls in both rows, and that is the comparison a reader will reach for. We are not making it, because our own check took it away.
Korea’s articles also start higher, and an article that starts higher has further to fall. So we kept only the pairs where the two sides began within a factor of two of each other and measured again. On the travel axis the gap went from 13.4 points to 8.1. On the culture axis it went from 18.6 points to 5.7 — and the count of pairs where Korea still fell further landed near even.
A gap that survives only until both sides start from the same place was the starting place. So nothing below rests on it.
What is left standing is inside Korea’s own pages
Both of these rows are Korean articles, in the same four editions, over the same months. No other country is involved, so nothing hangs on how Korea compares to Japan.
| Korean articles about | Where they started | Change |
|---|---|---|
| Travelling there | 57.7 per million | −31.0% |
| The place and its culture | 589.3 per million | −14.1% |
These two percentages differ slightly from the ones in the first table, and the reason is worth a sentence. In the first table each Korean article is counted once per control it was paired against, because that table is about the pairings. Here each Korean article is counted once per edition, full stop. Same reads, different denominator.
The culture pages sit about ten times higher and fell about seventeen points less. Height makes a steep fall easier, not harder — so for once the confound pushes the wrong way, and the gap survives it.
Meanwhile the aeroplanes
Over exactly the same twenty-four months, passengers on the Asia routes into and out of Korea moved −0.7%. Japan routes were up 13.5%, China up 21.2%.
Nobody stopped going. They stopped opening an encyclopaedia article about the visa rule first.
The explanation we tried, and could not keep
The obvious reading of all this is that questions with one settled answer — the visa rule, how the transit card works, which airport — have been draining out of encyclopaedias as the answer arrives some other way, while the pages you browse for pleasure have not. It is tidy, and we wrote it into an earlier version of this article before measuring it.
Then we split the travel articles into those two halves and measured.
| Korean travel articles | Change | Article–edition pairs |
|---|---|---|
| Settled answer — visa, transit card, airport, rail, subway | −33.5% | 11 |
| Browsing — shopping, nightlife, island, food, tourism | −29.2% | 15 |
Four points apart. The gap between travel and culture articles is eighteen. And the single kind that fell least of all was the nightlife district page at −10.7%, which is on the browsing side — the right direction for the explanation, and nowhere near enough of it.
So the split is real but far too small to carry the fall. Something took about thirty percent off Korean travel pages and about seventeen off Japanese and Taiwanese ones, and it did not care much whether the page answered a question or showed you a neighbourhood. We do not know what it was.
The same table, two rulers
One line in this story exists only because of how we measured, and we would rather show it than bury it.
| Route region | One month | Twelve months |
|---|---|---|
| Oceania | −25.1% | +2.1% |
| Middle East | −31.1% | −13.6% |
| Asia (excl. Japan, China) | −9.6% | −0.7% |
Oceania is the clean case. Read June against last June, it is down a quarter. Read the year against the year before it, it is up. Same table, same source, opposite direction — and the shorter ruler is the one that would have made the better headline. That is exactly why we do not use it.
What this cannot tell you
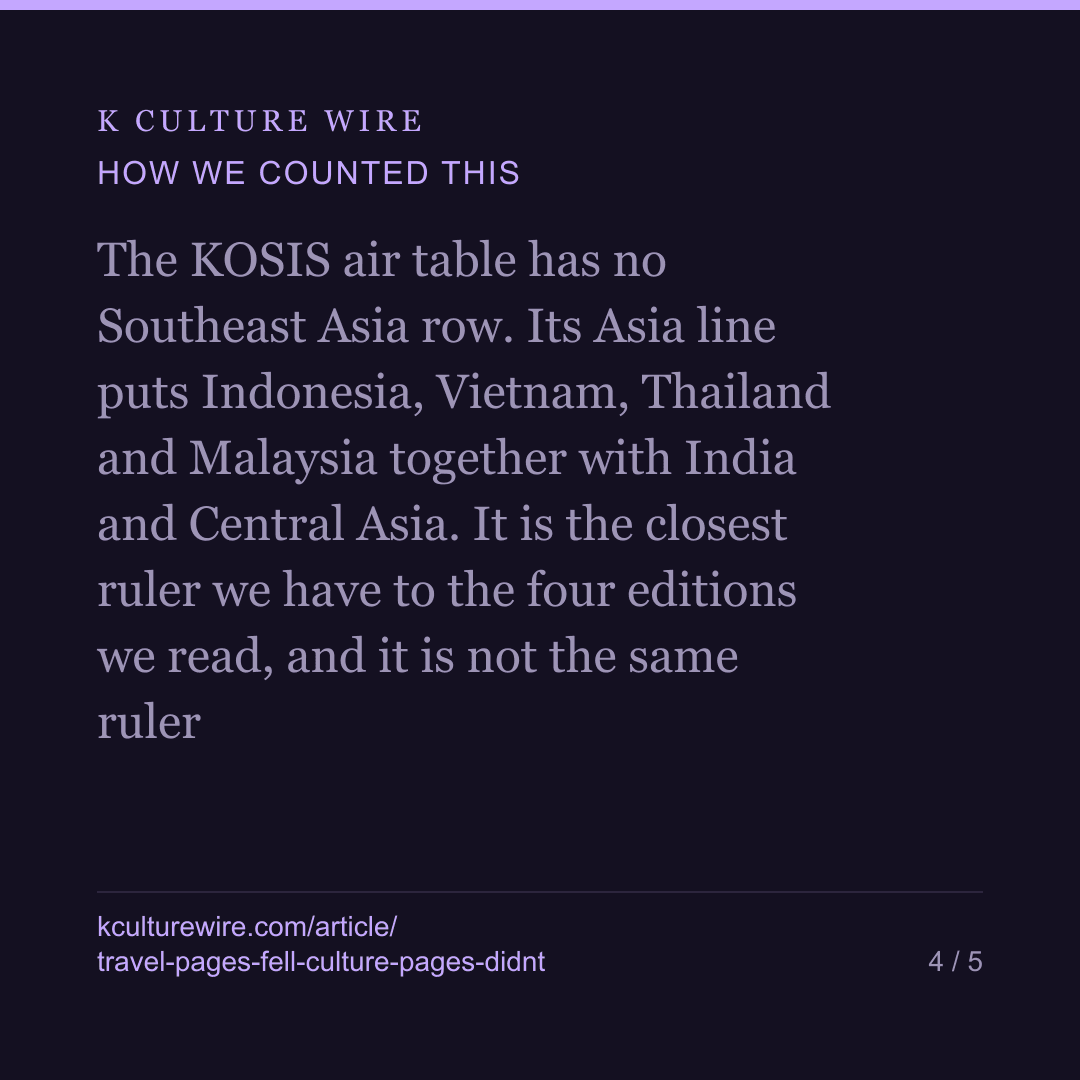
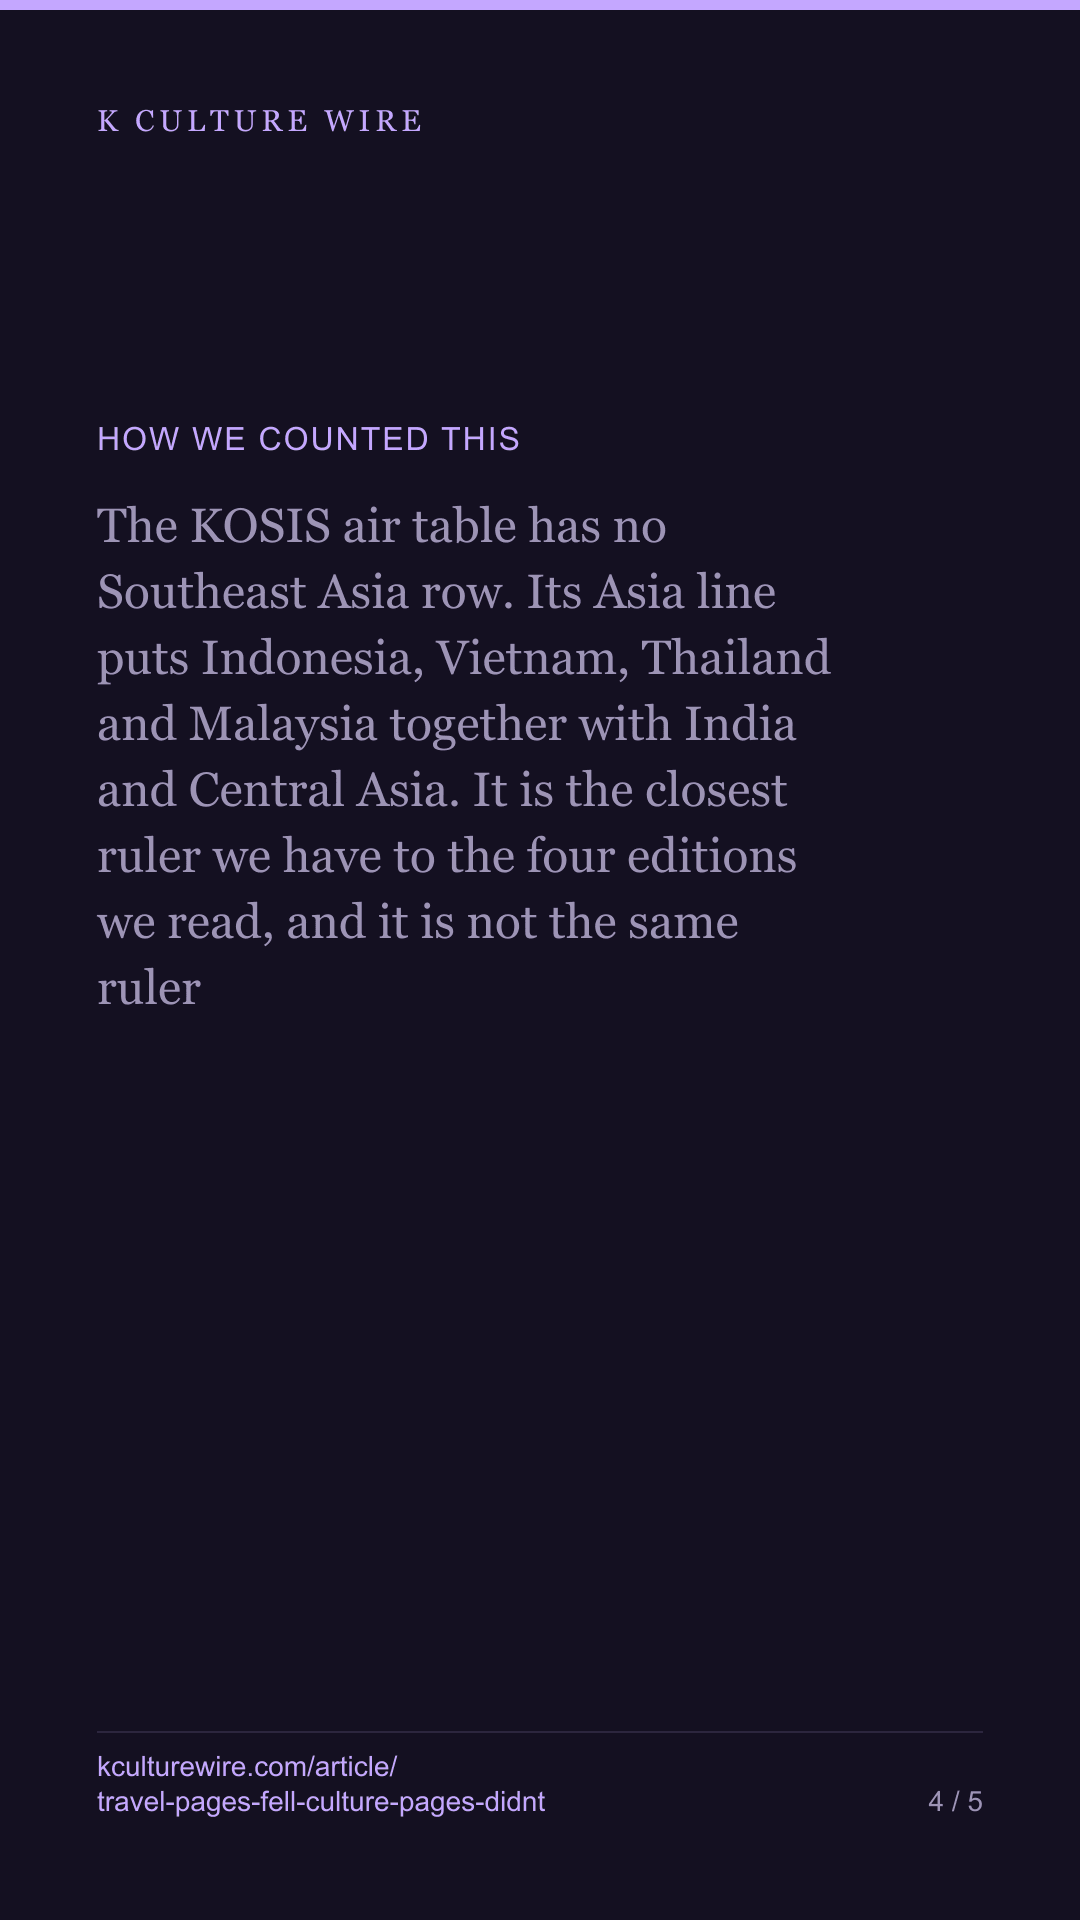
The KOSIS air table has no Southeast Asia row. Its Asia line puts Indonesia, Vietnam, Thailand and Malaysia together with India and Central Asia. It is the closest ruler we have to the four editions we read, and it is not the same ruler.
These reads are not travellers. Some are homework, some are curiosity, and some never become a trip. A read can date when the looking happened, not whether anyone went.
The pairings are article-kind against edition, so the same article appears in several of them. They are not independent observations and we do not treat them as a sample.
And we cannot tell you why the culture pages held. We can tell you that the fall was not about Korea, was not about the encyclopaedia shrinking, was not about where the articles started, and was not mostly about settled answers leaving encyclopaedias — because we checked all four, and each check took something away from us. The last one took away a paragraph we had already written.
The full tables, including every article kind and every edition, are on what actually fell.
Where these numbers come from
Sources
- Wikimedia — Pageviews API, Indonesian, Vietnamese, Thai and Malay editions, monthly, July 2024 to June 2026
- KOSIS — International air routes by region, Korea Airports Corporation, monthly
What we checked
- The KOSIS air table has no Southeast Asia row. Its Asia line puts Indonesia, Vietnam, Thailand and Malaysia together with India and Central Asia. It is the closest ruler we have to the four editions we read, and it is not the same ruler
- These reads are not travellers. Some are homework, some are curiosity, and some never become a trip. A read can date when the looking happened, not whether anyone went
- The pairings are article-kind against edition, so the same article appears in several of them. They are not independent observations and we do not treat them as a sample
- We cannot say why the culture pages held. We can say the fall was not about Korea, not about the encyclopaedia shrinking, not about where the articles started, and not mostly about settled answers leaving encyclopaedias — because we checked all four
The data behind this
Written from the same data
Take this away — 10 cards
The figures in this article, as images. Free to repost with the address on them.



If you work in this business
Everything on this page is measured from the same weekly Netflix lists, per market and per title. We publish the pages free; what we sell is the same measurement cut to one company's catalogue — including the figures behind /what-actually-fell and /look-vs-fly.
What a company sheet contains, and what it cannot tell you →