Industry · music
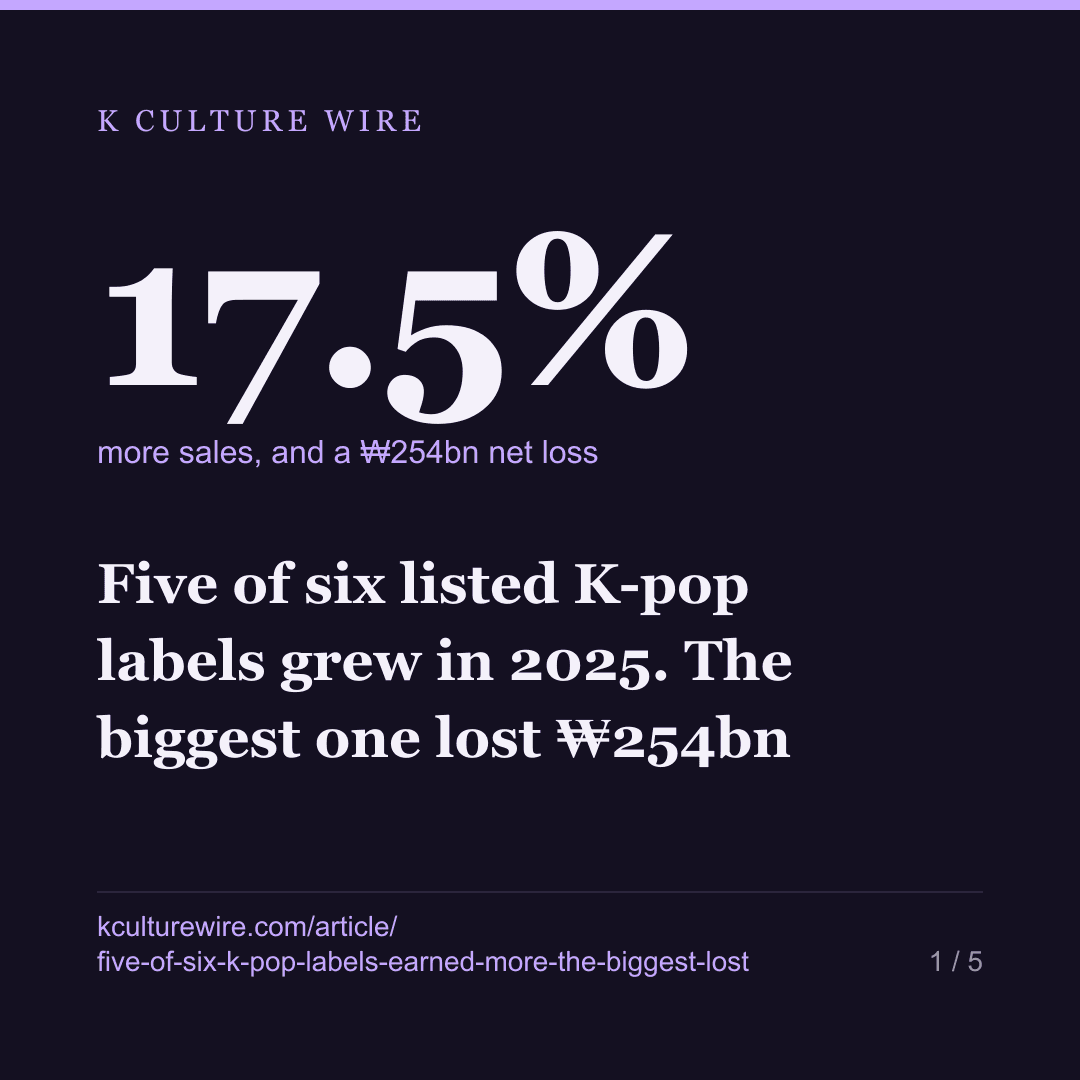
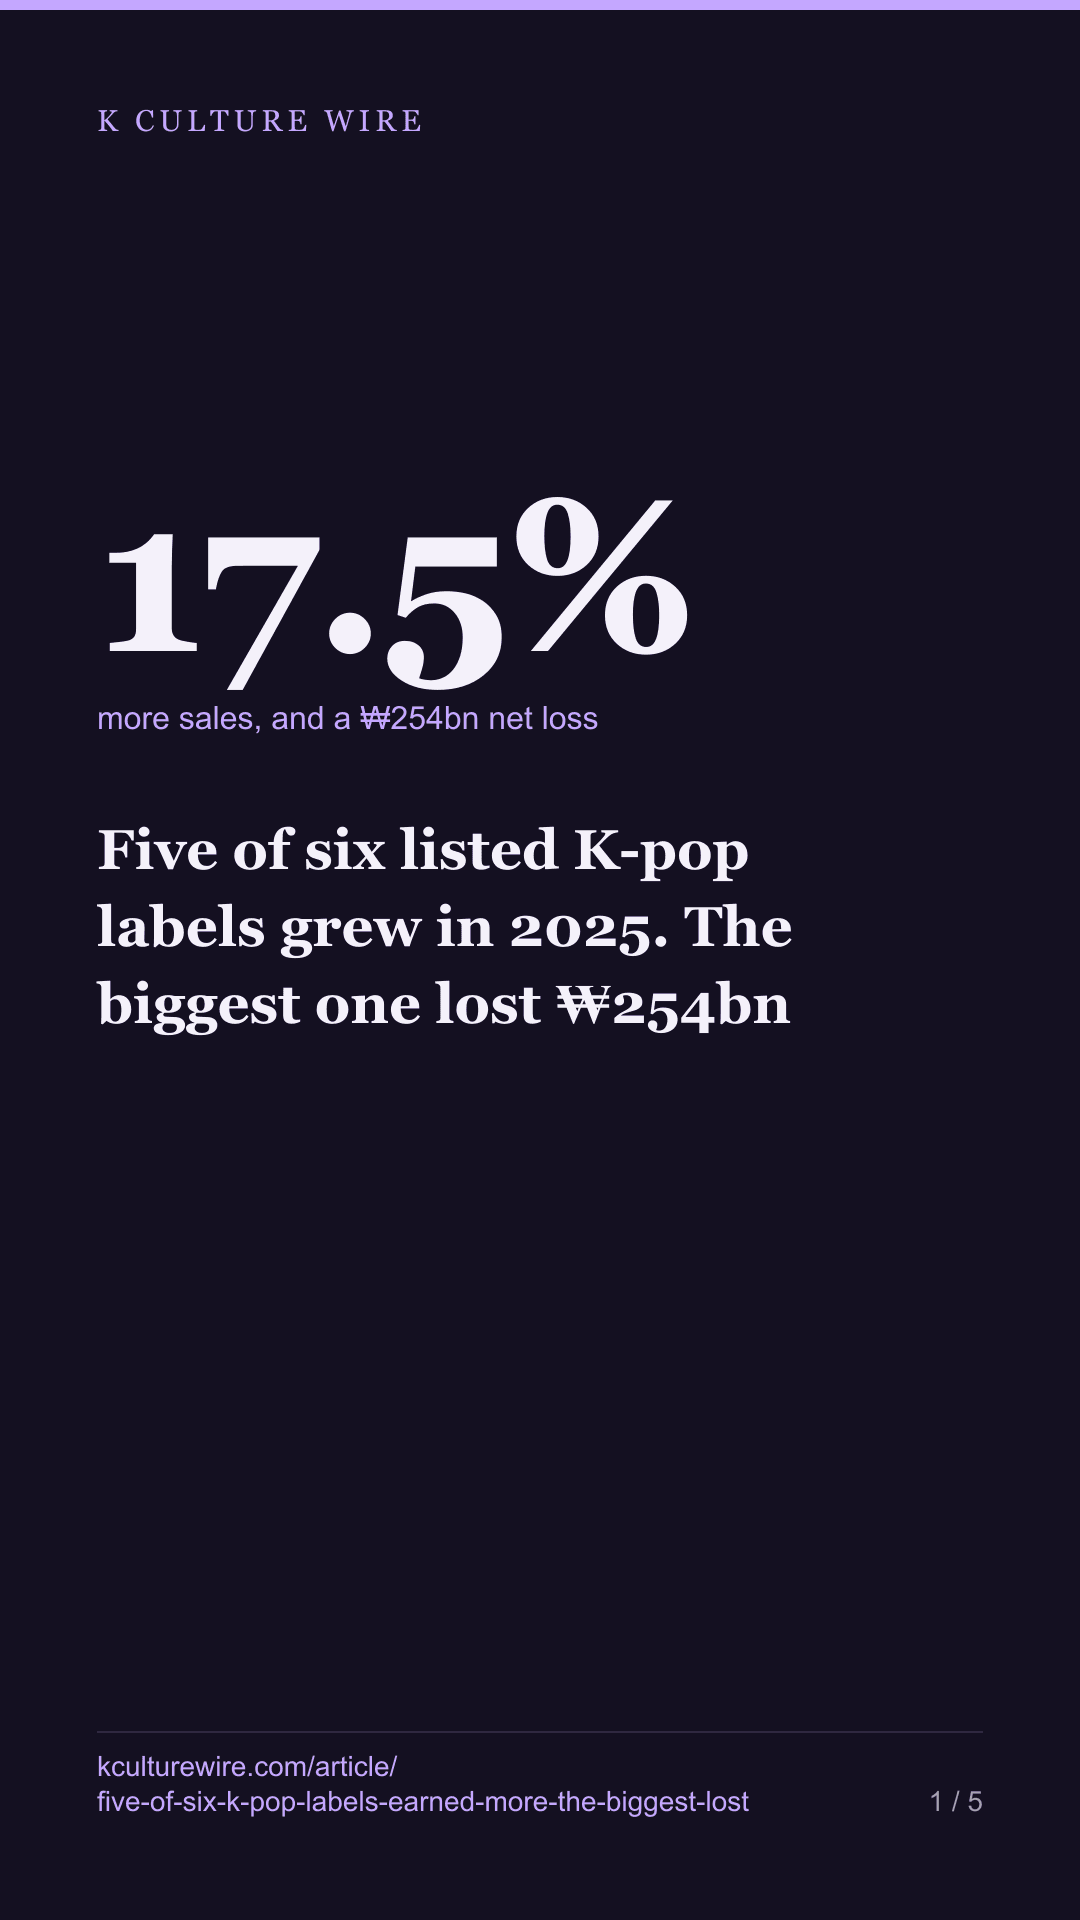
Five of six listed K-pop labels grew in 2025. The biggest one lost ₩254bn
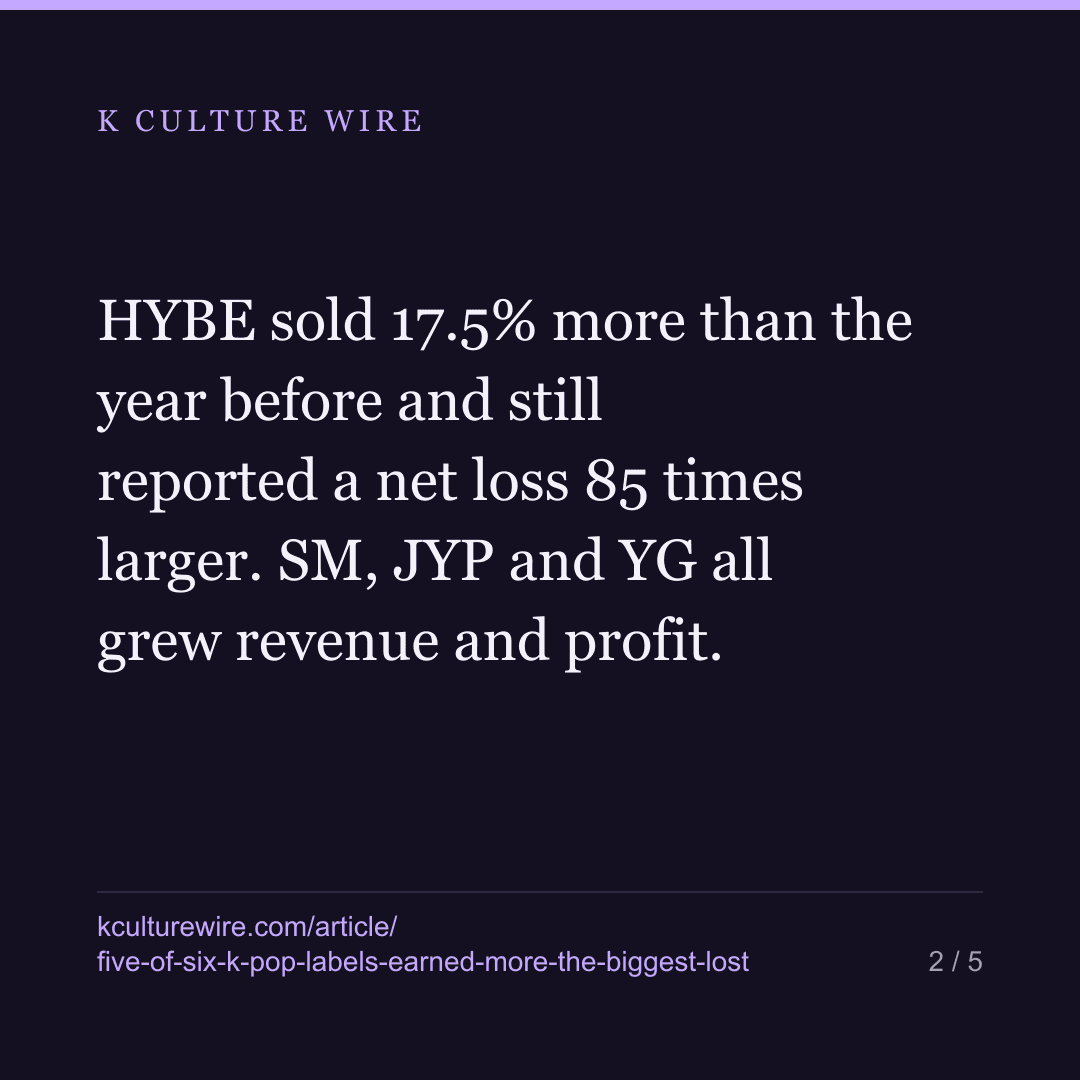
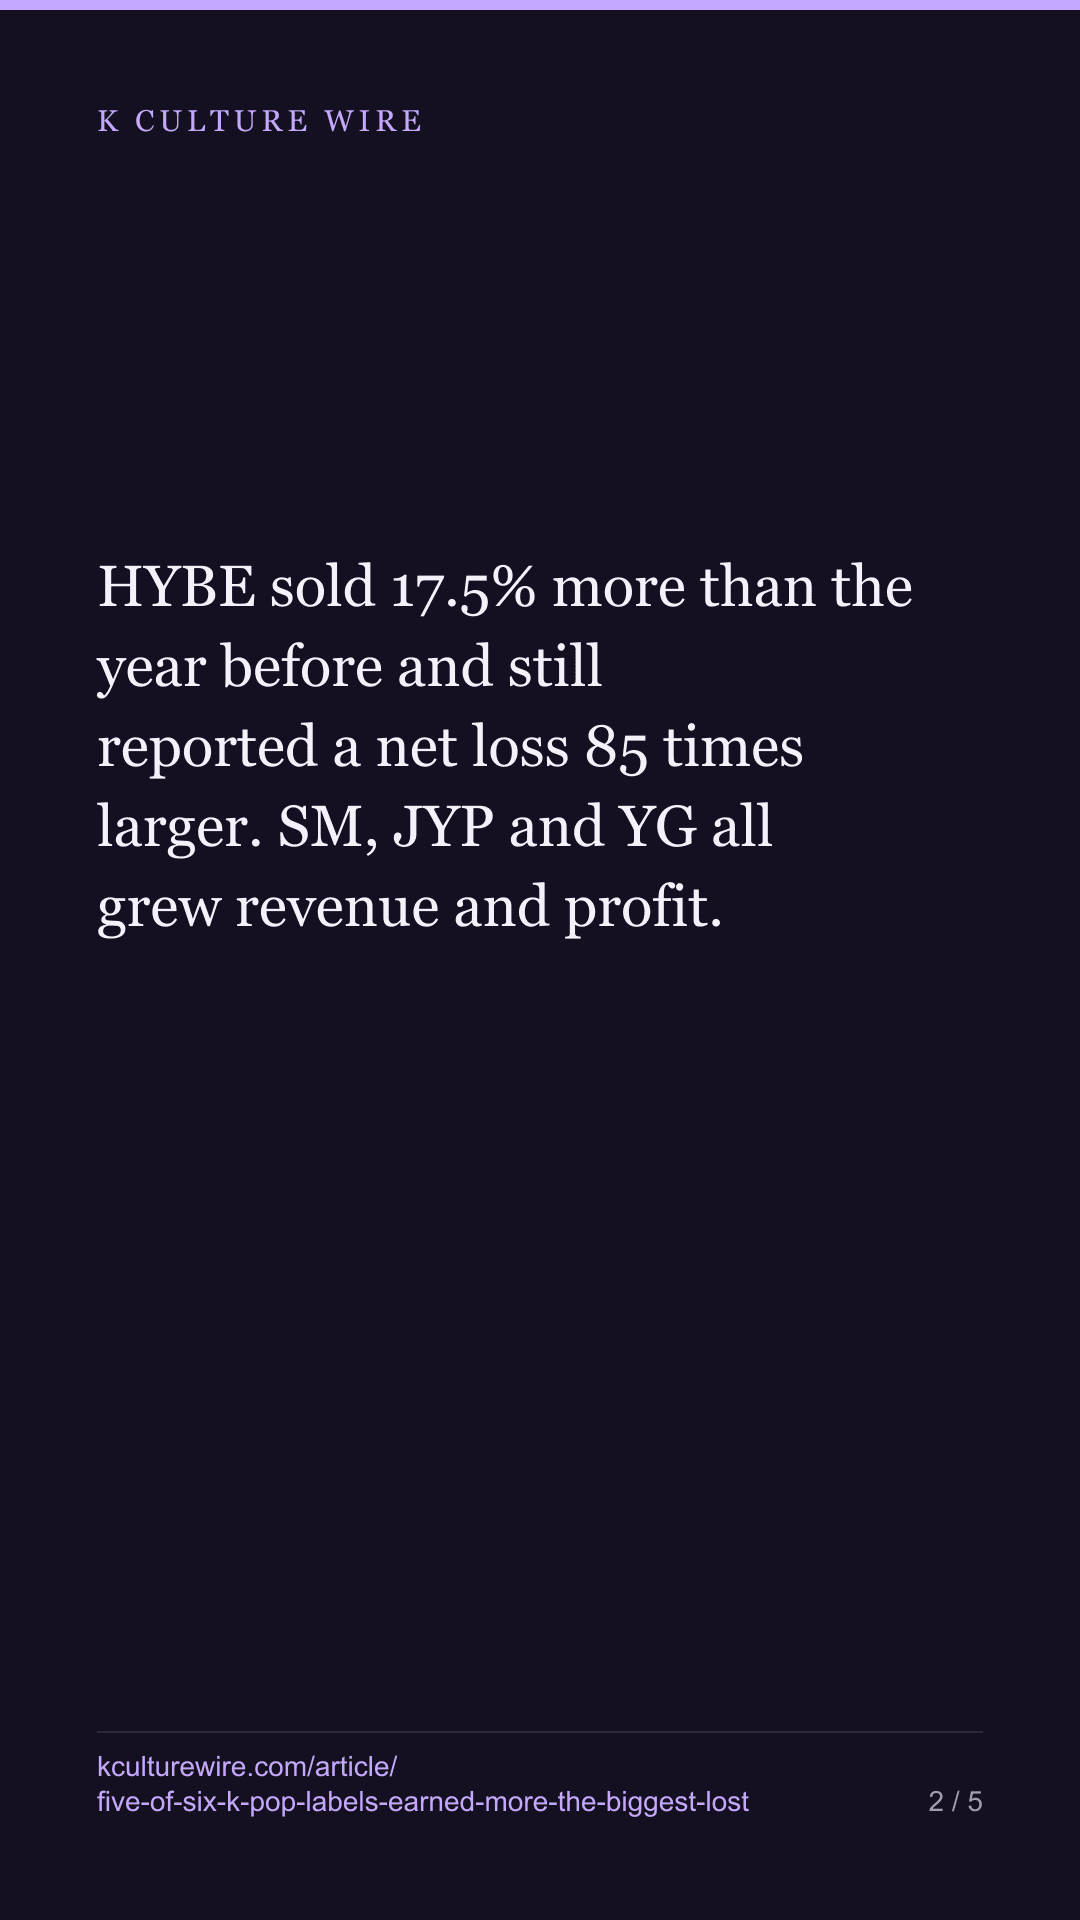
HYBE sold 17.5% more than the year before and still reported a net loss 85 times larger. SM, JYP and YG all grew revenue and profit. Filed figures, in English, with the filing receipts named.
The table this is written from: /label-accounts
Six listed Korean music companies filed 2025 annual accounts. Five sold more than the year before. Four made more money. And the largest one, which is worth more than the other five put together, reported a net loss of ₩254.4bn — eighty-five times the small loss it recorded a year earlier.
Those two facts sit in the same industry, in the same year.
The table
Consolidated filings for fiscal 2025, in trillions of won. Market capitalisation is the trading day 8 September 2026. The same figures, with the gap between operating and net profit set out company by company, are on our listed label accounts page.
| Company | Market cap | Revenue 2025 | Revenue 2024 | Operating profit 2025 | Operating profit 2024 | Net profit 2025 | Net profit 2024 |
|---|---|---|---|---|---|---|---|
| HYBE | 7.82 | 2.650 | 2.256 | 0.049 | 0.184 | −0.254 | −0.003 |
| SM Entertainment | 1.89 | 1.175 | 0.990 | 0.183 | 0.087 | 0.359 | 0.001 |
| JYP Entertainment | 1.41 | 0.822 | 0.602 | 0.155 | 0.128 | 0.161 | 0.098 |
| YG Entertainment | 0.81 | 0.545 | 0.365 | 0.071 | −0.021 | 0.054 | 0.020 |
| Cube Entertainment | 0.09 | 0.087 | 0.103 | −0.007 | 0.012 | −0.006 | 0.017 |
| FNC Entertainment | 0.03 | 0.102 | 0.086 | −0.001 | −0.004 | −0.012 | −0.007 |
Read down the revenue columns and the year looks straightforwardly good. Five of six grew, and the four largest grew between 17.5% and 49.4%.
Read across HYBE’s row and it does not.
What HYBE’s own filing says
Revenue ₩2,650bn, up from ₩2,256bn — a rise of 17.5%.
Operating profit ₩49bn, down from ₩184bn — a fall of 73.2%.
Net profit −₩254bn, against −₩3bn the year before.
That is a company selling more, earning much less on what it sells, and finishing far below the line. The filing gives those three numbers. It does not give a reason, and we are not going to invent one — the gap between an operating profit of ₩49bn and a net loss of ₩254bn is roughly ₩300bn of items below the operating line, and naming what they were would take reading the notes, which is a different piece of work than this one.
Meanwhile the second, third and fourth tiers had good years
SM Entertainment grew revenue 18.7% and more than doubled operating profit, from ₩87bn to ₩183bn. Net profit went from ₩1bn to ₩359bn — a jump so large that it, too, is mostly happening below the operating line rather than in the business of selling records and concerts.
JYP Entertainment is the cleanest row in the table: revenue up 36.6%, operating profit up 21.0%, net profit up from ₩98bn to ₩161bn. Every line moved the same direction.
YG Entertainment turned an operating loss of ₩21bn into an operating profit of ₩71bn, on revenue up 49.4% — the largest revenue increase of the six.
And the two small ones did not
Cube Entertainment is the only company here whose revenue fell, by 15.0%, and it went from an operating profit of ₩12bn to an operating loss of ₩7bn.
FNC Entertainment grew revenue 18.7% and still lost money on both lines, as it did the year before.
Together the two of them are ₩0.12tn of market value against HYBE’s ₩7.82tn. In an industry discussed as though it were one thing, the distance between the top and the bottom of the listed set is about sixty-five to one.
Why there is no PER column
The obvious next column would be a price-earnings ratio. We are not printing one, for two separate reasons.
For HYBE the reason is arithmetic: net profit is negative, so the ratio is either negative or not defined at all. A negative PER is not a small PER — it is not a PER. We leave it out rather than print a number that looks comparable and is not.
For the four profitable companies the reason is dates. The market capitalisation above is one trading day, 8 September 2026. The profit figures are the twelve months to December 2025. Those are months apart, and a ratio built across that gap is a trailing annual figure, not a current one. It can be computed — the inputs are all in the table — but it should be computed by someone who knows they are doing that, which is why we publish the inputs and the dates instead of the quotient.
The same rule runs through our Korea valuation tape, where 929 of the 2,499 listed Korean companies with a readable annual filing reported net profit of zero or less. Loss-making is not an entertainment-industry condition. It is a third of the listed market.
What is unmeasured
CJ E&M sits in our company list and has neither a 2025 filing nor a market capitalisation in the datasets we hold. It is not counted as zero and it is not quietly dropped: it is named here as unmeasured, and the six above are what we can actually see.
Method
Every figure comes from the company’s own consolidated annual filing for fiscal 2025, retrieved through the DART open API run by Korea’s Financial Supervisory Service, with the filing receipt number held alongside each row. Both year columns come from the same filing, so the comparison is the company’s own. Market capitalisation comes from the Korean government public data portal daily price dataset (15094808), which is marked as carrying no usage restriction.
Nothing here is a forecast, a target, or a view on any share. This is not investment advice.
Where these numbers come from
Sources
- Financial Supervisory Service (DART) — Annual consolidated financial statements for fiscal year 2025, filed March 2026, retrieved through the DART open API. Every figure below is the current-period column of the filed statement, not an estimate. Filing receipt numbers are held with the data. · https://opendart.fss.or.kr
- Korea Public Data Portal — Stock Price Information — Dataset 15094808, Financial Services Commission, marked as carrying no usage restriction. Market capitalisation as of the trading day 8 September 2026. · https://www.data.go.kr
What we checked
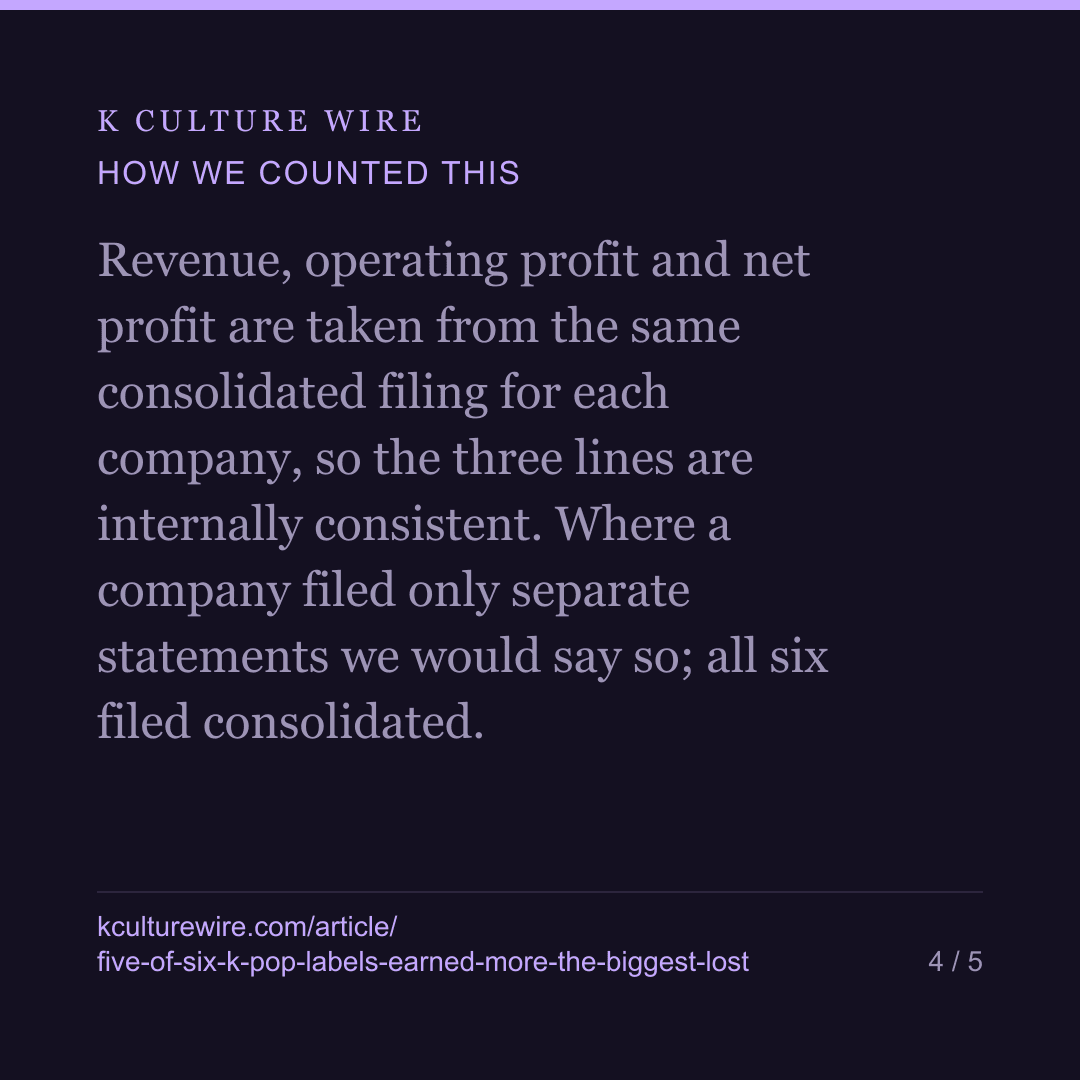
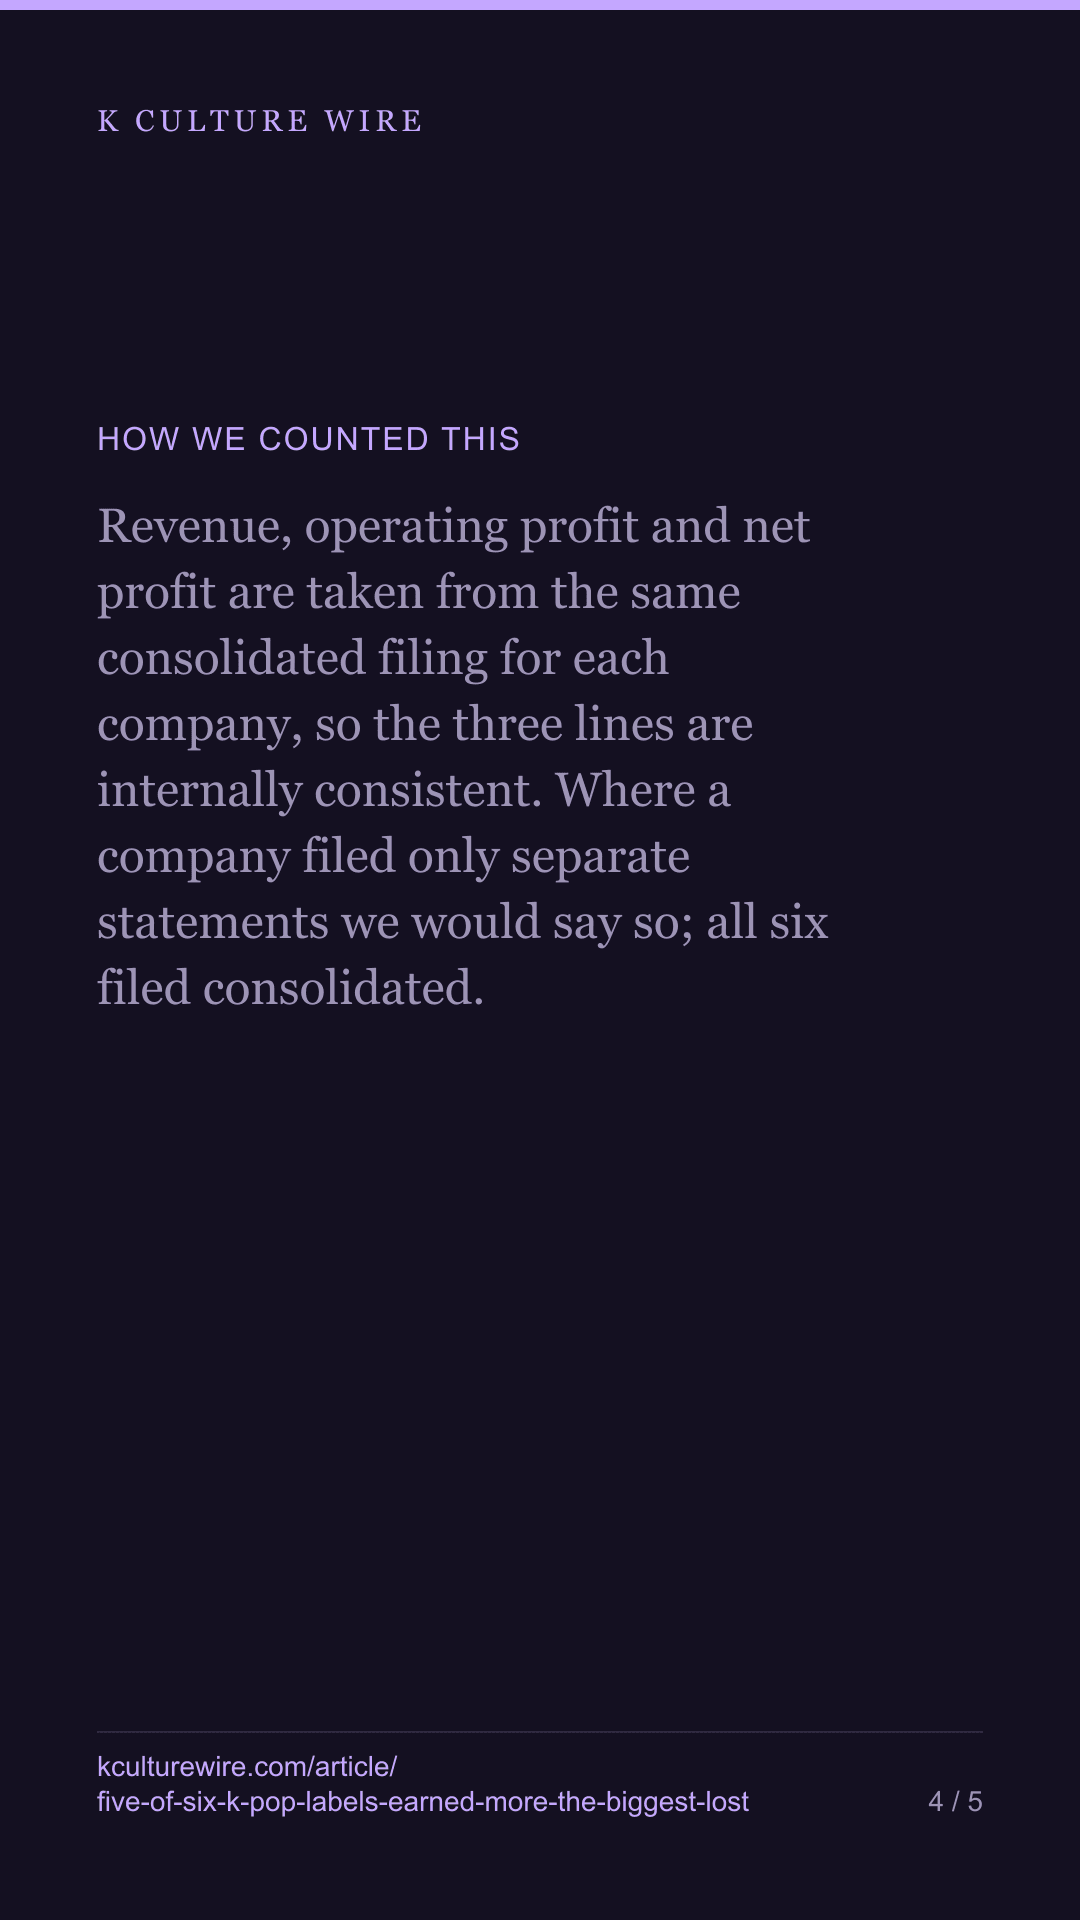
- Revenue, operating profit and net profit are taken from the same consolidated filing for each company, so the three lines are internally consistent. Where a company filed only separate statements we would say so; all six filed consolidated.
- Both the current and prior year columns come from the same filing, so the year-on-year change is the company's own restated comparison rather than two documents stitched together by us.
- Market capitalisation is a single trading day and the profit figures are a full financial year. The two are months apart, which is why we do not publish a price-earnings ratio for the profitable ones here.
- CJ E&M appears in our company list but has neither a 2025 filing nor a market capitalisation in the datasets we hold, so it is reported as unmeasured rather than counted as zero.
What we left out, and why
- Any price-earnings or price-book ratio. The market cap date and the fiscal year are months apart, and for the largest company net profit is negative, which makes the ratio meaningless rather than large.
- Any explanation of why the largest company lost money. The filing gives the number, not the cause, and we are not going to supply a cause we did not measure.
- Any forecast, target, or view on whether any of these shares are worth holding. This is not investment advice.
- CJ E&M, for want of both a filing and a market capitalisation in our datasets.
The data behind this
Written from the same data
Take this away — 10 cards
The figures in this article, as images. Free to repost with the address on them.



If you work in this business
Everything on this page is measured from the same weekly Netflix lists, per market and per title. We publish the pages free; what we sell is the same measurement cut to one company's catalogue — including the figures behind /label-accounts and /cap-per-artist.
What a company sheet contains, and what it cannot tell you →