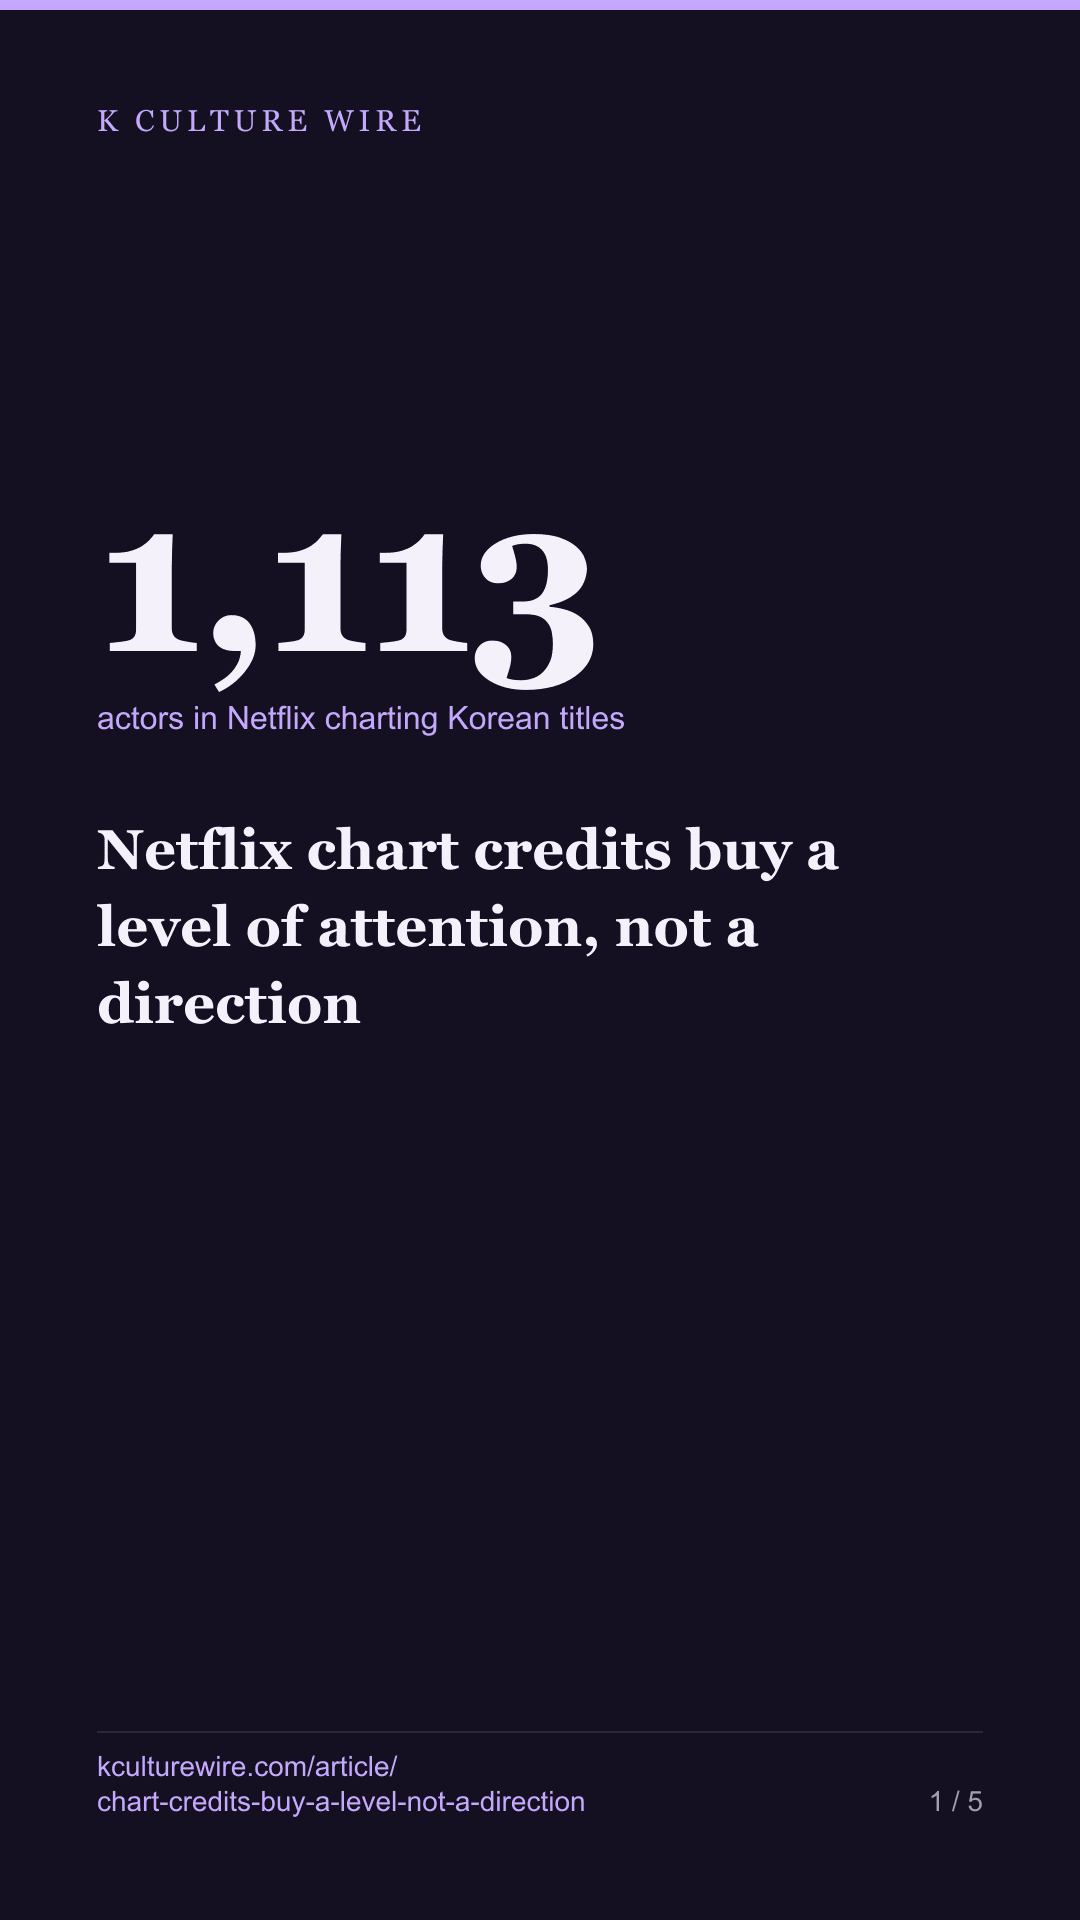
Netflix chart credits buy a level of attention, not a direction
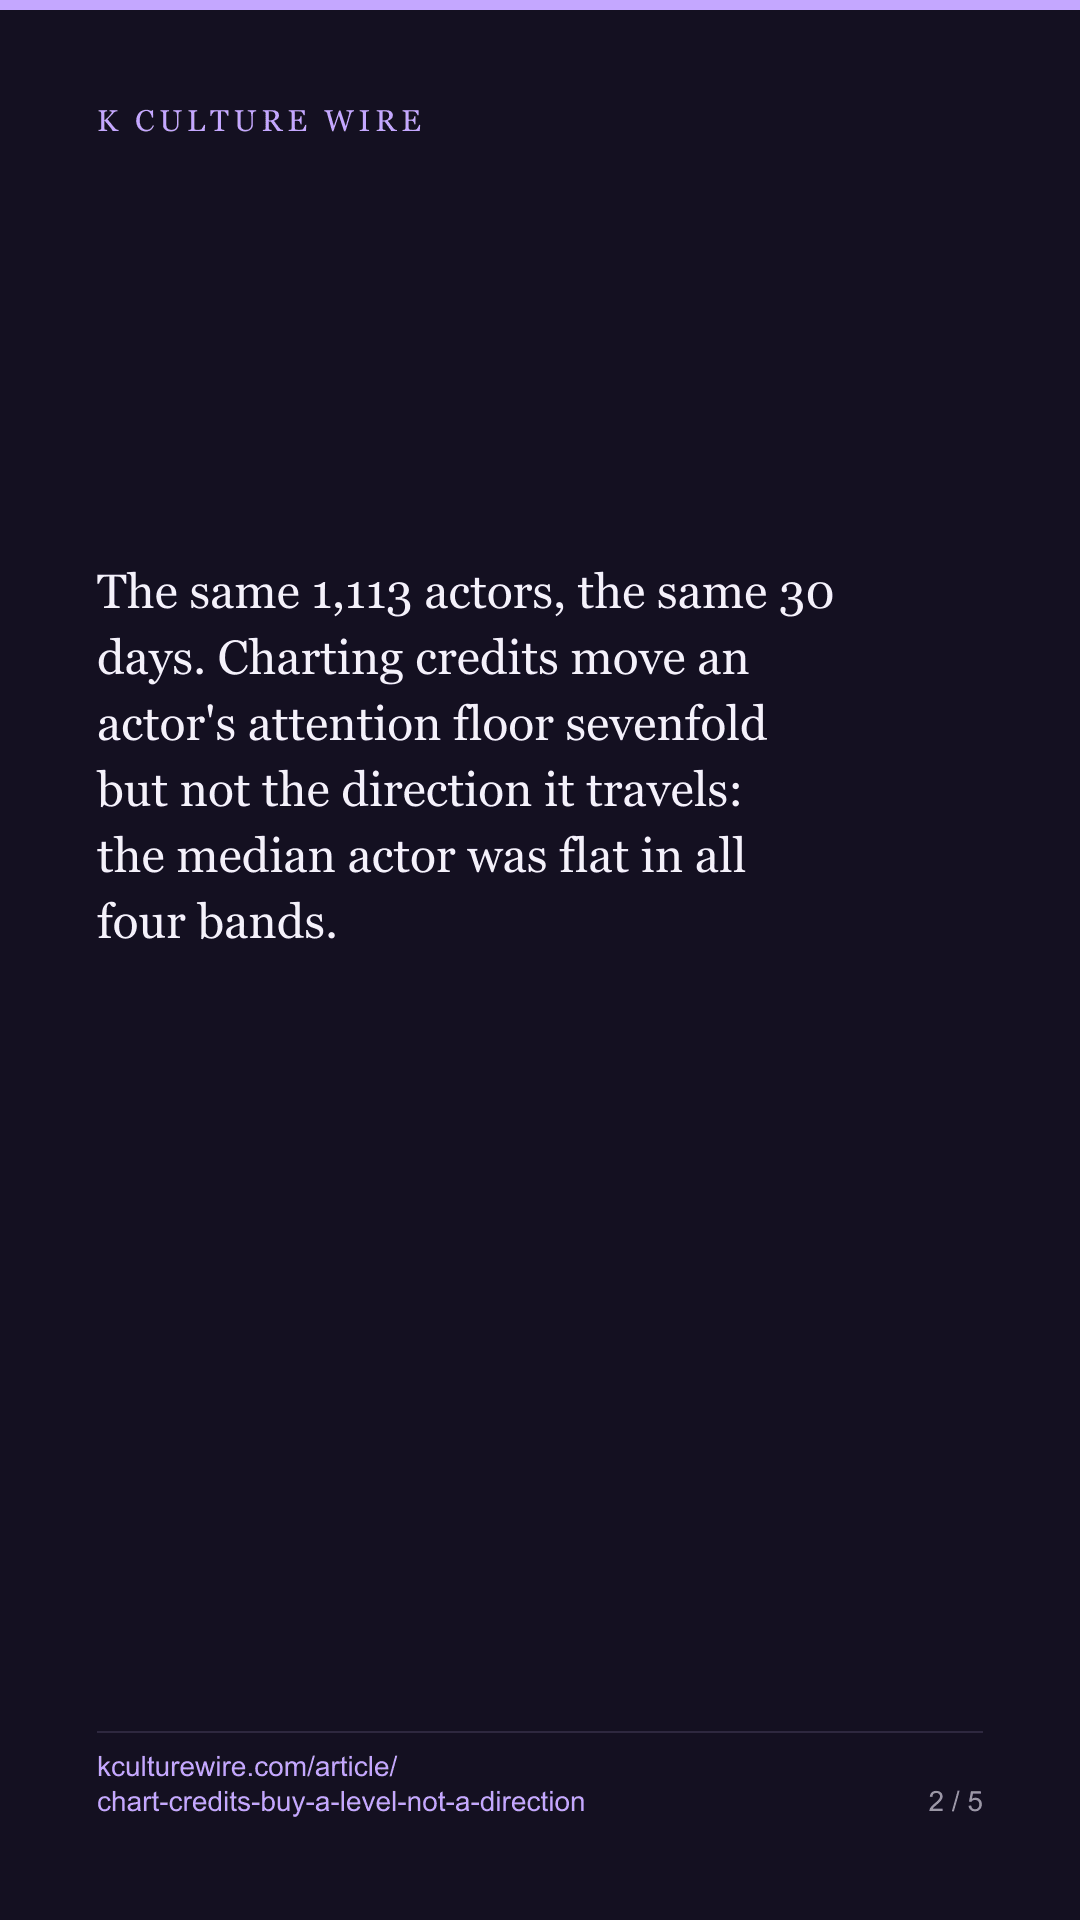
The same 1,113 actors, the same 30 days. Charting credits move an actor's attention floor sevenfold but not the direction it travels: the median actor was flat in all four bands. The trend we did see failed its own resampling test.
The table this is written from: /kpop-attention
Yesterday we published a measurement on 1,113 actors credited in Netflix’s charting Korean titles: as charting credits pile up, the floor of English Wikipedia attention rises about sevenfold, while the ceiling does not move at all.
That was a measurement of level. It said nothing about direction. So we went back to the same file and asked the next question: over these 30 days, did the actors with more charting work see their attention travel differently?
The answer is no — in a way worth showing, because the first version of this article said yes.
The median month was flat, in every band
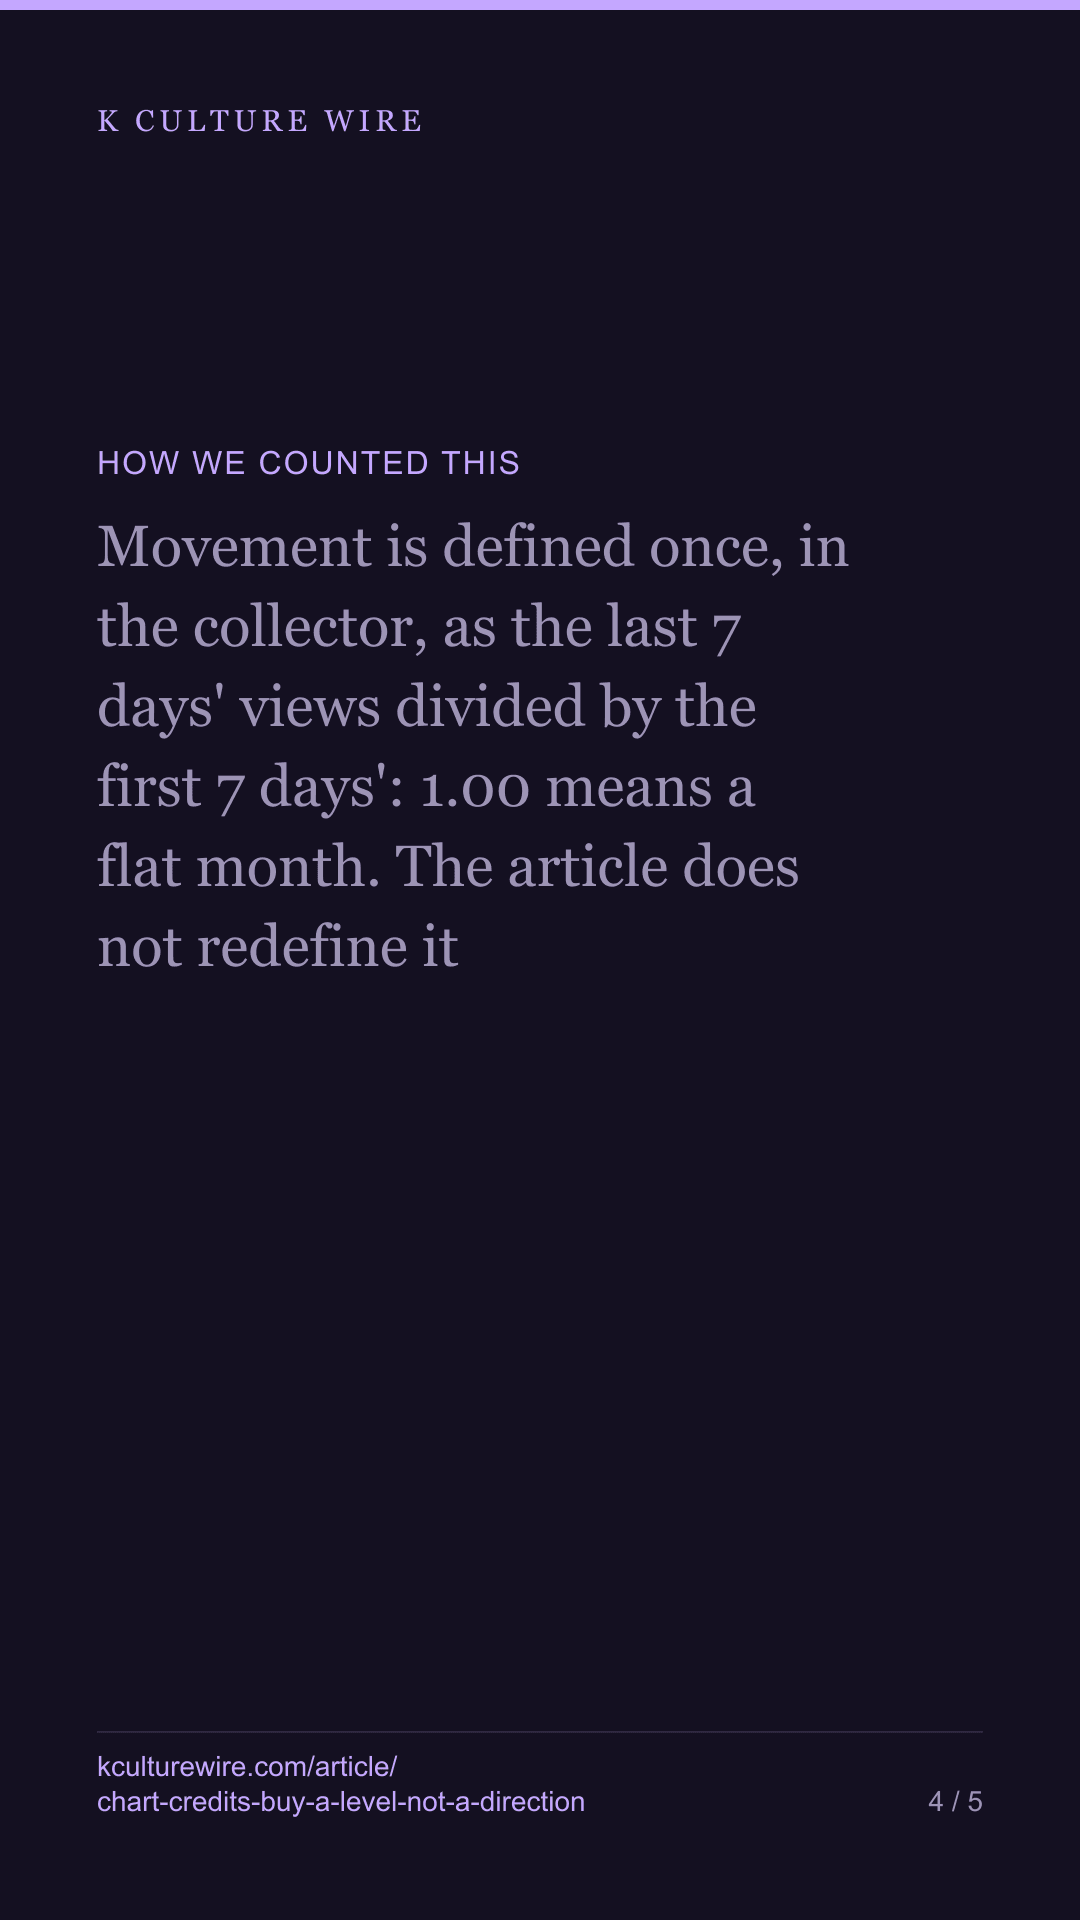
The collector already stores a movement figure for each actor: the last 7 days of views divided by the first 7. A value of 1.00 is a flat month. Above 1, attention ended higher than it began.
| Charting credits | Actors | Median movement | 90% range for that median |
|---|---|---|---|
| 1 | 446 | 0.98 | 0.96 – 1.00 |
| 2–3 | 362 | 1.01 | 1.00 – 1.05 |
| 4–6 | 199 | 1.03 | 1.00 – 1.05 |
| 7+ | 106 | 1.04 | 1.00 – 1.09 |
Four bands, four medians, all sitting on 1.00. The ranges beside them are what the median does when the same band is drawn again 10,000 times, and all four overlap. An actor credited in seven or more charting titles had the same flat month as an actor credited in one.
Read together with yesterday: chart credits buy you a level of attention. They do not buy a direction.
The finding we deleted
There was a second pattern in this data, and it looked clean. The interquartile width — how far apart the middle half of actors sit — narrows with every single band:
| Charting credits | Middle-half width | Actors moving more than 2x or less than 0.5x |
|---|---|---|
| 1 | 0.31 | 6.3% |
| 2–3 | 0.27 | 5.0% |
| 4–6 | 0.26 | 6.5% |
| 7+ | 0.25 | 3.8% |
A monotone 0.31 → 0.27 → 0.26 → 0.25 is exactly the shape a headline wants: more work, steadier attention. We wrote that headline. Two checks took it away.
The second measure does not agree. We report two measures of movement precisely so that one can contradict the other, and here it does: the share of actors moving by more than 2x or less than half falls, then rises to 6.5% in the 4–6 band, then falls. A rule that only one of two measures can see is not a rule we will print.
And the narrowing is what a smaller sample looks like. The bottom band holds 446 actors and the top holds 106. Narrow groups look tidier for arithmetic reasons alone. So we drew 106 actors at random out of the 446-actor band, ten thousand times, and measured the width each time:
| Drawing 106 from the 446-actor band | Middle-half width |
|---|---|
| Median of 10,000 draws | 0.300 |
| 5th percentile | 0.240 |
| 95th percentile | 0.370 |
| Draws at or below the top band’s 0.25 | 11.2% |
About one draw in nine came out at least as tidy as the top band — using data from the band we were comparing it against. Shrinking a group to 106 people reproduces the whole effect roughly one time in nine. That is not a finding. That is a sample size.
So the narrowing is recorded here as unmeasured, not as a result. If it is real, 106 actors cannot show it.
Why we published the nothing
The pattern was monotone across four bands, the direction fit a story that already sounded true, and it agreed with yesterday’s article. Everything about it was persuasive except whether it was there.
The test that killed it is committed alongside the script, with a fixed seed so the 11.2% comes out the same for anyone who runs it, and with its own self-tests proving the test can actually fire. Anyone can re-run the measurement and get this article’s numbers back.
Reporting that we measured something and could not find it is a result. The alternative is a chart that looks like knowledge and is not, and that is worse than an empty table — a wrong number makes every right number beside it suspect.
This is a count of readers over 30 days, not a judgment of anyone’s career.
The table behind this is at kculturewire.com/kpop-attention.
Where these numbers come from
Sources
- Wikimedia — Pageviews API, en.wikipedia, all-access, user agents only, 2026-07-24 to 2026-08-22, 30 days; 1,113 actors, all 1,113 with both a credit count and a movement figure, 0 gaps · https://wikimedia.org/api/rest_v1/
- Wikidata / Netflix — Cast list built from Wikidata P161 for Korean titles that appeared in Netflix's Top 10 tables; the credit count per actor is the number of those charting titles they are credited in · https://www.wikidata.org/
What we checked
- Movement is defined once, in the collector, as the last 7 days' views divided by the first 7 days': 1.00 means a flat month. The article does not redefine it
- Two independent measures of movement are reported together, an interquartile width and a count of large movers, specifically so that one of them can contradict the other. One of them did
- The resampling test uses a seeded generator, so the 11.2% figure below is reproducible by anyone running the script; a self-test asserts that two runs return the same number
- The resampling test is itself tested three ways: drawing a band against its own width returns roughly half, an absurdly narrow target returns under 5%, and an absurdly wide one returns 100%
- All 1,113 actors have a movement figure. None was filled with a zero, and the script prints both gap counts, which are 0 and 0
- Band edges live in one place in the script and are tested at 1, 3, 4, 6 and 7
What we left out, and why
- Cause, in either direction
- The 16 days between the two comparison windows. This measure looks at two 7-day blocks and is blind to what happened in between
- Korean-language attention. English Wikipedia is one language edition
- Work that never charted. Credit counts here come from Netflix's Top 10 tables and are not filmographies
- Any claim that attention got steadier as credits rose. We measured it, we could not separate it from sampling noise, and it is reported as unmeasured rather than as a finding
The data behind this
Written from the same data
Take this away — 10 cards
The figures in this article, as images. Free to repost with the address on them.
If you work in this business
Everything on this page is measured from the same weekly Netflix lists, per market and per title. We publish the pages free; what we sell is the same measurement cut to one company's catalogue — including the figures behind /kpop-attention.
What a company sheet contains, and what it cannot tell you →