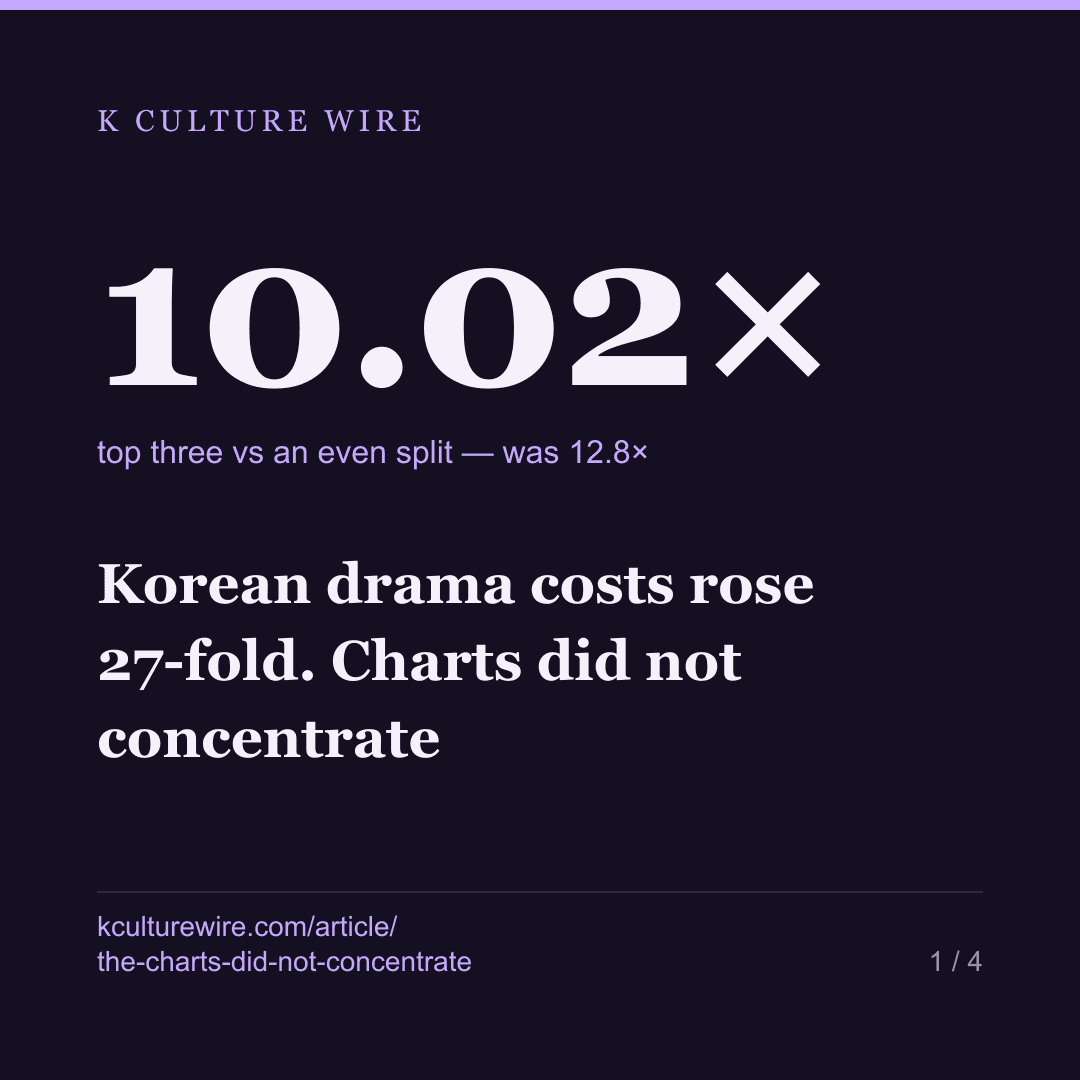
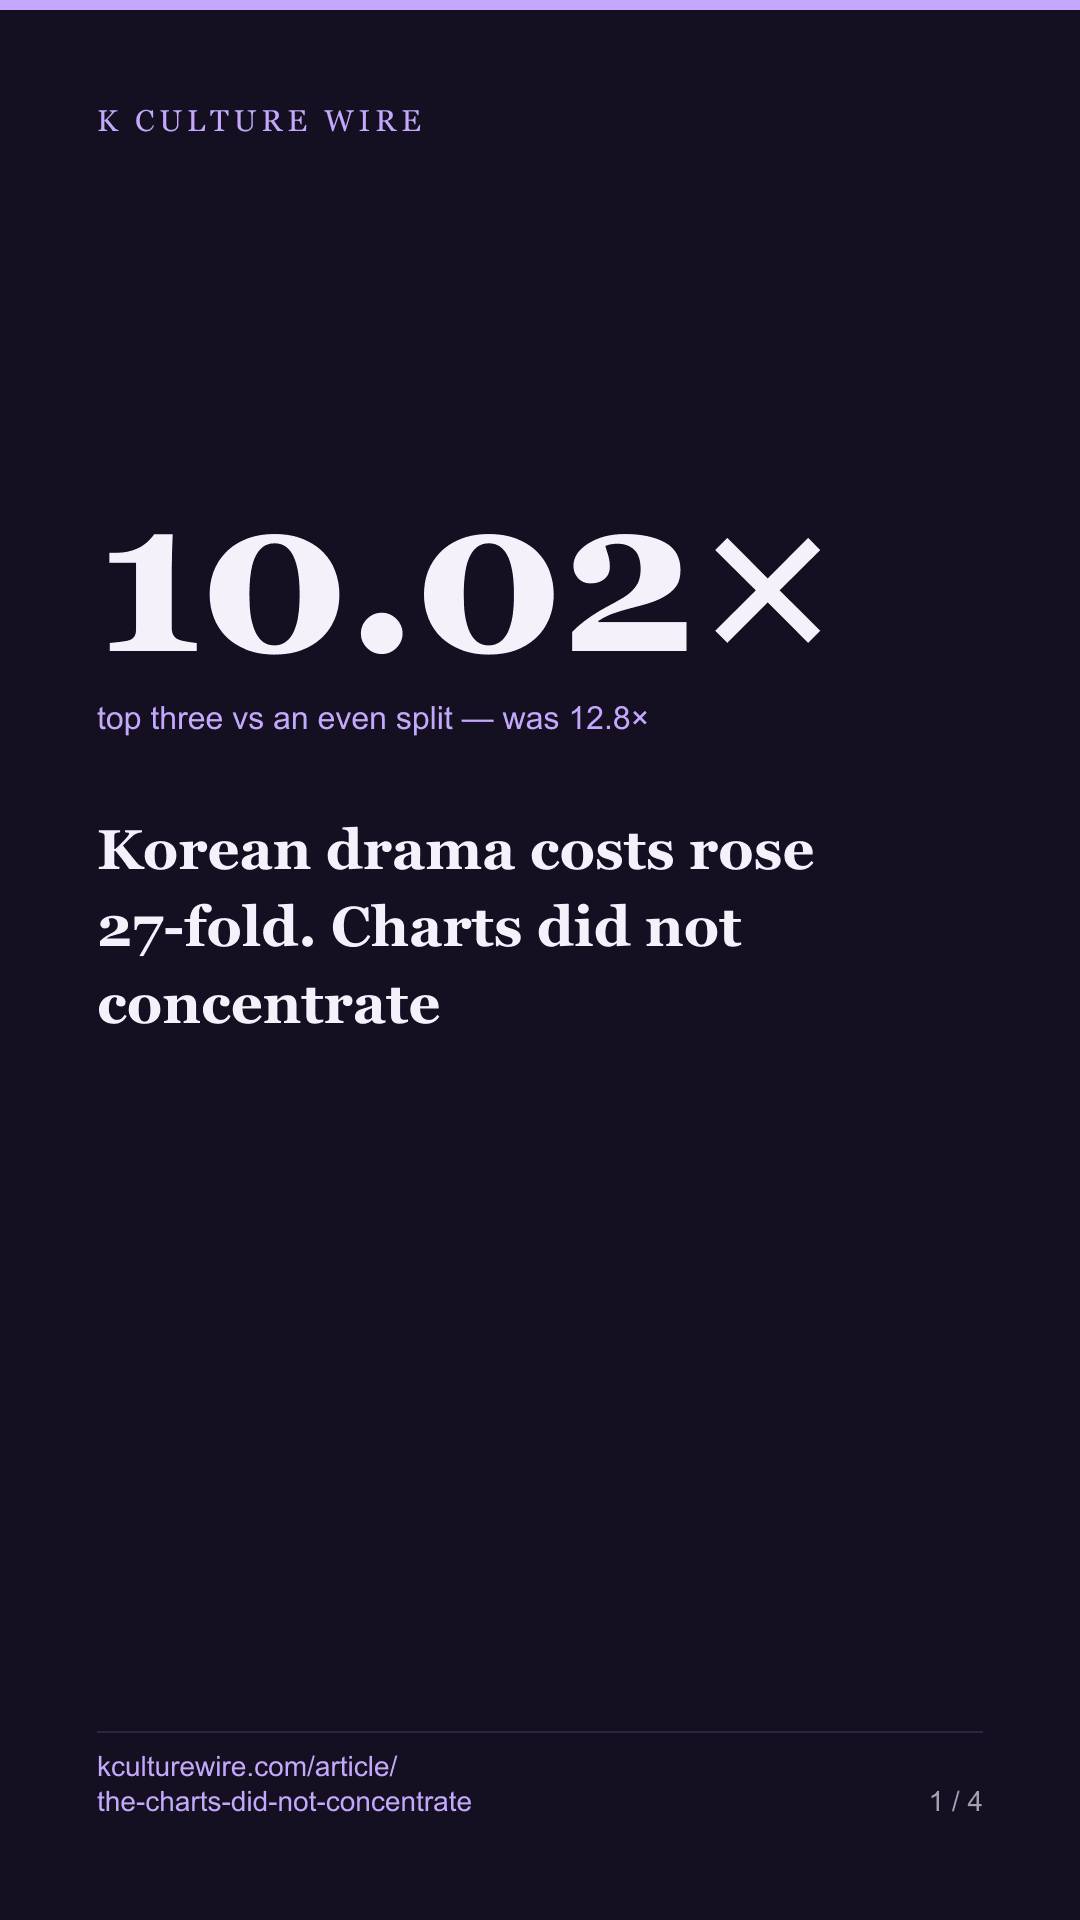
Korean drama costs rose 27-fold. Charts did not concentrate
The leverage argument runs through cost — $360,000 an episode in 2015 against far more now. We tested what it predicts on the charts. It did not appear.
The table this is written from: /leverage
The number doing the work in the current argument about Korean drama is a cost. Around $360,000 an episode in 2015; roughly $9.8m an episode for the second season of Squid Game in 2024. A 27-fold rise in under a decade.
Those are not our figures. We hold no budgets, no licence fees and no commissioning terms, and nothing on this page changes that. They are here because of what people build on top of them: if a Korean series now costs that much, only a few buyers on earth can pay for one, and the business should be concentrating into fewer hands.
That second part is not a claim about money. It is a claim about who ends up on the shelf — and that we can measure. So we did.
What we counted
Every Korean series that reached any country’s Netflix top 10 between July 2021 and July 2026: 499,180 chart rows across 93 markets, each title joined to the companies Wikidata credits as its producer, first broadcaster or distributor. Then, year by year, one question: how few companies does it take to cover half of that year’s titles?
If leverage concentrated, that number should be falling. The full table, every year including the part years, is at did the charts concentrate?.
It is not falling
| Year | Titles charting | Companies | Half covered by | If shared equally |
|---|---|---|---|---|
| 2021 (part year) | 63 | 32 | 3 | 16 |
| 2022 | 111 | 60 | 3 | 30 |
| 2023 | 98 | 91 | 5 | 46 |
| 2024 | 63 | 55 | 6 | 28 |
| 2025 | 69 | 55 | 3 | 28 |
| 2026 (part year) | 42 | 38 | 3 | 19 |
Three companies covering half of 111 titles is an extraordinary degree of concentration — the right-hand column is what an even spread would need, and it is 30. But the extraordinary part was already there in 2022, and it is the same three-against-28 in 2025. Across the four full years the figure does not move.
That column has a defect worth saying out loud: it can only change one whole company at a time. A measure that moves in steps of one is too blunt to read a four-year trend from, and quoting 90% against 89.3% off the back of it would be dressing up a rounding artefact as a finding.
So here is the same question asked with a measure that moves continuously — the share of each year’s titles covered by the three largest companies, divided by what those same three would cover if every company held an equal number:
| Year | Top three cover | Even split would give | Ratio |
|---|---|---|---|
| 2022 | 64% | 5% | 12.8× |
| 2023 | 42.9% | 3.3% | 13× |
| 2024 | 46% | 5.5% | 8.36× |
| 2025 | 55.1% | 5.5% | 10.02× |
The three largest companies cover roughly ten times what an even split would give them. The Korean chart is heavily concentrated, and it always has been in the years we can see.
But the direction is down, not up. 11.56× in 2022 against 9.81× in 2025. Whatever the 27-fold cost rise did, it did not show up here as the charts closing around fewer companies.
What we are not telling you, and why
One other thing moved, and we are not reporting it as a result.
The share of charting titles that passed through a broadcaster falls from 87.4% in 2022 to 79.7% in 2025 — the shape you would expect if commissioning were shifting away from Korean networks. It is the more interesting number on this page and we are leaving it on the floor, because recorded credits per title fall across exactly the same years, from 1.86 to 1.61. In our data a title that never had a broadcaster and a title whose broadcaster nobody has typed into Wikidata yet look identical.
The test for that is obvious: repeat the measurement only on titles whose entry is demonstrably filled in. We ran it. It leaves at most 23 titles in a year, and 7 in 2025 — one title moves that figure by fourteen points, and the decline we are testing is under nine. The control is weaker than the effect, which means it settles nothing in either direction.
So the honest report is: the broadcast share may have fallen, or Wikidata may have got slower. We cannot tell which, and a number we cannot tell apart from a recording lag is not evidence.
We have been caught by this before, and that time we could prove it: a clean 69% decline in new K-pop group debuts turned out to be the speed at which Wikidata records new groups — the same decline showed up for American, Japanese and British groups. The difference is only that we could run the control there and cannot here.
What this cannot answer
It cannot tell you what anyone paid. Netflix publishes chart positions and publishes no money at all, so nothing here speaks to whether $9.8m an episode is sustainable, who absorbed it, or what terms came with it.
It also cannot tell you that concentration is absent — three companies covering ten times an even share is concentration by any reading. The finding is narrower and duller than that: over the four years we can measure, it did not increase. An argument that runs “costs rose, therefore the business concentrated” has a step in it that our charts do not support.
And a company appearing on a chart is not the same as a company holding the rights, keeping the upside, or having any say in what gets made next. Those are the questions the cost figure is really about, and they are not in this data or in any data Netflix publishes.
Where these numbers come from
Sources
- Netflix — Tudum weekly Top 10 country lists, 499,180 rows read, 2021-07-04 to 2026-08-16, 93 markets · https://www.netflix.com/tudum/top10
- Wikidata — Production company (P272), original broadcaster (P449) and distributor (P750) credits for Korean titles · https://query.wikidata.org
What we checked
- Concentration is measured two ways, because the first way can only move a whole company at a time and is too blunt to read a trend from
- Each year is compared against what the same companies would cover if titles were shared out equally, so a year with fewer charting titles is not counted as more concentrated for that reason alone
- 2021 and 2026 are part-years and are shown as such rather than folded into the trend
- A second apparent finding, a fall in titles passing through a broadcaster, is reported as untested rather than as a result, because the control for it has at most 23 titles in a year
What we left out, and why
- Russia, excluded across this publication because Netflix withdrew and the remaining weeks are not comparable
- Production budgets, licence fees and commissioning terms, none of which exist in any data we hold
The data behind this
Written from the same data
Take this away — 8 cards
The figures in this article, as images. Free to repost with the address on them.
If you work in this business
Everything on this page is measured from the same weekly Netflix lists, per market and per title. We publish the pages free; what we sell is the same measurement cut to one company's catalogue — including the figures behind /leverage.
What a company sheet contains, and what it cannot tell you →